By Helgi Library - December 15, 2021
inwido made a net profit of SEK 501 mil with revenues of SEK 6,681 mil in 2020, up by 15.6% and up by 0.759%, respe...
By Helgi Library - December 15, 2021
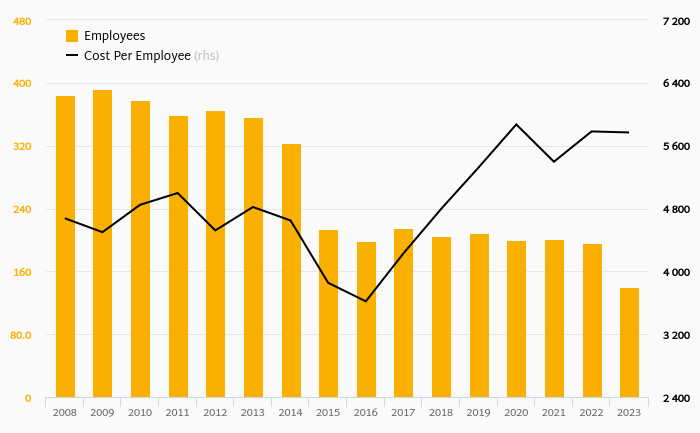
inwido employed 4,345 employees in 2020, down 1.25% compared to the previous year. Historically, between 2009 and 2020,...
By Helgi Library - December 15, 2021
inwido stock traded at SEK 121 per share at the end 2020 translating into a market capitalization of USD 849 mil. Since the end o...
| Profit Statement | 2023 | 2024 | 2025 | |
| Sales | SEK mil | 8,010 | 8,152 | 8,351 |
| Gross Profit | SEK mil | 2,171 | ... | ... |
| EBITDA | SEK mil | 1,190 | 1,188 | 1,221 |
| EBIT | SEK mil | 934 | 947 | 978 |
| Financing Cost | SEK mil | 43.5 | 43.5 | 43.5 |
| Pre-Tax Profit | SEK mil | 890 | 904 | 935 |
| Net Profit | SEK mil | 693 | 705 | 729 |
| Dividends | SEK mil | 346 | 352 | 364 |
| Balance Sheet | 2023 | 2024 | 2025 | |
| Total Assets | SEK mil | ... | ... | ... |
| Non-Current Assets | SEK mil | ... | ... | ... |
| Current Assets | SEK mil | ... | ... | ... |
| Working Capital | SEK mil | ... | ... | ... |
| Shareholders' Equity | SEK mil | 5,255 | 5,614 | 5,990 |
| Liabilities | SEK mil | ... | ... | ... |
| Total Debt | SEK mil | ... | ... | ... |
| Net Debt | SEK mil | 326 | 300 | 250 |
| Ratios | 2023 | 2024 | 2025 | |
| ROE | % | 13.6 | 13.0 | 12.6 |
| ROCE | % | ... | ... | ... |
| Gross Margin | % | 27.1 | ... | ... |
| EBITDA Margin | % | 14.9 | 14.6 | 14.6 |
| EBIT Margin | % | 11.7 | 11.6 | 11.7 |
| Net Margin | % | 8.65 | 8.64 | 8.73 |
| Net Debt/EBITDA | 0.274 | 0.253 | 0.205 | |
| Net Debt/Equity | % | 6.20 | 5.34 | 4.17 |
| Cost of Financing | % | ... | ... | ... |
| Valuation | 2023 | 2024 | 2025 | |
| Market Capitalisation | USD mil | 1,103 | 1,103 | 1,103 |
| Enterprise Value (EV) | USD mil | 1,140 | 1,137 | 1,131 |
| Number Of Shares | mil | 58.0 | 58.0 | 58.0 |
| Share Price | SEK | 169 | 169 | 169 |
| EV/EBITDA | 8.51 | 8.50 | 8.23 | |
| EV/Sales | 1.26 | 1.24 | 1.20 | |
| Price/Earnings (P/E) | 14.1 | 13.9 | 13.4 | |
| Price/Book Value (P/BV) | 1.86 | 1.75 | 1.64 | |
| Dividend Yield | % | 3.54 | 3.60 | 3.72 |
Get all company financials in excel:
| overview | Unit | 2009 | 2010 | 2011 | 2012 | 2013 | 2014 | 2015 | 2016 | 2017 | 2018 | 2019 | 2020 | 2021 | 2022 | 2023 | 2024 | 2025 |
| income statement | ||||||||||||||||||
| Sales | SEK mil | 6,371 | 6,667 | 6,631 | 6,681 | 7,547 | ||||||||||||
| Gross Profit | SEK mil | 1,646 | 1,712 | 1,694 | 1,736 | 2,023 | ... | ... | ||||||||||
| EBIT | SEK mil | 522 | 617 | 600 | 691 | 892 | ||||||||||||
| Net Profit | SEK mil | 291 | 433 | 433 | 501 | 667 | ||||||||||||
| ROE | % | 9.41 | 13.0 | 11.9 | 12.6 | 15.3 | ||||||||||||
| EBIT Margin | % | 8.19 | 9.25 | 9.05 | 10.3 | 11.8 | ||||||||||||
| Net Margin | % | 4.56 | 6.49 | 6.53 | 7.49 | 8.83 | ||||||||||||
| Employees | 4,361 | 4,500 | 4,400 | 4,345 | ... | ... | ... | ... | ... | |||||||||
| balance sheet | ||||||||||||||||||
| Total Assets | SEK mil | 6,652 | 7,153 | 7,471 | 8,017 | ... | ... | ... | ... | ... | ||||||||
| Non-Current Assets | SEK mil | 4,963 | 5,604 | 6,025 | 5,846 | ... | ... | ... | ... | ... | ||||||||
| Current Assets | SEK mil | 1,689 | 1,549 | 1,446 | 2,171 | ... | ... | ... | ... | ... | ||||||||
| Shareholders' Equity | SEK mil | 3,167 | 3,501 | 3,776 | 4,155 | 4,561 | ||||||||||||
| Liabilities | SEK mil | 3,485 | 3,652 | 3,695 | 3,862 | ... | ... | ... | ... | ... | ||||||||
| Non-Current Liabilities | SEK mil | 1,851 | 2,347 | 2,344 | 2,259 | ... | ... | ... | ... | ... | ||||||||
| Current Liabilities | SEK mil | 1,634 | 1,306 | 1,351 | 1,603 | ... | ... | ... | ... | ... | ||||||||
| Net Debt/EBITDA | 2.40 | 2.76 | 2.41 | 1.20 | 0.810 | |||||||||||||
| Net Debt/Equity | % | 53.2 | 61.7 | 55.4 | 26.8 | 20.2 | ||||||||||||
| Cost of Financing | % | ... | 2.11 | 2.24 | 2.10 | 2.14 | ... | ... | ... | ... | ... | |||||||
| cash flow | ||||||||||||||||||
| Total Cash From Operations | SEK mil | 592 | 434 | 926 | 1,209 | ... | ... | ... | ... | ... | ||||||||
| Total Cash From Investing | SEK mil | -244 | -629 | -274 | -180 | ... | ... | ... | ... | ... | ||||||||
| Total Cash From Financing | SEK mil | -249 | -53.6 | -574 | -111 | ... | ... | ... | ... | ... | ||||||||
| Net Change In Cash | SEK mil | 101 | -245 | 77.8 | 890 | ... | ... | ... | ... | ... | ||||||||
| valuation | ||||||||||||||||||
| Market Capitalisation | USD mil | ... | ... | ... | ... | ... | 594 | 363 | 447 | 849 | 1,103 | |||||||
| Enterprise Value (EV) | USD mil | ... | ... | ... | ... | ... | 800 | 607 | 670 | 984 | 1,207 | |||||||
| Number Of Shares | mil | 58.1 | 58.1 | 58.0 | 58.0 | 58.0 | ||||||||||||
| Share Price | SEK | ... | ... | ... | ... | ... | 74.5 | 51.8 | 69.9 | 121 | 169 | |||||||
| Price/Earnings (P/E) | ... | ... | ... | ... | ... | 14.9 | 6.95 | 9.35 | 14.0 | 14.7 | ||||||||
| Price/Cash Earnings (P/CE) | ... | ... | ... | ... | ... | 10.5 | 5.42 | 7.20 | 9.92 | 10.9 | ||||||||
| EV/EBITDA | ... | ... | ... | ... | ... | 9.83 | 6.67 | 7.04 | 9.28 | 9.06 | ||||||||
| Price/Book Value (P/BV) | ... | ... | ... | ... | ... | 1.37 | 0.859 | 1.07 | 1.68 | 2.15 | ||||||||
| Dividend Yield | % | ... | ... | ... | ... | ... | 4.70 | 6.76 | 3.57 | 3.74 | 3.40 |
| income statement | Unit | 2009 | 2010 | 2011 | 2012 | 2013 | 2014 | 2015 | 2016 | 2017 | 2018 | 2019 | 2020 | 2021 | 2022 | 2023 | 2024 | 2025 |
| income statement | ||||||||||||||||||
| Sales | SEK mil | 6,371 | 6,667 | 6,631 | 6,681 | 7,547 | ||||||||||||
| Cost of Goods & Services | SEK mil | 4,725 | 4,954 | 4,937 | 4,945 | 5,524 | ... | ... | ||||||||||
| Gross Profit | SEK mil | 1,646 | 1,712 | 1,694 | 1,736 | 2,023 | ... | ... | ||||||||||
| Selling, General & Admin | SEK mil | 1,031 | 1,066 | 1,035 | 996 | ... | ... | ... | ... | ... | ||||||||
| Research & Development | SEK mil | 51.8 | 50.5 | 53.7 | 38.4 | ... | ... | ... | ... | ... | ||||||||
| Other Operating Expense | SEK mil | 48.9 | 12.2 | 4.20 | 2.80 | ... | ... | ... | ... | ... | ||||||||
| Staff Cost | SEK mil | 2,063 | 2,102 | 2,091 | 1,942 | ... | ... | ... | ... | ... | ||||||||
| Other Operating Cost (Income) | SEK mil | 12.4 | 52.7 | 22.0 | 21.8 | ... | ... | ... | ... | ... | ||||||||
| EBITDA | SEK mil | 702 | 781 | 869 | 928 | 1,139 | ||||||||||||
| Depreciation | SEK mil | 119 | 122 | 130 | 204 | 234 | ||||||||||||
| EBIT | SEK mil | 522 | 617 | 600 | 691 | 892 | ||||||||||||
| Net Financing Cost | SEK mil | 40.9 | 46.3 | 46.7 | 47.9 | 52.2 | ||||||||||||
| Financing Cost | SEK mil | 43.1 | 49.6 | 49.0 | 49.0 | 52.2 | ||||||||||||
| Financing Income | SEK mil | 2.20 | 3.30 | 2.30 | 1.10 | ... | ... | ... | ... | ... | ||||||||
| FX (Gain) Loss | SEK mil | 11.7 | 0.400 | -23.7 | 10.3 | ... | ... | ... | ... | ... | ||||||||
| (Income) / Loss from Affiliates | SEK mil | -1.30 | -1.50 | -1.70 | -1.80 | ... | ... | ... | ... | ... | ||||||||
| Extraordinary Cost | SEK mil | 0 | 0 | 0 | 0 | ... | ... | ... | ... | ... | ||||||||
| Pre-Tax Profit | SEK mil | 461 | 562 | 558 | 624 | 839 | ||||||||||||
| Tax | SEK mil | 136 | 124 | 125 | 123 | 173 | ||||||||||||
| Minorities | SEK mil | 34.0 | 5.50 | 0 | 0 | ... | ... | ... | ... | ... | ||||||||
| Net Profit | SEK mil | 291 | 433 | 433 | 501 | 667 | ||||||||||||
| Net Profit Avail. to Common | SEK mil | 291 | 433 | 433 | 501 | 667 | ||||||||||||
| Dividends | SEK mil | 203 | 145 | 0 | 261 | 333 | ||||||||||||
| growth rates | ||||||||||||||||||
| Total Revenue Growth | % | ... | 12.3 | 4.64 | -0.540 | 0.759 | 13.0 | |||||||||||
| Operating Cost Growth | % | ... | 18.7 | 1.04 | -2.86 | -4.30 | ... | ... | ... | ... | ... | |||||||
| Staff Cost Growth | % | ... | 15.6 | 1.91 | -0.519 | -7.14 | ... | ... | ... | ... | ... | |||||||
| EBITDA Growth | % | ... | -11.1 | 11.2 | 11.2 | 6.85 | 22.6 | |||||||||||
| EBIT Growth | % | ... | -20.3 | 18.2 | -2.63 | 15.0 | 29.1 | |||||||||||
| Pre-Tax Profit Growth | % | ... | -22.8 | 21.9 | -0.623 | 11.7 | 34.6 | |||||||||||
| Net Profit Growth | % | ... | -32.0 | 48.7 | 0.162 | 15.6 | 33.2 | |||||||||||
| ratios | ||||||||||||||||||
| ROE | % | 9.41 | 13.0 | 11.9 | 12.6 | 15.3 | ||||||||||||
| ROA | % | 4.49 | 6.27 | 5.92 | 6.46 | ... | ... | ... | ... | ... | ||||||||
| ROCE | % | ... | 5.83 | 7.96 | 7.31 | 8.75 | ... | ... | ... | ... | ... | |||||||
| Gross Margin | % | 25.8 | 25.7 | 25.5 | 26.0 | 26.8 | ... | ... | ||||||||||
| EBITDA Margin | % | 11.0 | 11.7 | 13.1 | 13.9 | 15.1 | ||||||||||||
| EBIT Margin | % | 8.19 | 9.25 | 9.05 | 10.3 | 11.8 | ||||||||||||
| Net Margin | % | 4.56 | 6.49 | 6.53 | 7.49 | 8.83 | ||||||||||||
| Payout Ratio | % | 69.8 | 33.5 | 0 | 52.1 | 50.0 | ||||||||||||
| Cost of Financing | % | ... | 2.11 | 2.24 | 2.10 | 2.14 | ... | ... | ... | ... | ... | |||||||
| Net Debt/EBITDA | 2.40 | 2.76 | 2.41 | 1.20 | 0.810 |
| balance sheet | Unit | 2009 | 2010 | 2011 | 2012 | 2013 | 2014 | 2015 | 2016 | 2017 | 2018 | 2019 | 2020 | 2021 | 2022 | 2023 | 2024 | 2025 |
| balance sheet | ||||||||||||||||||
| Cash & Cash Equivalents | SEK mil | 410 | 165 | 243 | 1,133 | ... | ... | ... | ... | ... | ||||||||
| Receivables | SEK mil | 567 | 596 | 512 | 401 | ... | ... | ... | ... | ... | ||||||||
| Inventories | SEK mil | 509 | 549 | 495 | 447 | ... | ... | ... | ... | ... | ||||||||
| Other ST Assets | SEK mil | 204 | 240 | 197 | 190 | ... | ... | ... | ... | ... | ||||||||
| Current Assets | SEK mil | 1,689 | 1,549 | 1,446 | 2,171 | ... | ... | ... | ... | ... | ||||||||
| Property, Plant & Equipment | SEK mil | 815 | 893 | 1,273 | 1,261 | ... | ... | ... | ... | ... | ||||||||
| LT Investments & Receivables | SEK mil | 5.30 | 2.70 | 2.70 | 2.30 | ... | ... | ... | ... | ... | ||||||||
| Intangible Assets | SEK mil | 4,046 | 4,618 | 4,651 | 4,491 | ... | ... | ... | ... | ... | ||||||||
| Goodwill | SEK mil | 3,785 | 4,281 | 4,337 | 4,208 | ... | ... | ... | ... | ... | ||||||||
| Non-Current Assets | SEK mil | 4,963 | 5,604 | 6,025 | 5,846 | ... | ... | ... | ... | ... | ||||||||
| Total Assets | SEK mil | 6,652 | 7,153 | 7,471 | 8,017 | ... | ... | ... | ... | ... | ||||||||
| Trade Payables | SEK mil | 999 | 916 | 1,011 | 1,267 | ... | ... | ... | ... | ... | ||||||||
| Short-Term Debt | SEK mil | 394 | 125 | 123 | 111 | ... | ... | ... | ... | ... | ||||||||
| Other ST Liabilities | SEK mil | 241 | 265 | 217 | 225 | ... | ... | ... | ... | ... | ||||||||
| Current Liabilities | SEK mil | 1,634 | 1,306 | 1,351 | 1,603 | ... | ... | ... | ... | ... | ||||||||
| Long-Term Debt | SEK mil | 1,702 | 2,199 | 2,212 | 2,135 | ... | ... | ... | ... | ... | ||||||||
| Other LT Liabilities | SEK mil | 149 | 148 | 132 | 124 | ... | ... | ... | ... | ... | ||||||||
| Non-Current Liabilities | SEK mil | 1,851 | 2,347 | 2,344 | 2,259 | ... | ... | ... | ... | ... | ||||||||
| Liabilities | SEK mil | 3,485 | 3,652 | 3,695 | 3,862 | ... | ... | ... | ... | ... | ||||||||
| Preferred Equity and Hybrid Capital | SEK mil | 0 | 0 | 0 | 0 | ... | ... | ... | ... | ... | ||||||||
| Share Capital | SEK mil | 232 | 1,178 | 1,178 | 1,178 | ... | ... | ... | ... | ... | ||||||||
| Treasury Stock | SEK mil | 0 | 0 | 0 | 0 | ... | ... | ... | ... | ... | ||||||||
| Equity Before Minority Interest | SEK mil | 3,068 | 3,496 | 3,776 | 4,155 | ... | ... | ... | ... | ... | ||||||||
| Minority Interest | SEK mil | 99.5 | 5.10 | 0 | 0 | ... | ... | ... | ... | ... | ||||||||
| Equity | SEK mil | 3,167 | 3,501 | 3,776 | 4,155 | 4,561 | ||||||||||||
| growth rates | ||||||||||||||||||
| Total Asset Growth | % | ... | 5.40 | 7.53 | 4.44 | 7.31 | ... | ... | ... | ... | ... | |||||||
| Shareholders' Equity Growth | % | ... | 5.13 | 10.5 | 7.84 | 10.1 | 9.77 | |||||||||||
| Net Debt Growth | % | ... | 0.131 | 28.0 | -3.07 | -46.8 | -17.2 | |||||||||||
| Total Debt Growth | % | ... | 5.20 | 10.9 | 0.499 | -3.83 | ... | ... | ... | ... | ... | |||||||
| ratios | ||||||||||||||||||
| Total Debt | SEK mil | 2,096 | 2,324 | 2,335 | 2,246 | ... | ... | ... | ... | ... | ||||||||
| Net Debt | SEK mil | 1,686 | 2,159 | 2,093 | 1,113 | 922 | ||||||||||||
| Working Capital | SEK mil | 76.0 | 229 | -4.70 | -419 | ... | ... | ... | ... | ... | ||||||||
| Capital Employed | SEK mil | 5,039 | 5,833 | 6,020 | 5,427 | ... | ... | ... | ... | ... | ||||||||
| Net Debt/Equity | % | 53.2 | 61.7 | 55.4 | 26.8 | 20.2 | ||||||||||||
| Current Ratio | 1.03 | 1.19 | 1.07 | 1.35 | ... | ... | ... | ... | ... | |||||||||
| Quick Ratio | 0.598 | 0.582 | 0.559 | 0.957 | ... | ... | ... | ... | ... |
| cash flow | Unit | 2009 | 2010 | 2011 | 2012 | 2013 | 2014 | 2015 | 2016 | 2017 | 2018 | 2019 | 2020 | 2021 | 2022 | 2023 | 2024 | 2025 |
| cash flow | ||||||||||||||||||
| Net Profit | SEK mil | 291 | 433 | 433 | 501 | 667 | ||||||||||||
| Depreciation | SEK mil | 119 | 122 | 130 | 204 | 234 | ||||||||||||
| Non-Cash Items | SEK mil | 6.90 | -82.7 | 12.0 | 37.0 | ... | ... | ... | ... | ... | ||||||||
| Change in Working Capital | SEK mil | 113 | -80.3 | 212 | 434 | ... | ... | ... | ... | ... | ||||||||
| Total Cash From Operations | SEK mil | 592 | 434 | 926 | 1,209 | ... | ... | ... | ... | ... | ||||||||
| Capital Expenditures | SEK mil | -196 | -208 | -235 | -177 | ... | ... | ... | ... | ... | ||||||||
| Net Change in LT Investment | SEK mil | -4.40 | -1.70 | -1.90 | -2.40 | ... | ... | ... | ... | ... | ||||||||
| Net Cash From Acquisitions | SEK mil | -43.7 | -420 | -37.0 | 0 | ... | ... | ... | ... | ... | ||||||||
| Other Investing Activities | SEK mil | 0 | 0 | 0 | 0 | ... | ... | ... | ... | ... | ||||||||
| Total Cash From Investing | SEK mil | -244 | -629 | -274 | -180 | ... | ... | ... | ... | ... | ||||||||
| Dividends Paid | SEK mil | -203 | -203 | -145 | 0 | ... | ... | ... | ... | ... | ||||||||
| Issuance Of Shares | SEK mil | 0 | 0 | 0 | 0 | ... | ... | ... | ... | ... | ||||||||
| Issuance Of Debt | SEK mil | -21.0 | 179 | -429 | -111 | ... | ... | ... | ... | ... | ||||||||
| Other Financing Activities | SEK mil | -25.4 | -29.6 | 0 | 0 | ... | ... | ... | ... | ... | ||||||||
| Total Cash From Financing | SEK mil | -249 | -53.6 | -574 | -111 | ... | ... | ... | ... | ... | ||||||||
| Effect of FX Rates | SEK mil | 3.10 | 3.60 | 0 | -28.5 | ... | ... | ... | ... | ... | ||||||||
| Net Change In Cash | SEK mil | 101 | -245 | 77.8 | 890 | ... | ... | ... | ... | ... | ||||||||
| ratios | ||||||||||||||||||
| Days Sales Outstanding | days | 32.5 | 32.6 | 28.2 | 21.9 | ... | ... | ... | ... | ... | ||||||||
| Days Sales Of Inventory | days | 39.3 | 40.4 | 36.6 | 33.0 | ... | ... | ... | ... | ... | ||||||||
| Days Payable Outstanding | days | 77.2 | 67.5 | 74.8 | 93.5 | ... | ... | ... | ... | ... | ||||||||
| Cash Conversion Cycle | days | -5.43 | 5.57 | -10.0 | -38.6 | ... | ... | ... | ... | ... | ||||||||
| Cash Earnings | SEK mil | 410 | 555 | 563 | 704 | 900 | ||||||||||||
| Free Cash Flow | SEK mil | 348 | -195 | 652 | 1,030 | ... | ... | ... | ... | ... | ||||||||
| Capital Expenditures (As % of Sales) | % | 3.07 | 3.11 | 3.54 | 2.65 | ... | ... | ... | ... | ... |
| other ratios | Unit | 2009 | 2010 | 2011 | 2012 | 2013 | 2014 | 2015 | 2016 | 2017 | 2018 | 2019 | 2020 | 2021 | 2022 | 2023 | 2024 | 2025 |
| Employees | 4,361 | 4,500 | 4,400 | 4,345 | ... | ... | ... | ... | ... | |||||||||
| Cost Per Employee | USD per month | 4,564 | 4,536 | 4,339 | 4,254 | ... | ... | ... | ... | ... | ||||||||
| Cost Per Employee (Local Currency) | SEK per month | 39,414 | 38,926 | 39,604 | 37,244 | ... | ... | ... | ... | ... | ||||||||
| Operating Cost (As % of Sales) | % | 17.8 | 17.2 | 16.8 | 16.0 | ... | ... | ... | ... | ... | ||||||||
| Research & Development (As % of Sales) | % | 0.813 | 0.758 | 0.810 | 0.575 | ... | ... | ... | ... | ... | ||||||||
| Staff Cost (As % of Sales) | % | 32.4 | 31.5 | 31.5 | 29.1 | ... | ... | ... | ... | ... | ||||||||
| Effective Tax Rate | % | 29.5 | 22.1 | 22.4 | 19.7 | 20.6 | ||||||||||||
| Total Revenue Growth (5-year average) | % | ... | ... | ... | ... | ... | 6.70 | 9.17 | 6.17 | 5.06 | 5.88 | |||||||
| Total Revenue Growth (10-year average) | % | ... | ... | ... | ... | ... | ... | ... | ... | ... | ... | 2.81 | 2.64 | 4.10 |
| valuation | Unit | 2009 | 2010 | 2011 | 2012 | 2013 | 2014 | 2015 | 2016 | 2017 | 2018 | 2019 | 2020 | 2021 | 2022 | 2023 | 2024 | 2025 |
| Market Capitalisation | USD mil | ... | ... | ... | ... | ... | 594 | 363 | 447 | 849 | 1,103 | |||||||
| Enterprise Value (EV) | USD mil | ... | ... | ... | ... | ... | 800 | 607 | 670 | 984 | 1,207 | |||||||
| Number Of Shares | mil | 58.1 | 58.1 | 58.0 | 58.0 | 58.0 | ||||||||||||
| Share Price | SEK | ... | ... | ... | ... | ... | 74.5 | 51.8 | 69.9 | 121 | 169 | |||||||
| EV/EBITDA | ... | ... | ... | ... | ... | 9.83 | 6.67 | 7.04 | 9.28 | 9.06 | ||||||||
| Price/Earnings (P/E) | ... | ... | ... | ... | ... | 14.9 | 6.95 | 9.35 | 14.0 | 14.7 | ||||||||
| Price/Cash Earnings (P/CE) | ... | ... | ... | ... | ... | 10.5 | 5.42 | 7.20 | 9.92 | 10.9 | ||||||||
| P/FCF | ... | ... | ... | ... | ... | 12.4 | -15.4 | 6.22 | 6.78 | ... | ... | ... | ... | ... | ||||
| Price/Book Value (P/BV) | ... | ... | ... | ... | ... | 1.37 | 0.859 | 1.07 | 1.68 | 2.15 | ||||||||
| Dividend Yield | % | ... | ... | ... | ... | ... | 4.70 | 6.76 | 3.57 | 3.74 | 3.40 | |||||||
| Free Cash Flow Yield | % | ... | ... | ... | ... | ... | 6.78 | -6.26 | 16.0 | 13.9 | ... | ... | ... | ... | ... | |||
| Earnings Per Share (EPS) | SEK | 5.01 | 7.45 | 7.48 | 8.64 | 11.5 | ||||||||||||
| Cash Earnings Per Share | SEK | 7.06 | 9.55 | 9.71 | 12.1 | 15.5 | ||||||||||||
| Free Cash Flow Per Share | SEK | 5.99 | -3.36 | 11.2 | 17.8 | ... | ... | ... | ... | ... | ||||||||
| Book Value Per Share | SEK | 54.5 | 60.3 | 65.1 | 71.7 | 78.7 | ||||||||||||
| Dividend Per Share | SEK | 3.50 | 3.50 | 2.50 | 4.50 | 5.75 | ||||||||||||
| EV/Sales | ... | ... | ... | ... | ... | 1.08 | 0.781 | 0.923 | 1.29 | 1.37 | ||||||||
| EV/EBIT | ... | ... | ... | ... | ... | 13.2 | 8.45 | 10.2 | 12.5 | 11.6 | ||||||||
| EV/Free Cash Flow | ... | ... | ... | ... | ... | 19.9 | -26.7 | 9.39 | 8.37 | ... | ... | ... | ... | ... | ||||
| EV/Capital Employed | ... | ... | ... | ... | ... | 1.30 | 0.921 | 1.04 | 1.49 | ... | ... | ... | ... | ... | ||||
| Earnings Per Share Growth | % | ... | -32.0 | 48.7 | 0.403 | 15.5 | 33.2 | |||||||||||
| Cash Earnings Per Share Growth | % | ... | -23.8 | 35.3 | 1.66 | 25.1 | 27.8 | |||||||||||
| Book Value Per Share Growth | % | ... | 5.02 | 10.5 | 8.03 | 10.1 | 9.77 |
Get all company financials in excel:


By Helgi Library - December 15, 2021
inwido stock traded at SEK 121 per share at the end 2020 implying a market capitalization of USD 849 mil. Since the end of 2015, stock has appreciated by 28.8% implying an annual average growth of 5.19% In absolute terms, the value of the company rose ...
By Helgi Library - December 15, 2021
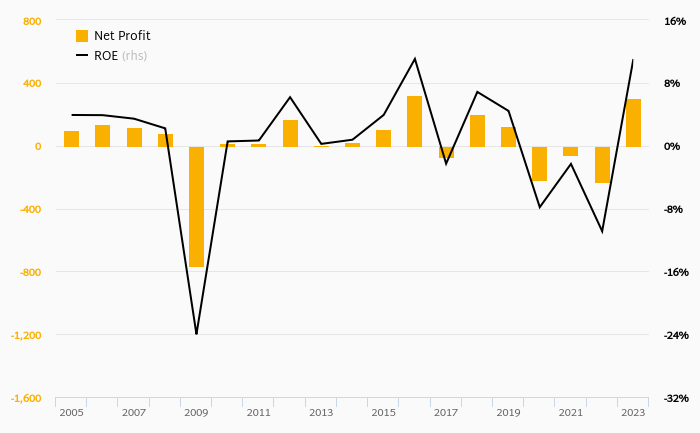
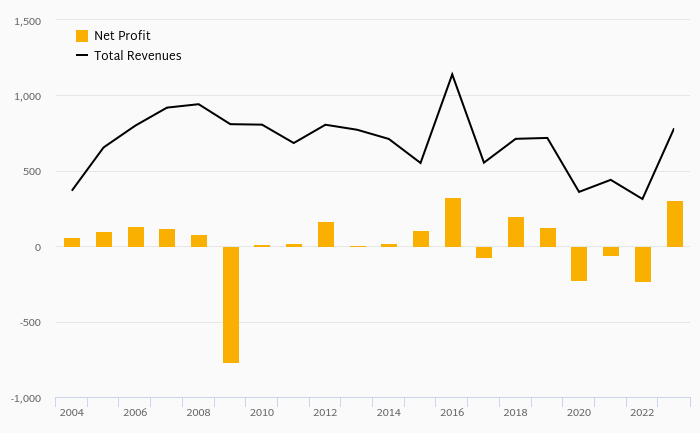
inwido made a net profit of SEK 501 mil with revenues of SEK 6,681 mil in 2020, up by 15.6% and up by 0.759%, respectively, compared to the previous year. This translates into a net margin of 7.49%. Historically, between 2009 and 2020, the firm’s ...
By Helgi Library - December 15, 2021
inwido's net debt stood at SEK 1,113 mil and accounted for 26.8% of equity at the end of 2020. The ratio is down 28.6 pp compared to the previous year. Historically, the firm’s net debt to equity reached a high of 83.6% in 2009 and a low of 2...
By Helgi Library - December 15, 2021
inwido made a net profit of SEK 501 mil in 2020, up 15.6% compared to the previous year. Historically, between 2009 and 2020, the company's net profit reached a high of SEK 501 mil in 2020 and a low of SEK 53.9 mil in 2009. The result implies a return on ...
By Helgi Library - December 15, 2021
inwido invested a total of SEK 177 mil in 2020, down 24.5% compared to the previous year. Historically, between 2009 - 2020, the company's investments stood at a high of SEK 235 mil in 2019 and a low of SEK 61.2 mil in 2010. As a perc...
By Helgi Library - December 15, 2021
inwido stock traded at SEK 121 per share at the end 2020 translating into a market capitalization of USD 849 mil. Since the end of 2015, the stock has appreciated by 28.8% representing an annual average growth of 5.19%. At the end of 2020, the firm trade...

inwido has been growing its sales by 4.56% a year on average in the last 5 years. EBITDA has grown on average by 5.63% a year during that time to total of SEK 1,221 mil in 2025, or 14.6% of sales. That’s compared to 14.8% average margin seen in last five years.
The company netted SEK 729 mil in 2025 implying ROE of 12.6% and ROCE of . Again, the average figures were 13.7% and %, respectively when looking at the previous 5 years.
inwido’s net debt amounted to SEK 250 mil at the end of 2025, or 4.17% of equity. When compared to EBITDA, net debt was 0.205x, down when compared to average of 0.418x seen in the last 5 years.
inwido stock traded at SEK 169 per share at the end of 2025 resulting in a market capitalization of USD 1,103 mil. Over the previous five years, stock price grew by 40.2% or 7.00% a year on average. The closing price put stock at a 12-month trailing EV/EBITDA of 8.23x and price to earnings (PE) of 13.4x as of 2025.
 Helgi Library