By Helgi Library - December 22, 2019
Lloyds Banking Group made a net profit of GBP 4,302 mil under revenues of GBP 20,003 mil in 2018, up 24.4% and -0.160% respectively c...
By Helgi Library - December 22, 2019
Lloyds Banking Group's capital adequacy ratio reached 22.9% at the end of 2018, up from 21.2% compared to the previous year. ...
By Helgi Library - December 22, 2019
Lloyds Banking Group's capital adequacy ratio reached 22.9% at the end of 2018, up from 21.2% compared to the previous year. ...
| Profit Statement | 2016 | 2017 | 2018 | |
| Net Interest Income | GBP mil | 9,274 | 10,912 | 13,396 |
| Net Fee Income | GBP mil | 1,689 | 1,583 | 1,462 |
| Other Income | GBP mil | 7,661 | 7,540 | 5,145 |
| Total Revenues | GBP mil | 18,624 | 20,035 | 20,003 |
| Operating Profit | GBP mil | 6,752 | 8,030 | 9,203 |
| Provisions | GBP mil | 752 | 688 | 937 |
| Net Profit | GBP mil | 2,413 | 3,457 | 4,302 |
| Balance Sheet | 2016 | 2017 | 2018 | |
| Interbank Loans | GBP mil | 35,202 | 23,443 | 46,766 |
| Customer Loans | GBP mil | 449,658 | 455,666 | 444,375 |
| Total Assets | GBP mil | 817,793 | 812,109 | 797,598 |
| Shareholders' Equity | GBP mil | 48,815 | 49,143 | 50,199 |
| Interbank Borrowing | GBP mil | 18,884 | 36,945 | 36,146 |
| Customer Deposits | GBP mil | 412,960 | 415,486 | 416,248 |
| Issued Debt Securities | GBP mil | 96,145 | 85,869 | 104,816 |
| Ratios | 2016 | 2017 | 2018 | |
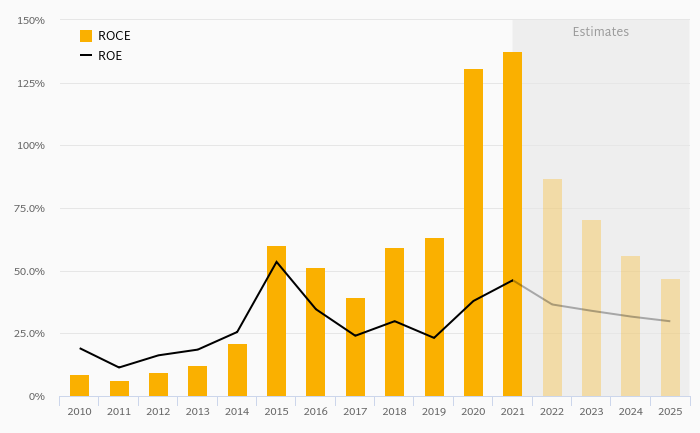
| ROE | % | 5.04 | 7.06 | 8.66 |
| ROA | % | 0.297 | 0.424 | 0.535 |
| Costs (As % Of Assets) | % | 1.46 | 1.47 | 1.34 |
| Costs (As % Of Income) | % | 63.7 | 59.9 | 54.0 |
| Capital Adequacy Ratio | % | 21.4 | 21.2 | 22.9 |
| Net Interest Margin | % | 1.14 | 1.34 | 1.66 |
| Loans (As % Of Deposits) | % | 109 | 110 | 107 |
| NPLs (As % Of Loans) | % | 1.88 | 1.71 | 1.28 |
| Provisions (As % Of NPLs) | % | 28.4 | 28.1 | 54.9 |
| Valuation | 2016 | 2017 | 2018 | |
| Price/Earnings (P/E) | 18.5 | 14.2 | 8.58 | |
| Price/Book Value (P/BV) | 0.915 | 0.997 | 0.735 | |
| Dividend Yield | % | 5.68 | 4.66 | 6.07 |
| Earnings Per Share (EPS) | 0.034 | 0.048 | 0.060 | |
| Book Value Per Share | 0.678 | 0.679 | 0.695 | |
| Dividend Per Share | 0.035 | 0.032 | 0.031 | |
Get all company financials in excel:
| summary | Unit | 1995 | 1996 | 1997 | 1998 | 1999 | 2000 | 2001 | 2002 | 2003 | 2004 | 2005 | 2006 | 2007 | 2008 | 2009 | 2010 | 2011 | 2012 | 2013 | 2014 | 2015 | 2016 | 2017 | 2018 |
| income statement | |||||||||||||||||||||||||
| Net Interest Income | GBP mil | 7,718 | 7,338 | 10,660 | 11,318 | 9,274 | |||||||||||||||||||
| Total Revenues | GBP mil | 21,933 | 19,820 | 17,769 | 18,866 | 18,624 | |||||||||||||||||||
| Operating Profit | GBP mil | 4,408 | 6,019 | 4,560 | 4,340 | 6,752 | |||||||||||||||||||
| Net Profit | GBP mil | -1,471 | -838 | 1,412 | 860 | 2,413 | |||||||||||||||||||
| balance sheet | |||||||||||||||||||||||||
| Interbank Loans | GBP mil | 32,757 | 25,365 | 26,155 | 25,117 | 35,202 | |||||||||||||||||||
| Customer Loans | GBP mil | 517,225 | 495,281 | 482,704 | 455,175 | 449,658 | |||||||||||||||||||
| Debt Securities | GBP mil | 209,472 | 198,213 | 218,993 | 202,163 | 216,137 | |||||||||||||||||||
| Total Assets | GBP mil | 934,221 | 847,030 | 854,896 | 806,688 | 817,793 | |||||||||||||||||||
| Shareholders' Equity | GBP mil | 42,581 | 39,336 | 49,903 | 46,980 | 48,815 | |||||||||||||||||||
| Interbank Borrowing | GBP mil | 38,405 | 13,982 | 10,887 | 16,925 | 18,884 | |||||||||||||||||||
| Customer Deposits | GBP mil | 426,912 | 441,311 | 447,067 | 418,326 | 412,960 | |||||||||||||||||||
| Issued Debt Securities | GBP mil | 151,345 | 119,414 | 102,275 | 105,368 | 96,145 | |||||||||||||||||||
| ratios | |||||||||||||||||||||||||
| ROE | % | -3.30 | -2.05 | 3.16 | 1.78 | 5.04 | |||||||||||||||||||
| ROA | % | -0.154 | -0.094 | 0.166 | 0.104 | 0.297 | |||||||||||||||||||
| Costs (As % Of Assets) | % | 1.84 | 1.55 | 1.55 | 1.75 | 1.46 | |||||||||||||||||||
| Costs (As % Of Income) | % | 79.9 | 69.6 | 74.3 | 77.0 | 63.7 | |||||||||||||||||||
| Capital Adequacy Ratio | % | 17.3 | 20.8 | 22.0 | 21.5 | 21.4 | |||||||||||||||||||
| Net Interest Margin | % | 0.810 | 0.824 | 1.25 | 1.36 | 1.14 | |||||||||||||||||||
| Interest Income (As % Of Revenues) | % | 35.2 | 37.0 | 60.0 | 60.0 | 49.8 | |||||||||||||||||||
| Fee Income (As % Of Revenues) | % | 14.6 | 13.8 | 12.7 | 9.59 | 9.07 | |||||||||||||||||||
| Equity (As % Of Assets) | % | 4.56 | 4.64 | 5.84 | 5.82 | 5.97 | |||||||||||||||||||
| Loans (As % Of Deposits) | % | 121 | 112 | 108 | 109 | 109 | |||||||||||||||||||
| Loans (As % Assets) | % | 55.4 | 58.5 | 56.5 | 56.4 | 55.0 | |||||||||||||||||||
| NPLs (As % Of Loans) | % | 8.69 | 6.36 | 2.93 | 2.09 | 1.88 | |||||||||||||||||||
| Provisions (As % Of NPLs) | % | 32.9 | 37.1 | 44.8 | 31.6 | 28.4 | |||||||||||||||||||
| valuation | |||||||||||||||||||||||||
| Market Capitalisation (End Of Period) | USD mil | 54,814 | 93,372 | 84,427 | 77,373 | 54,949 | |||||||||||||||||||
| Number Of Shares (Average) | mil | 69,841 | 71,009 | 72,447 | 72,340 | 72,024 | |||||||||||||||||||
| Share Price (End Of Period) | GBP | 0.483 | 0.794 | 0.748 | 0.722 | 0.620 | |||||||||||||||||||
| Earnings Per Share (EPS) | -0.021 | -0.012 | 0.019 | 0.012 | 0.034 | ||||||||||||||||||||
| Book Value Per Share | 0.610 | 0.554 | 0.689 | 0.649 | 0.678 | ||||||||||||||||||||
| Dividend Per Share | 0 | 0 | 0.007 | 0.032 | 0.035 | ||||||||||||||||||||
| Price/Earnings (P/E) | ... | ... | ... | ... | 38.4 | 60.7 | 18.5 | ||||||||||||||||||
| Price/Book Value (P/BV) | 0.792 | 1.43 | 1.09 | 1.11 | 0.915 | ||||||||||||||||||||
| Dividend Yield | % | 0 | 0 | 0.988 | 4.45 | 5.68 | |||||||||||||||||||
| Earnings Per Share Growth | % | ... | -48.3 | -44.0 | -265 | -39.0 | 182 | ||||||||||||||||||
| Book Value Per Share Growth | % | ... | -10.4 | -9.14 | 24.3 | -5.72 | 4.36 |
| income statement | Unit | 1995 | 1996 | 1997 | 1998 | 1999 | 2000 | 2001 | 2002 | 2003 | 2004 | 2005 | 2006 | 2007 | 2008 | 2009 | 2010 | 2011 | 2012 | 2013 | 2014 | 2015 | 2016 | 2017 | 2018 |
| income statement | |||||||||||||||||||||||||
| Interest Income | GBP mil | 23,548 | 21,163 | 19,211 | 17,615 | 16,620 | |||||||||||||||||||
| Interest Cost | GBP mil | 15,830 | 13,825 | 8,551 | 6,297 | 7,346 | |||||||||||||||||||
| Net Interest Income | GBP mil | 7,718 | 7,338 | 10,660 | 11,318 | 9,274 | |||||||||||||||||||
| Net Fee Income | GBP mil | 3,206 | 2,734 | 2,257 | 1,810 | 1,689 | |||||||||||||||||||
| Other Income | GBP mil | 11,009 | 9,748 | 4,852 | 5,738 | 7,661 | |||||||||||||||||||
| Total Revenues | GBP mil | 21,933 | 19,820 | 17,769 | 18,866 | 18,624 | |||||||||||||||||||
| Operating Cost | GBP mil | 17,525 | 13,801 | 13,209 | 14,526 | 11,872 | |||||||||||||||||||
| Operating Profit | GBP mil | 4,408 | 6,019 | 4,560 | 4,340 | 6,752 | |||||||||||||||||||
| Provisions | GBP mil | 5,149 | 2,741 | 752 | 390 | 752 | |||||||||||||||||||
| Extra and Other Cost | GBP mil | -135 | 2,863 | 2,046 | 2,306 | 1,762 | |||||||||||||||||||
| Pre-Tax Profit | GBP mil | -606 | 415 | 1,762 | 1,644 | 4,238 | |||||||||||||||||||
| Tax | GBP mil | 781 | 1,217 | 263 | 688 | 1,724 | |||||||||||||||||||
| Minorities | GBP mil | 84.0 | 36.0 | 87.0 | 96.0 | 101 | |||||||||||||||||||
| Net Profit | GBP mil | -1,471 | -838 | 1,412 | 860 | 2,413 | |||||||||||||||||||
| Dividends | GBP mil | 0 | 0 | 535 | 2,322 | 2,537 | |||||||||||||||||||
| growth rates | |||||||||||||||||||||||||
| Net Interest Income Growth | % | ... | -39.2 | -4.92 | 45.3 | 6.17 | -18.1 | ||||||||||||||||||
| Net Fee Income Growth | % | ... | -9.54 | -14.7 | -17.4 | -19.8 | -6.69 | ||||||||||||||||||
| Total Revenue Growth | % | ... | -1.03 | -9.63 | -10.3 | 6.17 | -1.28 | ||||||||||||||||||
| Operating Cost Growth | % | ... | 103 | -21.2 | -4.29 | 9.97 | -18.3 | ||||||||||||||||||
| Operating Profit Growth | % | ... | -67.4 | 36.5 | -24.2 | -4.82 | 55.6 | ||||||||||||||||||
| Pre-Tax Profit Growth | % | ... | -82.9 | -168 | 325 | -6.70 | 158 | ||||||||||||||||||
| Net Profit Growth | % | ... | -47.2 | -43.0 | -268 | -39.1 | 181 |
| balance sheet | Unit | 1995 | 1996 | 1997 | 1998 | 1999 | 2000 | 2001 | 2002 | 2003 | 2004 | 2005 | 2006 | 2007 | 2008 | 2009 | 2010 | 2011 | 2012 | 2013 | 2014 | 2015 | 2016 | 2017 | 2018 |
| balance sheet | |||||||||||||||||||||||||
| Cash | GBP mil | 81,554 | 50,922 | 51,665 | 59,114 | 48,158 | |||||||||||||||||||
| Interbank Loans | GBP mil | 32,757 | 25,365 | 26,155 | 25,117 | 35,202 | |||||||||||||||||||
| Customer Loans | GBP mil | 517,225 | 495,281 | 482,704 | 455,175 | 449,658 | |||||||||||||||||||
| Mortgage Loans | GBP mil | ... | ... | ... | ... | ... | ... | ... | ... | ... | ... | ... | ... | ... | ... | 337,879 | 335,611 | 333,318 | 312,877 | 306,682 | |||||
| Consumer Loans | GBP mil | ... | ... | ... | ... | ... | ... | ... | ... | ... | ... | ... | ... | ... | ... | 78,921 | 70,401 | 70,726 | 66,214 | 72,522 | |||||
| Corporate Loans | GBP mil | ... | 103,864 | 91,710 | 74,658 | 66,830 | 66,921 | ||||||||||||||||||
| Debt Securities | GBP mil | 209,472 | 198,213 | 218,993 | 202,163 | 216,137 | |||||||||||||||||||
| Fixed Assets | GBP mil | 12,150 | 11,865 | 12,138 | 16,833 | 16,669 | |||||||||||||||||||
| Total Assets | GBP mil | 934,221 | 847,030 | 854,896 | 806,688 | 817,793 | |||||||||||||||||||
| Shareholders' Equity | GBP mil | 42,581 | 39,336 | 49,903 | 46,980 | 48,815 | |||||||||||||||||||
| Of Which Minority Interest | GBP mil | 685 | 347 | 1,213 | 391 | 440 | |||||||||||||||||||
| Liabilities | GBP mil | 891,640 | 807,694 | 804,993 | 759,708 | 768,978 | |||||||||||||||||||
| Interbank Borrowing | GBP mil | 38,405 | 13,982 | 10,887 | 16,925 | 18,884 | |||||||||||||||||||
| Customer Deposits | GBP mil | 426,912 | 441,311 | 447,067 | 418,326 | 412,960 | |||||||||||||||||||
| Sight Deposits | GBP mil | 36,909 | 40,802 | 46,487 | 48,518 | 61,804 | |||||||||||||||||||
| Term Deposits | GBP mil | 390,003 | 400,509 | 400,580 | 369,808 | 351,156 | |||||||||||||||||||
| Issued Debt Securities | GBP mil | 151,345 | 119,414 | 102,275 | 105,368 | 96,145 | |||||||||||||||||||
| Other Liabilities | GBP mil | 274,978 | 232,987 | 244,764 | 219,089 | 240,989 | |||||||||||||||||||
| asset quality | |||||||||||||||||||||||||
| Non-Performing Loans | GBP mil | 46,293 | 32,259 | 14,308 | 9,590 | 8,495 | |||||||||||||||||||
| Gross Loans | GBP mil | 532,475 | 507,247 | 489,118 | 458,208 | 452,070 | |||||||||||||||||||
| Provisions | GBP mil | 5,149 | 2,741 | 752 | 390 | 752 | |||||||||||||||||||
| growth rates | |||||||||||||||||||||||||
| Customer Loan Growth | % | ... | -8.56 | -4.24 | -2.54 | -5.70 | -1.21 | ||||||||||||||||||
| Retail Loan Growth | % | ... | -6.16 | -2.59 | -0.485 | -6.18 | 0.030 | ||||||||||||||||||
| Mortgage Loan Growth | % | ... | ... | ... | ... | ... | ... | ... | ... | ... | ... | ... | ... | ... | ... | ... | -2.97 | -0.671 | -0.683 | -6.13 | -1.98 | ||||
| Consumer Loan Growth | % | ... | ... | ... | ... | ... | ... | ... | ... | ... | ... | ... | ... | ... | ... | ... | -17.8 | -10.8 | 0.462 | -6.38 | 9.53 | ||||
| Corporate Loan Growth | % | ... | ... | -18.0 | -11.7 | -18.6 | -10.5 | 0.136 | |||||||||||||||||
| Total Asset Growth | % | ... | -3.74 | -9.33 | 0.929 | -5.64 | 1.38 | ||||||||||||||||||
| Shareholders' Equity Growth | % | ... | -8.61 | -7.62 | 26.9 | -5.86 | 3.91 | ||||||||||||||||||
| Customer Deposit Growth | % | ... | 3.14 | 3.37 | 1.30 | -6.43 | -1.28 |
| ratios | Unit | 1995 | 1996 | 1997 | 1998 | 1999 | 2000 | 2001 | 2002 | 2003 | 2004 | 2005 | 2006 | 2007 | 2008 | 2009 | 2010 | 2011 | 2012 | 2013 | 2014 | 2015 | 2016 | 2017 | 2018 |
| ratios | |||||||||||||||||||||||||
| ROE | % | -3.30 | -2.05 | 3.16 | 1.78 | 5.04 | |||||||||||||||||||
| ROA | % | -0.154 | -0.094 | 0.166 | 0.104 | 0.297 | |||||||||||||||||||
| Costs (As % Of Assets) | % | 1.84 | 1.55 | 1.55 | 1.75 | 1.46 | |||||||||||||||||||
| Costs (As % Of Income) | % | 79.9 | 69.6 | 74.3 | 77.0 | 63.7 | |||||||||||||||||||
| Capital Adequacy Ratio | % | 17.3 | 20.8 | 22.0 | 21.5 | 21.4 | |||||||||||||||||||
| Tier 1 Ratio | % | 13.8 | 14.5 | 16.5 | 16.4 | 17.0 | |||||||||||||||||||
| Net Interest Margin | % | 0.810 | 0.824 | 1.25 | 1.36 | 1.14 | |||||||||||||||||||
| Interest Spread | % | ... | 0.729 | 0.749 | 1.20 | 1.32 | 1.09 | ||||||||||||||||||
| Asset Yield | % | 2.47 | 2.38 | 2.26 | 2.12 | 2.05 | |||||||||||||||||||
| Cost Of Liabilities | % | ... | 1.74 | 1.63 | 1.06 | 0.805 | 0.961 | ||||||||||||||||||
| Payout Ratio | % | 76.3 | 86.6 | 76.6 | 75.7 | 75.4 | |||||||||||||||||||
| Interest Income (As % Of Revenues) | % | 35.2 | 37.0 | 60.0 | 60.0 | 49.8 | |||||||||||||||||||
| Fee Income (As % Of Revenues) | % | 14.6 | 13.8 | 12.7 | 9.59 | 9.07 | |||||||||||||||||||
| Other Income (As % Of Revenues) | % | 50.2 | 49.2 | 27.3 | 30.4 | 41.1 | |||||||||||||||||||
| Equity (As % Of Assets) | % | 4.56 | 4.64 | 5.84 | 5.82 | 5.97 | |||||||||||||||||||
| Loans (As % Of Deposits) | % | 121 | 112 | 108 | 109 | 109 | |||||||||||||||||||
| Loans (As % Assets) | % | 55.4 | 58.5 | 56.5 | 56.4 | 55.0 | |||||||||||||||||||
| NPLs (As % Of Loans) | % | 8.69 | 6.36 | 2.93 | 2.09 | 1.88 | |||||||||||||||||||
| Provisions (As % Of NPLs) | % | 32.9 | 37.1 | 44.8 | 31.6 | 28.4 | |||||||||||||||||||
| Provisions (As % Of Loans) | % | 2.95 | 2.42 | 1.33 | 0.666 | 0.536 | |||||||||||||||||||
| Cost of Provisions (As % Of Loans) | % | 0.951 | 0.541 | 0.154 | 0.083 | 0.166 |
| other data | Unit | 1995 | 1996 | 1997 | 1998 | 1999 | 2000 | 2001 | 2002 | 2003 | 2004 | 2005 | 2006 | 2007 | 2008 | 2009 | 2010 | 2011 | 2012 | 2013 | 2014 | 2015 | 2016 | 2017 | 2018 |
| other data | |||||||||||||||||||||||||
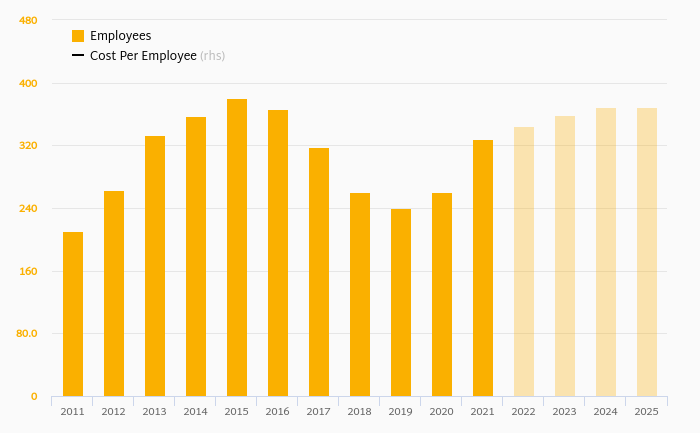
| Employees | 92,788 | 88,977 | 84,490 | 75,306 | 80,418 | ||||||||||||||||||||
| Sight (As % Of Customer Deposits) | % | 8.65 | 9.25 | 10.4 | 11.6 | 15.0 |
Get all company financials in excel:


By Helgi Library - December 22, 2019
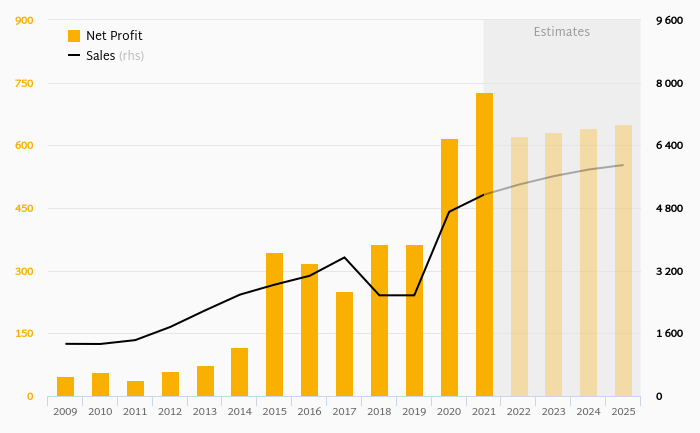
Lloyds Banking Group made a net profit of GBP 4,302 mil under revenues of GBP 20,003 mil in 2018, up 24.4% and -0.160% respectively compared to the previous year. Historically, the bank’s net profit reached an all time high of GBP 4,302 mil in 2018 and an all time low of...
By Helgi Library - December 22, 2019
Lloyds Banking Group's non-performing loans reached 1.28% of total loans at the end of 2018, down from 1.71% compared to the previous year. Historically, the NPL ratio hit an all time high of 10.6% in 2010 and an all time low of 0.889% in 2003. Provision co...
By Helgi Library - December 22, 2019
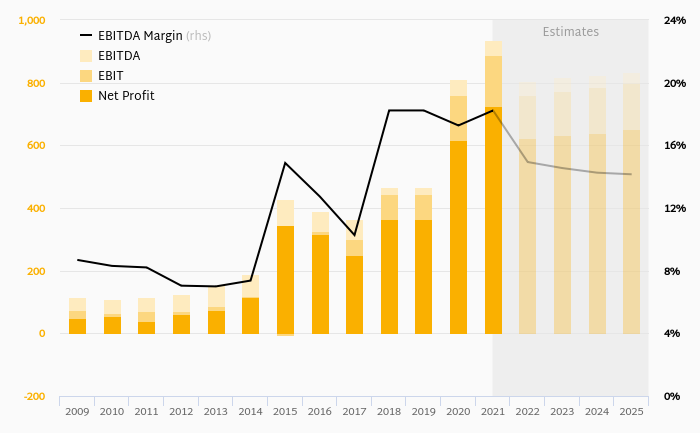
Lloyds Banking Group generated total banking revenues of GBP 20,003 mil in 2018, down 0.16% compared to the previous year. Historically, the bank’s revenues containing of interest, fee and other non-interest income reached an all time high of GBP 26,638 mil in ...
By Helgi Library - December 22, 2019
Lloyds Banking Group stock traded at GBP 0.510 per share at the end of 2018 implying a market capitalization of USD 46,835 mil. Since the end of 2013, the stock has appreciated by % implying an annual average growth of 0 %. In absolute terms, the value of the company...
By Helgi Library - December 22, 2019
Lloyds Banking Group's non-performing loans reached 1.28% of total loans at the end of 2018, down from 1.71% compared to the previous year. Historically, the NPL ratio hit an all time high of 10.6% in 2010 and an all time low of 0.889% in 2003. Provision co...
By Helgi Library - December 22, 2019
Lloyds Banking Group stock traded at GBP 0.510 per share at the end of 2018 implying a market capitalization of USD 46,835 mil. Since the end of 2013, the stock has appreciated by % implying an annual average growth of 0 %. In absolute terms, the value of the company...
By Helgi Library - December 22, 2019
Lloyds Banking Group generated total banking revenues of GBP 20,003 mil in 2018, down 0.16% compared to the previous year. Historically, the bank’s revenues containing of interest, fee and other non-interest income reached an all time high of GBP 26,638 mil in ...
By Helgi Library - December 22, 2019
Lloyds Banking Group stock traded at GBP 0.510 per share at the end 2018 implying a market capitalization of USD 46,835 mil. Since the end of 2013, the stock has appreciated by % implying an annual average growth of 0 %. In absolute terms, the value of the company ...
By Helgi Library - December 22, 2019
Lloyds Banking Group's net interest margin amounted to 1.66% in 2018, up from 1.34% compared to the previous year. Historically, the bank’s net interest margin reached an all time high of 2.78% in 1999 and an all time low of 0.810% in 2012. The average ...
By Helgi Library - December 22, 2019
Lloyds Banking Group's net interest margin amounted to 1.66% in 2018, up from 1.34% compared to the previous year. Historically, the bank’s net interest margin reached an all time high of 2.78% in 1999 and an all time low of 0.810% in 2012. The average ...
 Helgi Library