By Helgi Library - December 7, 2020
Metsa Tissue made a net profit of EUR 7.67 mil in 2019, down 74.6% compared to the previous year. Total sales reached EUR 212 mil, ...
By Helgi Library - December 7, 2020
Metsa Tissue made a net profit of EUR 7.67 mil in 2019, down 74.6% compared to the previous year. Historically, between 2013...
| Profit Statement | 2017 | 2018 | 2019 | |
| Sales | EUR mil | 207 | 214 | 212 |
| Gross Profit | EUR mil | 82.8 | 76.2 | 84.3 |
| Pre-Tax Profit | EUR mil | 28.7 | 26.7 | 2.98 |
| Net Profit | EUR mil | 30.0 | 30.3 | 7.67 |
| Balance Sheet | 2017 | 2018 | 2019 | |
| Total Assets | EUR mil | 678 | 700 | 670 |
| Non-Current Assets | EUR mil | 303 | 300 | 336 |
| Current Assets | EUR mil | 180 | 44.6 | 42.7 |
| Working Capital | EUR mil | 8.90 | 7.61 | 9.12 |
| Shareholders' Equity | EUR mil | 248 | 269 | 277 |
| Liabilities | EUR mil | 430 | 430 | 393 |
| Total Debt | EUR mil | 279 | 277 | 264 |
| Net Debt | EUR mil | -132 | 1.88 | -37.9 |
| Ratios | 2017 | 2018 | 2019 | |
| ROE | % | 12.6 | 11.7 | 2.81 |
| ROCE | % | 7.63 | 9.76 | 2.35 |
| Gross Margin | % | 40.0 | 35.6 | 39.8 |
| Net Margin | % | 14.5 | 14.1 | 3.62 |
| Net Debt/Equity | % | -53.0 | 0.699 | -13.7 |
| Cash Flow | 2017 | 2018 | 2019 | |
| Cash Conversion Cycle | days | 1.83 | 3.54 | 6.02 |
Get all company financials in excel:
| overview | Unit | 2013 | 2014 | 2015 | 2016 | 2017 | 2018 | 2019 |
| income statement | ||||||||
| Sales | EUR mil | 181 | 193 | 199 | 194 | 207 | ||
| Gross Profit | EUR mil | 58.9 | 65.4 | 78.5 | 66.1 | 82.8 | ||
| Net Profit | EUR mil | -2.06 | 16.1 | 13.9 | 12.9 | 30.0 | ||
| ROE | % | -0.990 | 7.57 | 6.29 | 5.71 | 12.6 | ||
| Net Margin | % | -1.14 | 8.33 | 6.98 | 6.66 | 14.5 | ||
| balance sheet | ||||||||
| Total Assets | EUR mil | 768 | 756 | 749 | 732 | 678 | ||
| Non-Current Assets | EUR mil | 321 | 504 | 468 | 464 | 303 | ||
| Current Assets | EUR mil | 39.7 | 38.8 | 37.3 | 35.5 | 180 | ||
| Shareholders' Equity | EUR mil | 208 | 218 | 224 | 228 | 248 | ||
| Liabilities | EUR mil | 561 | 538 | 525 | 504 | 430 | ||
| Non-Current Liabilities | EUR mil | 136 | 132 | 127 | 123 | 120 | ||
| Current Liabilities | EUR mil | 425 | 407 | 398 | 381 | 310 | ||
| Net Debt/Equity | % | 55.3 | -37.8 | -29.6 | -33.1 | -53.0 |
| income statement | Unit | 2013 | 2014 | 2015 | 2016 | 2017 | 2018 | 2019 |
| income statement | ||||||||
| Sales | EUR mil | 181 | 193 | 199 | 194 | 207 | ||
| Cost of Goods & Services | EUR mil | 122 | 128 | 120 | 127 | 124 | ||
| Gross Profit | EUR mil | 58.9 | 65.4 | 78.5 | 66.1 | 82.8 | ||
| Pre-Tax Profit | EUR mil | -2.09 | 16.3 | 13.9 | 12.9 | 28.7 | ||
| Tax | EUR mil | -0.031 | 0.156 | 0 | 0 | -1.28 | ||
| Net Profit | EUR mil | -2.06 | 16.1 | 13.9 | 12.9 | 30.0 | ||
| Net Profit Avail. to Common | EUR mil | -2.06 | 16.1 | 13.9 | 12.9 | 30.0 | ||
| growth rates | ||||||||
| Total Revenue Growth | % | ... | 6.75 | 2.96 | -2.72 | 6.94 | ||
| Pre-Tax Profit Growth | % | ... | -878 | -14.6 | -7.08 | 123 | ||
| Net Profit Growth | % | ... | -882 | -13.8 | -7.08 | 133 | ||
| ratios | ||||||||
| ROE | % | -0.990 | 7.57 | 6.29 | 5.71 | 12.6 | ||
| ROA | % | -0.268 | 2.11 | 1.84 | 1.74 | 4.26 | ||
| ROCE | % | ... | 3.72 | 2.76 | 2.70 | 7.63 | ||
| Gross Margin | % | 32.5 | 33.9 | 39.5 | 34.2 | 40.0 | ||
| Net Margin | % | -1.14 | 8.33 | 6.98 | 6.66 | 14.5 |
| balance sheet | Unit | 2013 | 2014 | 2015 | 2016 | 2017 | 2018 | 2019 |
| balance sheet | ||||||||
| Cash & Cash Equivalents | EUR mil | 6.22 | 4.43 | 2.85 | 2.87 | 140 | ||
| Receivables | EUR mil | 14.6 | 15.7 | 16.9 | 15.1 | 20.7 | ||
| Inventories | EUR mil | 18.9 | 18.6 | 17.6 | 17.5 | 19.3 | ||
| Other ST Assets | EUR mil | 0 | 0 | 0 | 0 | 0 | ||
| Current Assets | EUR mil | 39.7 | 38.8 | 37.3 | 35.5 | 180 | ||
| Property, Plant & Equipment | EUR mil | 33.8 | 31.9 | 29.2 | 31.4 | 32.1 | ||
| LT Investments & Receivables | EUR mil | 288 | 472 | 438 | 432 | 271 | ||
| Intangible Assets | EUR mil | 0 | 0 | 0 | 0 | 0 | ||
| Goodwill | EUR mil | 0 | 0 | 0 | 0 | 0 | ||
| Non-Current Assets | EUR mil | 321 | 504 | 468 | 464 | 303 | ||
| Total Assets | EUR mil | 768 | 756 | 749 | 732 | 678 | ||
| Trade Payables | EUR mil | 15.8 | 12.2 | 23.2 | 21.4 | 31.1 | ||
| Short-Term Debt | EUR mil | 409 | 394 | 375 | 360 | 279 | ||
| Other ST Liabilities | EUR mil | 0 | 0 | 0 | 0 | 0 | ||
| Current Liabilities | EUR mil | 425 | 407 | 398 | 381 | 310 | ||
| Long-Term Debt | EUR mil | 0 | 0 | 0 | 0 | 0 | ||
| Other LT Liabilities | EUR mil | 136 | 132 | 127 | 123 | 120 | ||
| Non-Current Liabilities | EUR mil | 136 | 132 | 127 | 123 | 120 | ||
| Liabilities | EUR mil | 561 | 538 | 525 | 504 | 430 | ||
| Equity Before Minority Interest | EUR mil | 208 | 218 | 224 | 228 | 248 | ||
| Minority Interest | EUR mil | 0 | 0 | 0 | 0 | 0 | ||
| Equity | EUR mil | 208 | 218 | 224 | 228 | 248 | ||
| growth rates | ||||||||
| Total Asset Growth | % | ... | -1.62 | -0.873 | -2.35 | -7.31 | ||
| Shareholders' Equity Growth | % | ... | 4.67 | 2.96 | 1.58 | 9.08 | ||
| Net Debt Growth | % | ... | -172 | -19.4 | 13.6 | 74.7 | ||
| Total Debt Growth | % | ... | -3.54 | -4.96 | -4.03 | -22.3 | ||
| ratios | ||||||||
| Total Debt | EUR mil | 409 | 394 | 375 | 360 | 279 | ||
| Net Debt | EUR mil | 115 | -82.3 | -66.3 | -75.3 | -132 | ||
| Working Capital | EUR mil | 17.7 | 22.2 | 11.2 | 11.3 | 8.90 | ||
| Capital Employed | EUR mil | 339 | 526 | 479 | 475 | 312 | ||
| Net Debt/Equity | % | 55.3 | -37.8 | -29.6 | -33.1 | -53.0 | ||
| Current Ratio | 0.093 | 0.095 | 0.094 | 0.093 | 0.581 | |||
| Quick Ratio | 0.049 | 0.049 | 0.050 | 0.047 | 0.518 |
| cash flow | Unit | 2013 | 2014 | 2015 | 2016 | 2017 | 2018 | 2019 |
| cash flow | ||||||||
| Net Profit | EUR mil | -2.06 | 16.1 | 13.9 | 12.9 | 30.0 | ||
| ratios | ||||||||
| Days Sales Outstanding | days | 29.4 | 29.6 | 30.9 | 28.6 | 36.5 | ||
| Days Sales Of Inventory | days | 56.4 | 53.2 | 53.3 | 50.1 | 56.6 | ||
| Days Payable Outstanding | days | 47.1 | 34.7 | 70.3 | 61.2 | 91.2 | ||
| Cash Conversion Cycle | days | 38.7 | 48.2 | 13.9 | 17.5 | 1.83 |
| other ratios | Unit | 2013 | 2014 | 2015 | 2016 | 2017 | 2018 | 2019 |
| Effective Tax Rate | % | 1.48 | 0.960 | 0 | 0 | -4.46 | ||
| Total Revenue Growth (5-year average) | % | ... | ... | ... | ... | ... |
Get all company financials in excel:
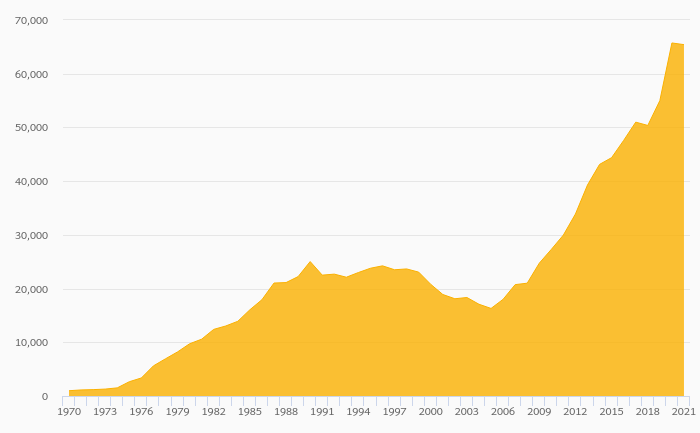


Metsa Tissue has been growing its sales by 1.88% a year on average in the last 5 years. EBITDA has grown by 0% during that time to total of in 2019, or of sales. That’s compared to % average margin seen in last five years.
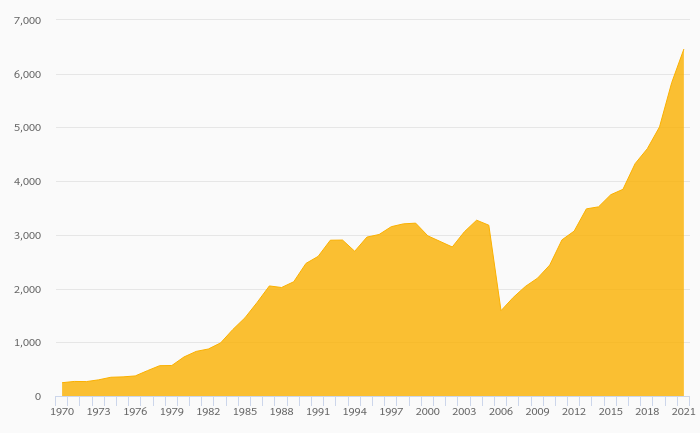
The company netted EUR 7.67 mil in 2019 implying ROE of 2.81% and ROCE of 2.35%. Again, the average figures were 7.82% and 5.04%, respectively when looking at the previous 5 years.
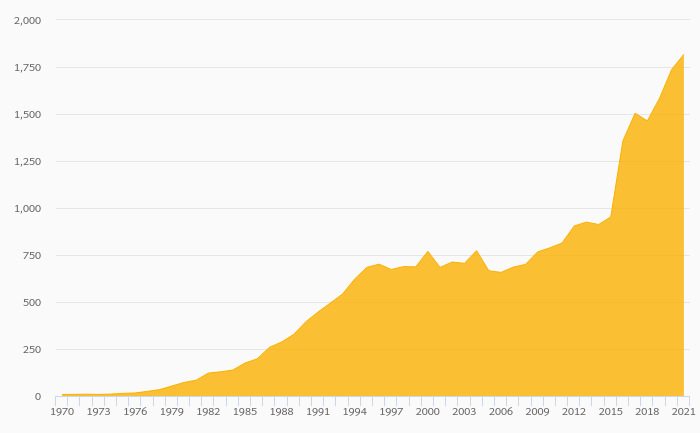
Metsa Tissue’s net debt amounted to EUR -37.9 mil at the end of 2019, or -13.7% of equity. When compared to EBITDA, net debt was x, up when compared to average of x seen in the last 5 years.
 Helgi Library