By Helgi Library - December 4, 2020
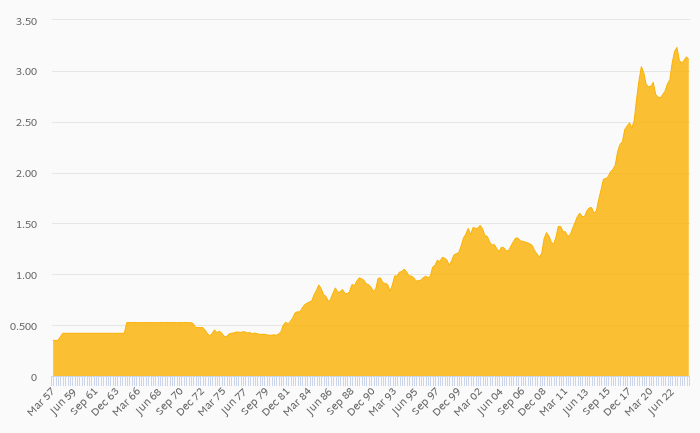
Mondi Steti made a net profit of CZK 1,644 mil with revenues of CZK 11,511 mil in 2019, up by 480% and up by 10.2%, r...
By Helgi Library - December 4, 2020
Mondi Steti employed 730 employees in 2019, down 6.65% compared to the previous year. Historically, between 2005 and 20...
By Helgi Library - December 4, 2020
Mondi Steti's operating cash flow stood at CZK 2,819 mil in 2019, up 25.5% when compared to the previous year. Historica...
| Profit Statement | 2017 | 2018 | 2019 | |
| Sales | CZK mil | 9,790 | 10,446 | 11,511 |
| Gross Profit | CZK mil | 2,664 | 3,390 | 4,074 |
| EBITDA | CZK mil | 2,116 | 2,316 | 3,035 |
| EBIT | CZK mil | 1,309 | 232 | 2,314 |
| Financing Cost | CZK mil | 149 | 334 | 490 |
| Pre-Tax Profit | CZK mil | 1,330 | 282 | 1,994 |
| Net Profit | CZK mil | 1,102 | 283 | 1,644 |
| Dividends | CZK mil | 0 | 0 | ... |
| Balance Sheet | 2017 | 2018 | 2019 | |
| Total Assets | CZK mil | 15,338 | 19,469 | 19,652 |
| Non-Current Assets | CZK mil | 12,431 | 15,043 | 16,788 |
| Current Assets | CZK mil | 2,848 | 4,378 | 2,808 |
| Working Capital | CZK mil | 811 | 2,519 | 712 |
| Shareholders' Equity | CZK mil | 5,442 | 5,726 | 7,368 |
| Liabilities | CZK mil | 9,895 | 13,743 | 12,284 |
| Total Debt | CZK mil | 6,359 | 10,537 | 8,914 |
| Net Debt | CZK mil | 4,572 | 8,635 | 6,681 |
| Ratios | 2017 | 2018 | 2019 | |
| ROE | % | 22.5 | 5.08 | 25.1 |
| ROCE | % | 9.46 | 1.84 | 9.38 |
| Gross Margin | % | 27.2 | 32.5 | 35.4 |
| EBITDA Margin | % | 21.6 | 22.2 | 26.4 |
| EBIT Margin | % | 13.4 | 2.22 | 20.1 |
| Net Margin | % | 11.3 | 2.71 | 14.3 |
| Net Debt/EBITDA | 2.16 | 3.73 | 2.20 | |
| Net Debt/Equity | % | 84.0 | 151 | 90.7 |
| Cost of Financing | % | 2.70 | 3.96 | 5.03 |
| Cash Flow | 2017 | 2018 | 2019 | |
| Total Cash From Operations | CZK mil | 1,942 | 2,247 | 2,819 |
| Total Cash From Investing | CZK mil | -3,609 | -6,381 | -1,176 |
| Total Cash From Financing | CZK mil | 1,669 | 4,133 | -1,642 |
| Net Change In Cash | CZK mil | 1.62 | -0.049 | 0.902 |
| Cash Conversion Cycle | days | 21.2 | 79.4 | 8.75 |
| Cash Earnings | CZK mil | 1,909 | 2,367 | 2,366 |
| Free Cash Flow | CZK mil | -1,668 | -4,134 | 1,643 |
Get all company financials in excel:
| overview | Unit | 2003 | 2004 | 2005 | 2006 | 2007 | 2008 | 2009 | 2010 | 2011 | 2012 | 2013 | 2014 | 2015 | 2016 | 2017 | 2018 | 2019 |
| income statement | ||||||||||||||||||
| Sales | CZK mil | ... | ... | 9,068 | 9,458 | 9,443 | 9,283 | 9,790 | ||||||||||
| Gross Profit | CZK mil | ... | ... | 1,927 | 2,158 | 2,047 | 2,113 | 2,664 | ||||||||||
| EBIT | CZK mil | ... | ... | 980 | 1,232 | 1,037 | 912 | 1,309 | ||||||||||
| Net Profit | CZK mil | ... | ... | 698 | 876 | 712 | 613 | 1,102 | ||||||||||
| ROE | % | ... | ... | 21.3 | 28.0 | 21.1 | 15.2 | 22.5 | ||||||||||
| EBIT Margin | % | ... | ... | 10.8 | 13.0 | 11.0 | 9.83 | 13.4 | ||||||||||
| Net Margin | % | ... | ... | 7.70 | 9.27 | 7.54 | 6.60 | 11.3 | ||||||||||
| Employees | ... | ... | 567 | 562 | 589 | 628 | 731 | |||||||||||
| balance sheet | ||||||||||||||||||
| Total Assets | CZK mil | 8,426 | 10,090 | 11,305 | 11,613 | 15,338 | ||||||||||||
| Non-Current Assets | CZK mil | 5,991 | 7,735 | 8,686 | 8,871 | 12,431 | ||||||||||||
| Current Assets | CZK mil | 2,433 | 2,353 | 2,518 | 2,668 | 2,848 | ||||||||||||
| Shareholders' Equity | CZK mil | 3,218 | 3,033 | 3,727 | 4,340 | 5,442 | ||||||||||||
| Liabilities | CZK mil | 5,208 | 7,057 | 7,578 | 7,273 | 9,895 | ||||||||||||
| Non-Current Liabilities | CZK mil | 3,042 | 3,160 | 3,354 | 563 | 591 | ||||||||||||
| Current Liabilities | CZK mil | 2,087 | 3,809 | 4,128 | 6,580 | 9,111 | ||||||||||||
| Net Debt/EBITDA | ... | ... | 1.23 | 1.53 | 1.92 | 1.79 | 2.16 | |||||||||||
| Net Debt/Equity | % | 55.1 | 83.8 | 78.1 | 66.4 | 84.0 | ||||||||||||
| Cost of Financing | % | ... | ... | ... | ... | ... | ... | ... | ... | ... | ... | ... | ... | ... | 3.47 | 2.70 | ||
| cash flow | ||||||||||||||||||
| Total Cash From Operations | CZK mil | ... | ... | 1,345 | 1,477 | 1,022 | 1,200 | 1,942 | ||||||||||
| Total Cash From Investing | CZK mil | ... | ... | -1,166 | -2,134 | -1,316 | -873 | -3,609 | ||||||||||
| Total Cash From Financing | CZK mil | ... | ... | -178 | 658 | 295 | -325 | 1,669 | ||||||||||
| Net Change In Cash | CZK mil | ... | ... | 0.713 | 1.19 | 0.815 | 1.13 | 1.62 |
| income statement | Unit | 2003 | 2004 | 2005 | 2006 | 2007 | 2008 | 2009 | 2010 | 2011 | 2012 | 2013 | 2014 | 2015 | 2016 | 2017 | 2018 | 2019 |
| income statement | ||||||||||||||||||
| Sales | CZK mil | ... | ... | 9,068 | 9,458 | 9,443 | 9,283 | 9,790 | ||||||||||
| Cost of Goods & Services | CZK mil | ... | ... | 7,141 | 7,300 | 7,395 | 7,170 | 7,125 | ||||||||||
| Gross Profit | CZK mil | ... | ... | 1,927 | 2,158 | 2,047 | 2,113 | 2,664 | ||||||||||
| Staff Cost | CZK mil | ... | ... | 421 | 439 | 463 | 499 | 647 | ||||||||||
| Other Operating Cost (Income) | CZK mil | ... | ... | 69.4 | 55.5 | 70.3 | 8.73 | -98.4 | ||||||||||
| EBITDA | CZK mil | ... | ... | 1,437 | 1,664 | 1,514 | 1,605 | 2,116 | ||||||||||
| Depreciation | CZK mil | ... | ... | 457 | 431 | 477 | 693 | 807 | ||||||||||
| EBIT | CZK mil | ... | ... | 980 | 1,232 | 1,037 | 912 | 1,309 | ||||||||||
| Net Financing Cost | CZK mil | ... | ... | 116 | 150 | 157 | 150 | -20.4 | ||||||||||
| Financing Cost | CZK mil | ... | ... | ... | ... | ... | ... | ... | ... | ... | ... | ... | ... | ... | 163 | 149 | ||
| Extraordinary Cost | CZK mil | ... | ... | 0 | 0 | 0 | 0 | 0 | ||||||||||
| Pre-Tax Profit | CZK mil | ... | ... | 864 | 1,083 | 880 | 763 | 1,330 | ||||||||||
| Tax | CZK mil | ... | ... | 166 | 206 | 169 | 150 | 227 | ||||||||||
| Net Profit | CZK mil | ... | ... | 698 | 876 | 712 | 613 | 1,102 | ||||||||||
| Net Profit Avail. to Common | CZK mil | ... | ... | 698 | 876 | 712 | 613 | 1,102 | ||||||||||
| Dividends | CZK mil | ... | ... | 1,061 | 0 | -0.226 | -0.017 | 0 | ... | |||||||||
| growth rates | ||||||||||||||||||
| Total Revenue Growth | % | ... | ... | ... | 12.2 | 4.30 | -0.163 | -1.69 | 5.46 | |||||||||
| Staff Cost Growth | % | ... | ... | ... | 2.53 | 4.27 | 5.53 | 7.72 | 29.7 | |||||||||
| EBITDA Growth | % | ... | ... | ... | -7.47 | 15.8 | -8.99 | 6.03 | 31.8 | |||||||||
| EBIT Growth | % | ... | ... | ... | -7.09 | 25.7 | -15.8 | -12.1 | 43.5 | |||||||||
| Pre-Tax Profit Growth | % | ... | ... | ... | -14.5 | 25.3 | -18.7 | -13.4 | 74.3 | |||||||||
| Net Profit Growth | % | ... | ... | ... | -14.5 | 25.5 | -18.8 | -13.9 | 79.8 | |||||||||
| ratios | ||||||||||||||||||
| ROE | % | ... | ... | 21.3 | 28.0 | 21.1 | 15.2 | 22.5 | ||||||||||
| ROA | % | ... | ... | 8.68 | 9.47 | 6.65 | 5.35 | 8.18 | ||||||||||
| ROCE | % | ... | ... | 11.7 | 12.2 | 8.28 | 6.40 | 9.46 | ||||||||||
| Gross Margin | % | ... | ... | 21.3 | 22.8 | 21.7 | 22.8 | 27.2 | ||||||||||
| EBITDA Margin | % | ... | ... | 15.8 | 17.6 | 16.0 | 17.3 | 21.6 | ||||||||||
| EBIT Margin | % | ... | ... | 10.8 | 13.0 | 11.0 | 9.83 | 13.4 | ||||||||||
| Net Margin | % | ... | ... | 7.70 | 9.27 | 7.54 | 6.60 | 11.3 | ||||||||||
| Payout Ratio | % | ... | ... | 152 | 0 | -0.032 | -0.003 | 0 | ... | |||||||||
| Cost of Financing | % | ... | ... | ... | ... | ... | ... | ... | ... | ... | ... | ... | ... | ... | 3.47 | 2.70 | ||
| Net Debt/EBITDA | ... | ... | 1.23 | 1.53 | 1.92 | 1.79 | 2.16 |
| balance sheet | Unit | 2003 | 2004 | 2005 | 2006 | 2007 | 2008 | 2009 | 2010 | 2011 | 2012 | 2013 | 2014 | 2015 | 2016 | 2017 | 2018 | 2019 |
| balance sheet | ||||||||||||||||||
| Cash & Cash Equivalents | CZK mil | 11.8 | 13.0 | 13.8 | 14.9 | 16.6 | ||||||||||||
| Receivables | CZK mil | 1,219 | 1,022 | 977 | 1,435 | 1,461 | ||||||||||||
| Inventories | CZK mil | 797 | 1,104 | 1,237 | 1,218 | 1,370 | ||||||||||||
| Other ST Assets | CZK mil | 406 | 213 | 291 | < -0.001 | -0.200 | ||||||||||||
| Current Assets | CZK mil | 2,433 | 2,353 | 2,518 | 2,668 | 2,848 | ||||||||||||
| Property, Plant & Equipment | CZK mil | 5,101 | 5,823 | 6,768 | 6,896 | 10,492 | ||||||||||||
| LT Investments & Receivables | CZK mil | 821 | 1,810 | 1,792 | 1,792 | 1,771 | ||||||||||||
| Intangible Assets | CZK mil | 69.7 | 103 | 127 | 183 | 169 | ||||||||||||
| Goodwill | CZK mil | 0 | 0 | 0 | 0 | 0 | ||||||||||||
| Non-Current Assets | CZK mil | 5,991 | 7,735 | 8,686 | 8,871 | 12,431 | ||||||||||||
| Total Assets | CZK mil | 8,426 | 10,090 | 11,305 | 11,613 | 15,338 | ||||||||||||
| Trade Payables | CZK mil | 1,678 | 1,767 | 1,808 | 1,455 | 2,020 | ||||||||||||
| Short-Term Debt | CZK mil | 32.7 | 1,664 | 1,876 | 4,688 | 6,359 | ||||||||||||
| Other ST Liabilities | CZK mil | 376 | 377 | 443 | 437 | 731 | ||||||||||||
| Current Liabilities | CZK mil | 2,087 | 3,809 | 4,128 | 6,580 | 9,111 | ||||||||||||
| Long-Term Debt | CZK mil | 2,573 | 2,701 | 2,839 | 0 | 0 | ||||||||||||
| Other LT Liabilities | CZK mil | 469 | 460 | 515 | 563 | 591 | ||||||||||||
| Non-Current Liabilities | CZK mil | 3,042 | 3,160 | 3,354 | 563 | 591 | ||||||||||||
| Liabilities | CZK mil | 5,208 | 7,057 | 7,578 | 7,273 | 9,895 | ||||||||||||
| Equity Before Minority Interest | CZK mil | 3,218 | 3,033 | 3,727 | 4,340 | 5,442 | ||||||||||||
| Minority Interest | CZK mil | 0 | 0 | 0 | 0 | 0 | ||||||||||||
| Equity | CZK mil | 3,218 | 3,033 | 3,727 | 4,340 | 5,442 | ||||||||||||
| growth rates | ||||||||||||||||||
| Total Asset Growth | % | ... | 9.93 | 19.7 | 12.0 | 2.73 | 32.1 | |||||||||||
| Shareholders' Equity Growth | % | ... | -3.53 | -5.75 | 22.9 | 16.5 | 25.4 | |||||||||||
| Net Debt Growth | % | ... | -3.94 | 43.4 | 14.5 | -0.985 | 58.7 | |||||||||||
| Total Debt Growth | % | ... | 34.7 | 67.5 | 8.03 | -0.584 | 35.7 | |||||||||||
| ratios | ||||||||||||||||||
| Total Debt | CZK mil | 2,605 | 4,365 | 4,715 | 4,688 | 6,359 | ||||||||||||
| Net Debt | CZK mil | 1,773 | 2,542 | 2,910 | 2,881 | 4,572 | ||||||||||||
| Working Capital | CZK mil | 338 | 359 | 406 | 1,198 | 811 | ||||||||||||
| Capital Employed | CZK mil | 6,329 | 8,094 | 9,092 | 10,069 | 13,243 | ||||||||||||
| Net Debt/Equity | % | 55.1 | 83.8 | 78.1 | 66.4 | 84.0 | ||||||||||||
| Current Ratio | 1.17 | 0.618 | 0.610 | 0.405 | 0.313 | |||||||||||||
| Quick Ratio | 0.590 | 0.272 | 0.240 | 0.220 | 0.162 |
| cash flow | Unit | 2003 | 2004 | 2005 | 2006 | 2007 | 2008 | 2009 | 2010 | 2011 | 2012 | 2013 | 2014 | 2015 | 2016 | 2017 | 2018 | 2019 |
| cash flow | ||||||||||||||||||
| Net Profit | CZK mil | ... | ... | 698 | 876 | 712 | 613 | 1,102 | ||||||||||
| Depreciation | CZK mil | ... | ... | 457 | 431 | 477 | 693 | 807 | ||||||||||
| Non-Cash Items | CZK mil | ... | ... | 234 | 191 | -119 | 686 | -354 | ||||||||||
| Change in Working Capital | CZK mil | ... | ... | -43.9 | -21.5 | -46.6 | -792 | 387 | ||||||||||
| Total Cash From Operations | CZK mil | ... | ... | 1,345 | 1,477 | 1,022 | 1,200 | 1,942 | ||||||||||
| Capital Expenditures | CZK mil | ... | ... | -1,221 | -2,139 | -1,316 | -887 | -3,610 | ||||||||||
| Other Investing Activities | CZK mil | ... | ... | 54.6 | 4.78 | 0.002 | 13.9 | 0.299 | ||||||||||
| Total Cash From Investing | CZK mil | ... | ... | -1,166 | -2,134 | -1,316 | -873 | -3,609 | ||||||||||
| Dividends Paid | CZK mil | ... | ... | ... | -816 | -1,061 | 0 | 0.226 | 0.017 | |||||||||
| Issuance Of Shares | CZK mil | ... | ... | 0 | 0 | 0 | 0 | 0 | ||||||||||
| Issuance Of Debt | CZK mil | ... | ... | 671 | 1,760 | 351 | -27.5 | 1,671 | ||||||||||
| Other Financing Activities | CZK mil | ... | ... | ... | 1,134 | 2,094 | 1,261 | 576 | 3,607 | |||||||||
| Total Cash From Financing | CZK mil | ... | ... | -178 | 658 | 295 | -325 | 1,669 | ||||||||||
| Net Change In Cash | CZK mil | ... | ... | 0.713 | 1.19 | 0.815 | 1.13 | 1.62 | ||||||||||
| ratios | ||||||||||||||||||
| Days Sales Outstanding | days | ... | ... | 49.1 | 39.5 | 37.8 | 56.4 | 54.5 | ||||||||||
| Days Sales Of Inventory | days | ... | ... | 40.7 | 55.2 | 61.0 | 62.0 | 70.2 | ||||||||||
| Days Payable Outstanding | days | ... | ... | 85.8 | 88.4 | 89.2 | 74.1 | 103 | ||||||||||
| Cash Conversion Cycle | days | ... | ... | 4.02 | 6.30 | 9.58 | 44.4 | 21.2 | ||||||||||
| Cash Earnings | CZK mil | ... | ... | 1,155 | 1,308 | 1,188 | 1,306 | 1,909 | ||||||||||
| Free Cash Flow | CZK mil | ... | ... | 178 | -657 | -294 | 326 | -1,668 | ||||||||||
| Capital Expenditures (As % of Sales) | % | ... | ... | 13.5 | 22.6 | 13.9 | 9.56 | 36.9 |
| other ratios | Unit | 2003 | 2004 | 2005 | 2006 | 2007 | 2008 | 2009 | 2010 | 2011 | 2012 | 2013 | 2014 | 2015 | 2016 | 2017 | 2018 | 2019 |
| Employees | ... | ... | 567 | 562 | 589 | 628 | 731 | |||||||||||
| Cost Per Employee | USD per month | ... | ... | 3,160 | 3,044 | 2,744 | 2,623 | 3,142 | ||||||||||
| Cost Per Employee (Local Currency) | CZK per month | ... | ... | 61,831 | 65,048 | 65,500 | 66,178 | 73,723 | ||||||||||
| Material & Energy (As % of Sales) | % | ... | ... | ... | ... | ... | ... | ... | ... | ... | ... | ... | ... | ... | 54.6 | 53.2 | ||
| Services (As % of Sales) | % | ... | ... | ... | ... | ... | ... | ... | ... | ... | ... | ... | ... | ... | 22.6 | 19.6 | ||
| Staff Cost (As % of Sales) | % | ... | ... | 4.64 | 4.64 | 4.90 | 5.37 | 6.61 | ||||||||||
| Effective Tax Rate | % | ... | ... | 19.2 | 19.0 | 19.2 | 19.6 | 17.1 | ||||||||||
| Total Revenue Growth (5-year average) | % | ... | ... | ... | ... | ... | ... | ... | 5.72 | 9.02 | 2.56 | 0.305 | 3.91 | |||||
| Total Revenue Growth (10-year average) | % | ... | ... | ... | ... | ... | ... | ... | ... | ... | ... | ... | ... | 3.07 | 2.26 | 1.69 |
Get all company financials in excel:

By Helgi Library - December 4, 2020
Mondi Steti made a net profit of CZK 1,644 mil with revenues of CZK 11,511 mil in 2019, up by 480% and up by 10.2%, respectively, compared to the previous year. This translates into a net margin of 14.3%. Historically, between 2005 and 2019, the fir...
By Helgi Library - December 4, 2020
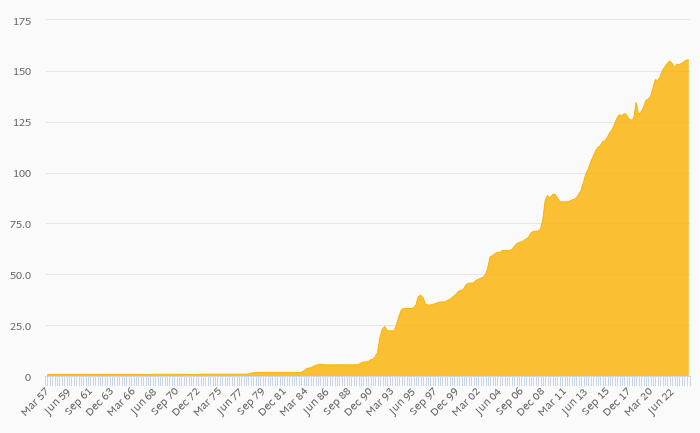
Mondi Steti's total assets reached CZK 19,652 mil at the end of 2019, up 0.94% compared to the previous year. Current assets amounted to CZK 2,808 mil, or 14.3% of total assets while cash stood at CZK 17.4 mil at the end of 2019. ...
By Helgi Library - December 4, 2020
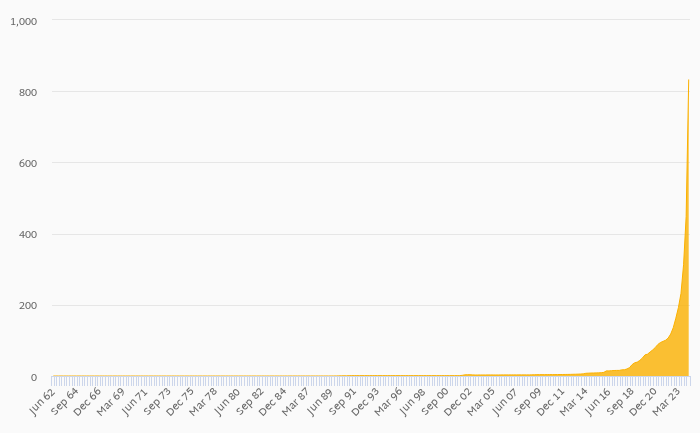
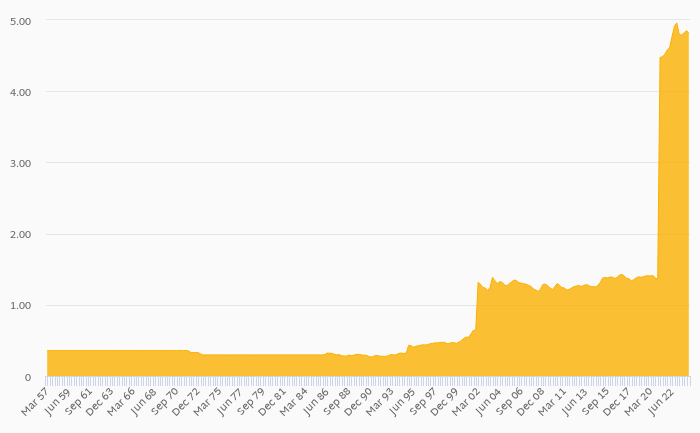
Mondi Steti made a net profit of CZK 1,644 mil in 2019, up 480% compared to the previous year. Historically, between 2005 and 2019, the company's net profit reached a high of CZK 1,644 mil in 2019 and a low of CZK 237 mil in 2009. The result implies a ret...
By Helgi Library - December 4, 2020
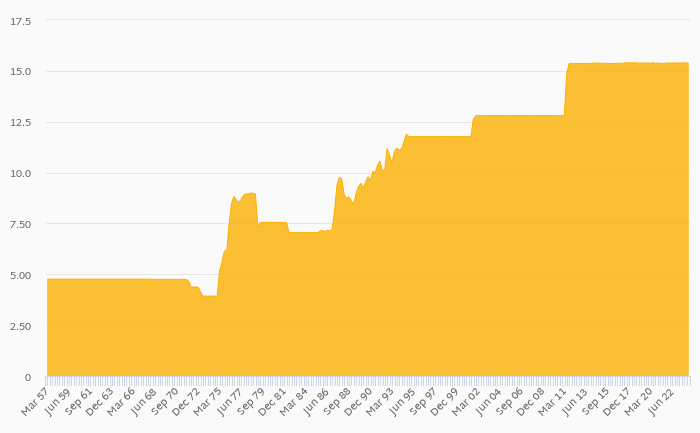
Mondi Steti's net debt stood at CZK 6,681 mil and accounted for 90.7% of equity at the end of 2019. The ratio is down 60.1 pp compared to the previous year. Historically, the firm’s net debt to equity reached a high of 151% in 2018 and a low of ...
By Helgi Library - December 4, 2020
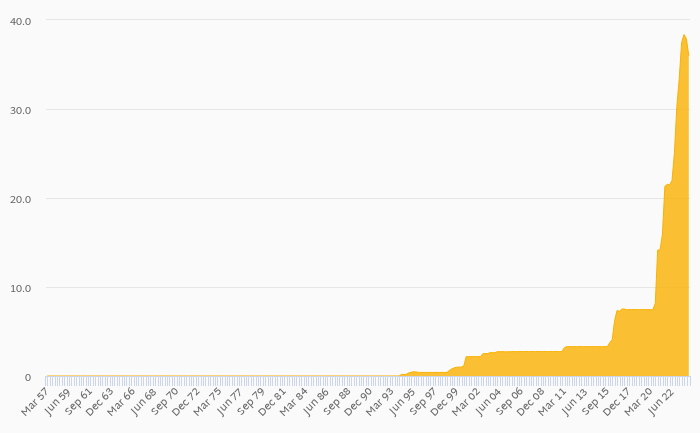
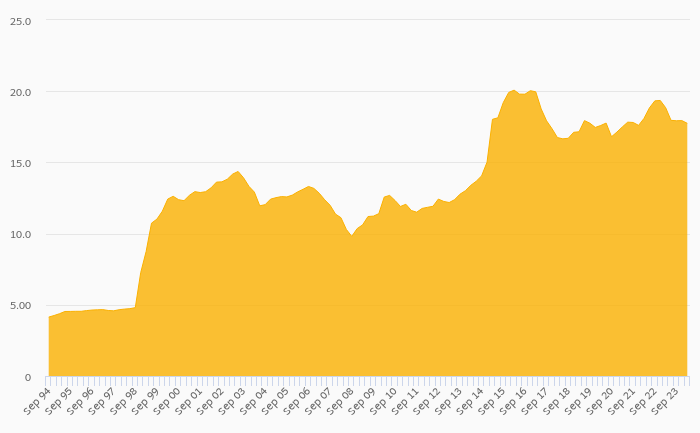
Mondi Steti invested a total of CZK 2,227 mil in 2019, down 56% compared to the previous year. Historically, between 2005 - 2019, the company's investments stood at a high of CZK 5,061 mil in 2018 and a low of CZK 287 mil in 2011. As ...
Mondi Štětí is a Czech Republic-based producer of paper packaging. The Company is based in town Štětí, is the largest paper packaging company in the Czech Republic and is a subsidiary of Mondi Group. The Company was founded in 1949 under name Sepap and privatised in 1990's. Mondi is an international packaging and paper Group, with production operations across 30 countries and revenues of EUR 5.8 bil in 2012. The Group's key operations are located in central Europe, Russia, the Americas and South Africa and as at the end of 2012, Mondi employed 25,700 people

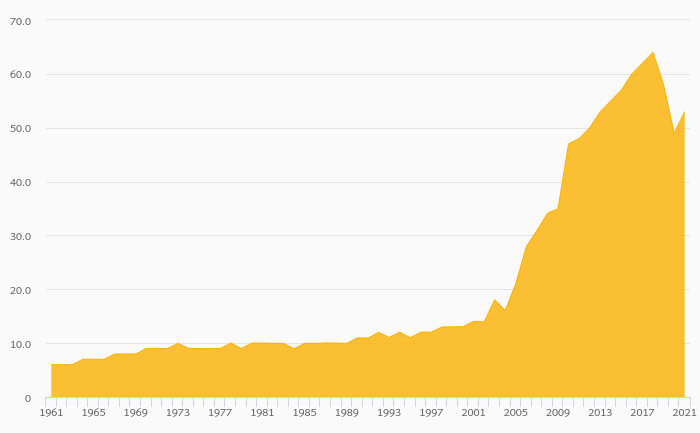
Mondi Steti has been growing its sales by 4.01% a year on average in the last 5 years. EBITDA has grown on average by 12.8% a year during that time to total of CZK 3,035 mil in 2019, or 26.4% of sales. That’s compared to 20.7% average margin seen in last five years.
The company netted CZK 1,644 mil in 2019 implying ROE of 25.1% and ROCE of 9.38%. Again, the average figures were 17.8% and 7.07%, respectively when looking at the previous 5 years.
Mondi Steti’s net debt amounted to CZK 6,681 mil at the end of 2019, or 90.7% of equity. When compared to EBITDA, net debt was 2.20x, down when compared to average of 2.36x seen in the last 5 years.
 Helgi Library