By Helgi Library - November 18, 2019
Nordea made a net profit of EUR -332 mil under revenues of EUR 2,292 mil in the third quarter of 2019, down 146% and up ...
By Helgi Library - November 18, 2019
Nordea stock traded at EUR 6.51 per share at the end third quarter of 2019 implying a market capitalization of USD 28,624 mil. Since th...
By Helgi Library - November 18, 2019
Nordea's non-performing loans reached 1.55% of total loans at the end of 2019-09-30, down from 1.62% compared to the previous yea...
| Profit Statement | 2016 | 2017 | 2018 | |
| Net Interest Income | EUR mil | 4,727 | 4,666 | 4,491 |
| Net Fee Income | EUR mil | 3,238 | 3,369 | 2,993 |
| Other Income | EUR mil | 2,625 | 2,258 | 2,023 |
| Total Revenues | EUR mil | 10,590 | 10,293 | 9,507 |
| Operating Profit | EUR mil | 5,711 | 5,344 | 4,909 |
| Provisions | EUR mil | 502 | 369 | 173 |
| Net Profit | EUR mil | 3,766 | 3,031 | 3,077 |
| Balance Sheet | 2016 | 2017 | 2018 | |
| Interbank Loans | EUR mil | 33,310 | 31,373 | 35,599 |
| Customer Loans | EUR mil | 298,513 | 293,866 | 291,593 |
| Total Assets | EUR mil | 615,659 | 581,612 | 551,408 |
| Shareholders' Equity | EUR mil | 32,410 | 33,316 | 32,901 |
| Interbank Borrowing | EUR mil | 42,134 | 46,999 | 47,119 |
| Customer Deposits | EUR mil | 170,030 | 165,418 | 160,258 |
| Issued Debt Securities | EUR mil | 202,209 | 188,101 | 199,577 |
| Ratios | 2016 | 2017 | 2018 | |
| ROE | % | 11.9 | 9.22 | 9.29 |
| ROA | % | 0.597 | 0.506 | 0.543 |
| Costs (As % Of Assets) | % | 0.773 | 0.827 | 0.812 |
| Costs (As % Of Income) | % | 46.1 | 48.1 | 48.4 |
| Capital Adequacy Ratio | % | 24.7 | 25.2 | 19.9 |
| Net Interest Margin | % | 0.749 | 0.779 | 0.793 |
| Loans (As % Of Deposits) | % | 176 | 178 | 182 |
| NPLs (As % Of Loans) | % | 1.84 | 2.05 | 1.56 |
| Provisions (As % Of NPLs) | % | 43.7 | 38.4 | 44.2 |
| Valuation | 2016 | 2017 | 2018 | |
| Price/Earnings (P/E) | 11.3 | 13.4 | 9.53 | |
| Price/Book Value (P/BV) | 1.32 | 1.22 | 0.891 | |
| Dividend Yield | % | 6.15 | 6.74 | 9.51 |
| Earnings Per Share (EPS) | 0.933 | 0.750 | 0.762 | |
| Book Value Per Share | 8.03 | 8.25 | 8.15 | |
| Dividend Per Share | 0.650 | 0.680 | 0.691 | |
Get all company financials in excel:
| summary | Unit | 1997 | 1998 | 1999 | 2000 | 2001 | 2002 | 2003 | 2004 | 2005 | 2006 | 2007 | 2008 | 2009 | 2010 | 2011 | 2012 | 2013 | 2014 | 2015 | 2016 | 2017 | 2018 |
| income statement | |||||||||||||||||||||||
| Net Interest Income | EUR mil | 5,563 | 5,525 | 5,482 | 4,963 | 4,727 | |||||||||||||||||
| Total Revenues | EUR mil | 10,682 | 10,726 | 10,790 | 10,772 | 10,590 | |||||||||||||||||
| Operating Profit | EUR mil | 5,656 | 5,703 | 5,930 | 6,098 | 5,711 | |||||||||||||||||
| Net Profit | EUR mil | 3,119 | 3,116 | 3,332 | 3,662 | 3,766 | |||||||||||||||||
| balance sheet | |||||||||||||||||||||||
| Interbank Loans | EUR mil | 44,717 | 59,477 | 73,885 | 51,377 | 33,310 | |||||||||||||||||
| Customer Loans | EUR mil | 320,073 | 303,292 | 298,568 | 308,646 | 298,513 | |||||||||||||||||
| Debt Securities | EUR mil | 118,162 | 124,109 | 130,086 | 132,296 | 135,446 | |||||||||||||||||
| Total Assets | EUR mil | 668,178 | 630,434 | 669,342 | 646,868 | 615,659 | |||||||||||||||||
| Shareholders' Equity | EUR mil | 29,976 | 31,073 | 31,788 | 31,032 | 32,410 | |||||||||||||||||
| Interbank Borrowing | EUR mil | 72,326 | 85,790 | 80,607 | 53,628 | 42,134 | |||||||||||||||||
| Customer Deposits | EUR mil | 183,778 | 174,043 | 172,969 | 179,630 | 170,030 | |||||||||||||||||
| Issued Debt Securities | EUR mil | 189,734 | 190,283 | 200,265 | 211,137 | 202,209 | |||||||||||||||||
| ratios | |||||||||||||||||||||||
| ROE | % | 10.7 | 10.2 | 10.6 | 11.7 | 11.9 | |||||||||||||||||
| ROA | % | 0.451 | 0.480 | 0.513 | 0.556 | 0.597 | |||||||||||||||||
| Costs (As % Of Assets) | % | 0.726 | 0.774 | 0.748 | 0.710 | 0.773 | |||||||||||||||||
| Costs (As % Of Income) | % | 47.1 | 46.8 | 45.0 | 43.4 | 46.1 | |||||||||||||||||
| Capital Adequacy Ratio | % | 16.2 | 18.1 | 20.7 | 21.6 | 24.7 | |||||||||||||||||
| Net Interest Margin | % | 0.804 | 0.851 | 0.844 | 0.754 | 0.749 | |||||||||||||||||
| Interest Income (As % Of Revenues) | % | 52.1 | 51.5 | 50.8 | 46.1 | 44.6 | |||||||||||||||||
| Fee Income (As % Of Revenues) | % | 23.1 | 24.6 | 26.3 | 30.0 | 30.6 | |||||||||||||||||
| Equity (As % Of Assets) | % | 4.49 | 4.93 | 4.75 | 4.80 | 5.26 | |||||||||||||||||
| Loans (As % Of Deposits) | % | 174 | 174 | 173 | 172 | 176 | |||||||||||||||||
| Loans (As % Assets) | % | 47.9 | 48.1 | 44.6 | 47.7 | 48.5 | |||||||||||||||||
| NPLs (As % Of Loans) | % | ... | ... | ... | ... | ... | 2.13 | 2.14 | 2.13 | 1.91 | 1.84 | ||||||||||||
| Provisions (As % Of NPLs) | % | ... | ... | ... | ... | ... | 41.0 | 42.7 | 42.8 | 44.7 | 43.7 | ||||||||||||
| valuation | |||||||||||||||||||||||
| Market Capitalisation (End Of Period) | USD mil | ... | ... | 38,337 | 54,370 | 47,137 | 44,550 | 45,057 | |||||||||||||||
| Number Of Shares (Average) | mil | 4,026 | 4,020 | 4,031 | 4,031 | 4,037 | |||||||||||||||||
| Share Price (End Of Period) | EUR | ... | ... | 7.22 | 9.81 | 9.66 | 10.2 | 10.6 | |||||||||||||||
| Earnings Per Share (EPS) | 0.775 | 0.775 | 0.827 | 0.908 | 0.933 | ||||||||||||||||||
| Book Value Per Share | 7.45 | 7.73 | 7.89 | 7.70 | 8.03 | ||||||||||||||||||
| Dividend Per Share | 0.340 | 0.431 | 0.620 | 0.641 | 0.650 | ||||||||||||||||||
| Price/Earnings (P/E) | ... | ... | 9.31 | 12.7 | 11.7 | 11.2 | 11.3 | ||||||||||||||||
| Price/Book Value (P/BV) | ... | ... | 0.969 | 1.27 | 1.23 | 1.32 | 1.32 | ||||||||||||||||
| Dividend Yield | % | ... | ... | 4.72 | 4.40 | 6.42 | 6.32 | 6.15 | |||||||||||||||
| Earnings Per Share Growth | % | ... | 18.8 | 0.053 | 6.64 | 9.90 | 2.69 | ||||||||||||||||
| Book Value Per Share Growth | % | ... | 6.55 | 3.81 | 2.02 | -2.38 | 4.29 |
| income statement | Unit | 1997 | 1998 | 1999 | 2000 | 2001 | 2002 | 2003 | 2004 | 2005 | 2006 | 2007 | 2008 | 2009 | 2010 | 2011 | 2012 | 2013 | 2014 | 2015 | 2016 | 2017 | 2018 |
| income statement | |||||||||||||||||||||||
| Interest Income | EUR mil | 11,939 | 10,604 | 9,995 | 8,549 | 7,747 | |||||||||||||||||
| Interest Cost | EUR mil | 6,376 | 5,079 | 4,513 | 3,586 | 3,020 | |||||||||||||||||
| Net Interest Income | EUR mil | 5,563 | 5,525 | 5,482 | 4,963 | 4,727 | |||||||||||||||||
| Net Fee Income | EUR mil | 2,468 | 2,642 | 2,842 | 3,230 | 3,238 | |||||||||||||||||
| Other Income | EUR mil | 2,651 | 2,559 | 2,466 | 2,579 | 2,625 | |||||||||||||||||
| Total Revenues | EUR mil | 10,682 | 10,726 | 10,790 | 10,772 | 10,590 | |||||||||||||||||
| Operating Cost | EUR mil | 5,026 | 5,023 | 4,860 | 4,674 | 4,879 | |||||||||||||||||
| Operating Profit | EUR mil | 5,656 | 5,703 | 5,930 | 6,098 | 5,711 | |||||||||||||||||
| Provisions | EUR mil | 895 | 735 | 534 | 479 | 502 | |||||||||||||||||
| Extra and Other Cost | EUR mil | 722 | 852 | 1,089 | 915 | 584 | |||||||||||||||||
| Pre-Tax Profit | EUR mil | 4,039 | 4,116 | 4,307 | 4,704 | 4,625 | |||||||||||||||||
| Tax | EUR mil | 970 | 1,009 | 950 | 1,042 | 859 | |||||||||||||||||
| Minorities | EUR mil | 7.00 | 0 | 0 | 0 | 0 | |||||||||||||||||
| Net Profit | EUR mil | 3,119 | 3,116 | 3,332 | 3,662 | 3,766 | |||||||||||||||||
| Dividends | EUR mil | 1,370 | 1,734 | 2,501 | 2,584 | 2,625 | |||||||||||||||||
| growth rates | |||||||||||||||||||||||
| Net Interest Income Growth | % | ... | 1.96 | -0.683 | -0.778 | -9.47 | -4.76 | ||||||||||||||||
| Net Fee Income Growth | % | ... | 3.05 | 7.05 | 7.57 | 13.7 | 0.248 | ||||||||||||||||
| Total Revenue Growth | % | ... | 4.99 | 0.412 | 0.597 | -0.167 | -1.69 | ||||||||||||||||
| Operating Cost Growth | % | ... | -3.66 | -0.060 | -3.25 | -3.83 | 4.39 | ||||||||||||||||
| Operating Profit Growth | % | ... | 14.1 | 0.831 | 3.98 | 2.83 | -6.35 | ||||||||||||||||
| Pre-Tax Profit Growth | % | ... | 13.9 | 1.91 | 4.64 | 9.22 | -1.68 | ||||||||||||||||
| Net Profit Growth | % | ... | 18.7 | -0.096 | 6.93 | 9.90 | 2.84 |
| balance sheet | Unit | 1997 | 1998 | 1999 | 2000 | 2001 | 2002 | 2003 | 2004 | 2005 | 2006 | 2007 | 2008 | 2009 | 2010 | 2011 | 2012 | 2013 | 2014 | 2015 | 2016 | 2017 | 2018 |
| balance sheet | |||||||||||||||||||||||
| Cash | EUR mil | 44,065 | 45,298 | 38,025 | 48,724 | 43,334 | |||||||||||||||||
| Interbank Loans | EUR mil | 44,717 | 59,477 | 73,885 | 51,377 | 33,310 | |||||||||||||||||
| Customer Loans | EUR mil | 320,073 | 303,292 | 298,568 | 308,646 | 298,513 | |||||||||||||||||
| Mortgage Loans | EUR mil | ... | ... | ... | ... | ... | ... | ... | ... | ... | ... | ... | ... | ... | ... | ... | ... | ... | ... | 130,232 | 133,341 | ||
| Corporate Loans | EUR mil | 176,040 | 160,745 | 149,284 | 145,268 | 133,788 | |||||||||||||||||
| Debt Securities | EUR mil | 118,162 | 124,109 | 130,086 | 132,296 | 135,446 | |||||||||||||||||
| Fixed Assets | EUR mil | 3,899 | 3,677 | 3,417 | 3,765 | 4,358 | |||||||||||||||||
| Total Assets | EUR mil | 668,178 | 630,434 | 669,342 | 646,868 | 615,659 | |||||||||||||||||
| Shareholders' Equity | EUR mil | 29,976 | 31,073 | 31,788 | 31,032 | 32,410 | |||||||||||||||||
| Of Which Minority Interest | EUR mil | 5.00 | 2.00 | 2.00 | 1.00 | 1.00 | |||||||||||||||||
| Liabilities | EUR mil | 638,202 | 599,361 | 637,554 | 615,836 | 583,249 | |||||||||||||||||
| Interbank Borrowing | EUR mil | 72,326 | 85,790 | 80,607 | 53,628 | 42,134 | |||||||||||||||||
| Customer Deposits | EUR mil | 183,778 | 174,043 | 172,969 | 179,630 | 170,030 | |||||||||||||||||
| Issued Debt Securities | EUR mil | 189,734 | 190,283 | 200,265 | 211,137 | 202,209 | |||||||||||||||||
| Other Liabilities | EUR mil | 192,364 | 149,245 | 183,713 | 171,441 | 168,876 | |||||||||||||||||
| asset quality | |||||||||||||||||||||||
| Non-Performing Loans | EUR mil | ... | ... | ... | ... | ... | 6,881 | 6,540 | 6,425 | 5,960 | 5,541 | ||||||||||||
| Gross Loans | EUR mil | 322,893 | 306,084 | 301,315 | 311,308 | 300,937 | |||||||||||||||||
| Provisions | EUR mil | 895 | 735 | 534 | 479 | 502 | |||||||||||||||||
| growth rates | |||||||||||||||||||||||
| Customer Loan Growth | % | ... | 3.11 | -5.24 | -1.56 | 3.38 | -3.28 | ||||||||||||||||
| Retail Loan Growth | % | ... | 5.45 | -1.03 | 4.73 | 5.94 | 1.86 | ||||||||||||||||
| Mortgage Loan Growth | % | ... | ... | ... | ... | ... | ... | ... | ... | ... | ... | ... | ... | ... | ... | ... | ... | ... | ... | ... | 2.39 | ||
| Corporate Loan Growth | % | ... | 1.27 | -8.69 | -7.13 | -2.69 | -7.90 | ||||||||||||||||
| Total Asset Growth | % | ... | -6.71 | -5.65 | 6.17 | -3.36 | -4.82 | ||||||||||||||||
| Shareholders' Equity Growth | % | ... | 6.50 | 3.66 | 2.30 | -2.38 | 4.44 | ||||||||||||||||
| Customer Deposit Growth | % | ... | -1.58 | -5.30 | -0.617 | 3.85 | -5.34 |
| ratios | Unit | 1997 | 1998 | 1999 | 2000 | 2001 | 2002 | 2003 | 2004 | 2005 | 2006 | 2007 | 2008 | 2009 | 2010 | 2011 | 2012 | 2013 | 2014 | 2015 | 2016 | 2017 | 2018 |
| ratios | |||||||||||||||||||||||
| ROE | % | 10.7 | 10.2 | 10.6 | 11.7 | 11.9 | |||||||||||||||||
| ROA | % | 0.451 | 0.480 | 0.513 | 0.556 | 0.597 | |||||||||||||||||
| Costs (As % Of Assets) | % | 0.726 | 0.774 | 0.748 | 0.710 | 0.773 | |||||||||||||||||
| Costs (As % Of Income) | % | 47.1 | 46.8 | 45.0 | 43.4 | 46.1 | |||||||||||||||||
| Capital Adequacy Ratio | % | 16.2 | 18.1 | 20.7 | 21.6 | 24.7 | |||||||||||||||||
| Tier 1 Ratio | % | 14.3 | 15.7 | 17.6 | 18.5 | 20.7 | |||||||||||||||||
| Net Interest Margin | % | 0.804 | 0.851 | 0.844 | 0.754 | 0.749 | |||||||||||||||||
| Interest Spread | % | ... | 0.763 | 0.812 | 0.808 | 0.727 | 0.724 | ||||||||||||||||
| Asset Yield | % | 1.72 | 1.63 | 1.54 | 1.30 | 1.23 | |||||||||||||||||
| Cost Of Liabilities | % | ... | 0.962 | 0.821 | 0.730 | 0.572 | 0.504 | ||||||||||||||||
| Payout Ratio | % | 43.9 | 55.6 | 75.1 | 70.6 | 69.7 | |||||||||||||||||
| Interest Income (As % Of Revenues) | % | 52.1 | 51.5 | 50.8 | 46.1 | 44.6 | |||||||||||||||||
| Fee Income (As % Of Revenues) | % | 23.1 | 24.6 | 26.3 | 30.0 | 30.6 | |||||||||||||||||
| Other Income (As % Of Revenues) | % | 24.8 | 23.9 | 22.9 | 23.9 | 24.8 | |||||||||||||||||
| Equity (As % Of Assets) | % | 4.49 | 4.93 | 4.75 | 4.80 | 5.26 | |||||||||||||||||
| Loans (As % Of Deposits) | % | 174 | 174 | 173 | 172 | 176 | |||||||||||||||||
| Loans (As % Assets) | % | 47.9 | 48.1 | 44.6 | 47.7 | 48.5 | |||||||||||||||||
| NPLs (As % Of Loans) | % | ... | ... | ... | ... | ... | 2.13 | 2.14 | 2.13 | 1.91 | 1.84 | ||||||||||||
| Provisions (As % Of NPLs) | % | ... | ... | ... | ... | ... | 41.0 | 42.7 | 42.8 | 44.7 | 43.7 | ||||||||||||
| Provisions (As % Of Loans) | % | 0.881 | 0.921 | 0.920 | 0.862 | 0.812 | |||||||||||||||||
| Cost of Provisions (As % Of Loans) | % | 0.284 | 0.236 | 0.177 | 0.158 | 0.165 |
| other data | Unit | 1997 | 1998 | 1999 | 2000 | 2001 | 2002 | 2003 | 2004 | 2005 | 2006 | 2007 | 2008 | 2009 | 2010 | 2011 | 2012 | 2013 | 2014 | 2015 | 2016 | 2017 | 2018 |
| other data | |||||||||||||||||||||||
| Employees | 31,466 | 29,429 | 29,397 | 29,826 | 31,596 |
Get all company financials in excel:
By Helgi Library - November 18, 2019
Nordea stock traded at EUR 6.51 per share at the end of third quarter of 2019 implying a market capitalization of USD 28,624 mil. Over the last five years, the stock has depreciated by 36.8 implying an annual average growth of -8.78% In absolute terms, th...
By Helgi Library - November 18, 2019
Nordea stock traded at EUR 6.51 per share at the end of third quarter of 2019 implying a market capitalization of USD 28,624 mil. Over the last five years, the stock has depreciated by -36.8 % implying an annual average growth of -8.78 %. In absolute terms, the value ...
By Helgi Library - November 18, 2019
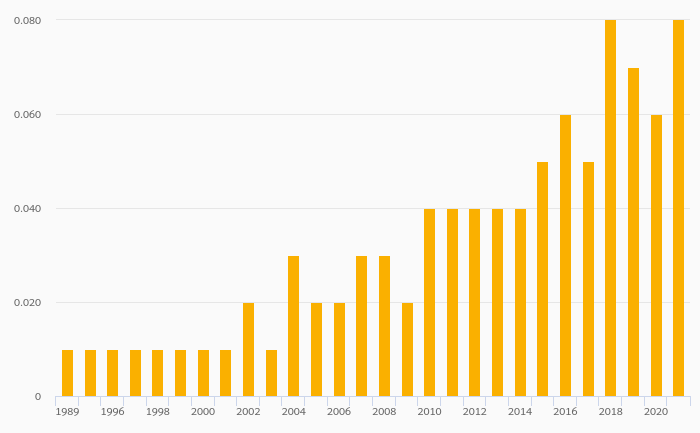
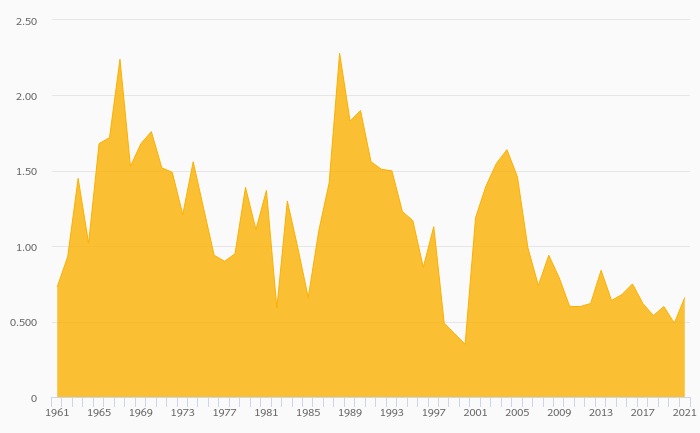
Nordea's net interest margin amounted to 0.741% in the third quarter of 2019, up from 0.730% when compared to the previous quarter. Historically, the bank’s net interest margin reached an all time high of 0.924% in 4Q2010 and an all time low of 0.696% i...
By Helgi Library - November 18, 2019
Nordea generated total banking revenues of EUR 2,292 mil in the third quarter of 2019, up 1.78% when compared to the same period of last year and down 2.39% when compared to the previous quarter. Historically, the bank’s revenues containing of int...
By Helgi Library - November 18, 2019
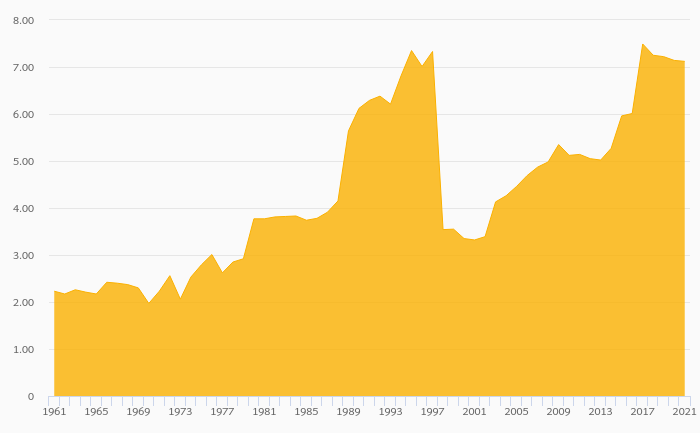
Nordea's capital adequacy ratio reached 20.0% at the end of third quarter of 2019, up from 19.8% when compared to the previous quarter. Historically, the bank’s capital ratio hit an all time high of 26.3% in 3Q2018 and an all time low of 11.9% in 4Q2009. The ...
By Helgi Library - November 18, 2019
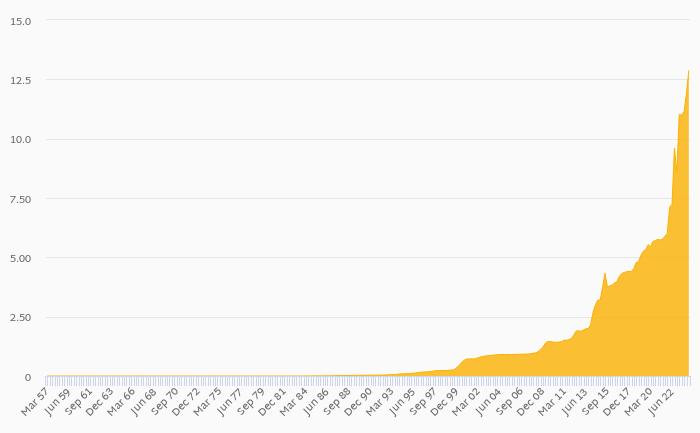
Nordea's loans reached EUR 301,751 mil in the third quarter of 2019, up from EUR 301,739 mil when compared to the previous quarter and up from EUR 293,603 mil when compared to the same period of last year. Historically, the bank’s loans reached an a...
By Helgi Library - November 18, 2019
Nordea's Equity reached 7.25% of total assets in the 3Q2019, down from 7.42% for the previous year. As a share of net customer loans, the ratio amounted to 19.4% at the end of the third quarter of 2019. ...
By Helgi Library - November 18, 2019
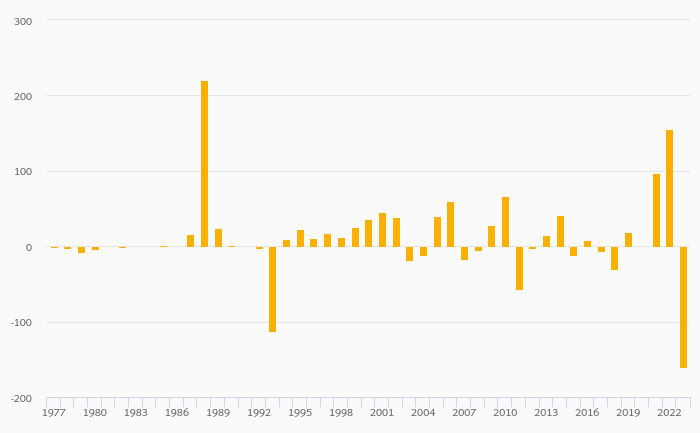
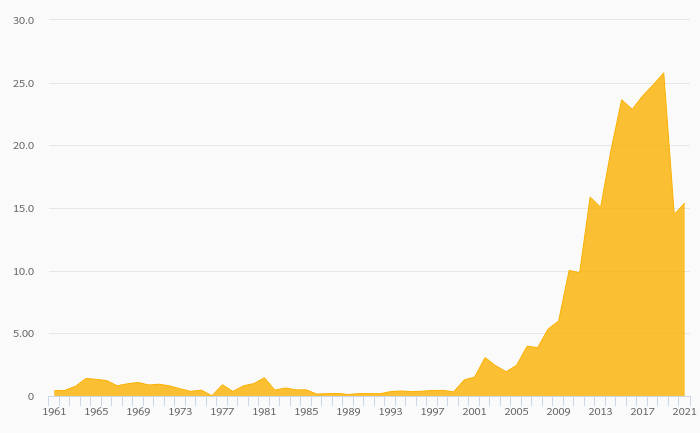
Nordea's customer loan growth reached 2.77% in 2019-09-30, up from -1.76% compared to the previous year. Historically, the bank’s loans growth reached an all time high of 13.0% in 2011-03-31 and an all time low of -5.63% in 2013-09-30. In the last decade,...
By Helgi Library - November 18, 2019
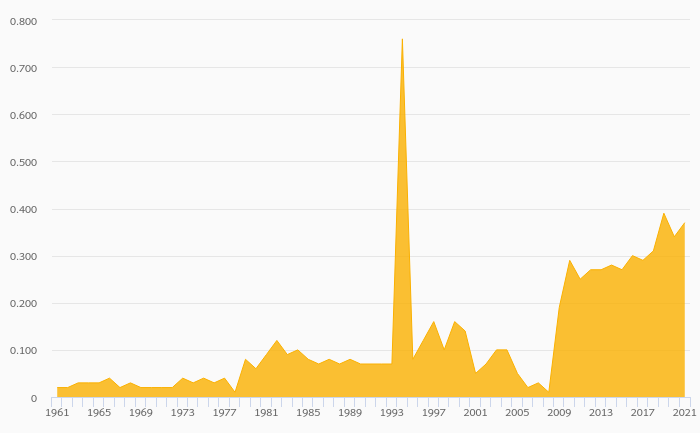
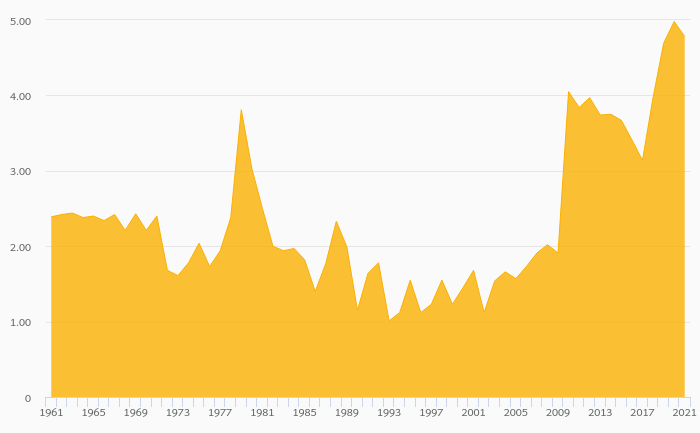
Nordea's net interest margin amounted to 0.793% in 2018, up from 0.779% compared to the previous year. Historically, the bank’s net interest margin reached an all time high of 1.96% in 2000 and an all time low of 0.749% in 2016. The average margin in th...
By Helgi Library - November 18, 2019
Nordea's capital adequacy ratio reached 19.9% at the end of 2018, down from 25.2% compared to the previous year. Historically, the bank’s capital ratio hit an all time high of 25.2% in 2017 and an all time low of 9.10% in 2001. The Tier 1 ratio amounted to ...

Nordea has been growing its revenues and asset by 0.747% and 1.52% a year on average in the last 10 years. Its loans and deposits have grown by 1.39% and 0.852% a year during that time and loans to deposits ratio reached 182% at the end of 2018. The company achieved an average return on equity of 10.5% in the last decade with net profit growing 1.43% a year on average. In terms of operating efficiency, its cost to income ratio reached 48.4% in 2018, compared to 47.0% average in the last decade.
Equity represented 5.97% of total assets or 11.3% of loans at the end of 2018. Nordea's non-performing loans were 1.56% of total loans while provisions covered some 44.2% of NPLs at the end of 2018.
Nordea stock traded at EUR 7.27 per share at the end of 2018 resulting in a market capitalization of USD 33,582 mil. Over the previous five years, stock price fell by 25.9% or 5.83% a year on average. That’s compared to an average ROE of 10.5% the bank generated for its shareholders. This closing price put stock at a 12-month trailing price to earnings (PE) of 9.53x and price to book value (PBV) of 0.891x in 2018.
 Helgi Library