By Helgi Library - July 3, 2019
Norwegian Finans Holding stock traded at NOK 70.5 per share at the end first quarter of 2019 implying a market capitalization of USD 1,534 mi...
By Helgi Library - July 3, 2019
Norwegian Finans Holding stock traded at NOK 70.5 per share at the end first quarter of 2019 implying a market capitalization of USD 1,534 mi...
By Helgi Library - July 3, 2019
Norwegian Finans Holding made a net profit of NOK 483 mil under revenues of NOK 1,251 mil in the first quarter of 2019, up 17.7% and ...
| Profit Statement | 2016 | 2017 | 2018 | |
| Net Interest Income | NOK mil | 2,453 | 3,670 | 4,406 |
| Net Fee Income | NOK mil | 127 | 189 | 233 |
| Other Income | NOK mil | 74.2 | 7.46 | 12.8 |
| Total Revenues | NOK mil | 2,655 | 3,867 | 4,652 |
| Staff Cost | NOK mil | 66.0 | 75.0 | 87.7 |
| Operating Profit | NOK mil | 1,726 | 2,796 | 3,416 |
| Provisions | NOK mil | 468 | 672 | 1,028 |
| Net Profit | NOK mil | 959 | 1,597 | 1,797 |
| Balance Sheet | 2016 | 2017 | 2018 | |
| Interbank Loans | NOK mil | 1,103 | 1,261 | 1,702 |
| Customer Loans | NOK mil | 24,534 | 32,452 | 37,798 |
| Total Assets | NOK mil | 30,402 | 43,000 | 50,436 |
| Shareholders' Equity | NOK mil | 3,335 | 3,921 | 7,544 |
| Interbank Borrowing | NOK mil | 0 | 0 | 0 |
| Customer Deposits | NOK mil | 24,424 | 33,682 | 39,092 |
| Issued Debt Securities | NOK mil | 2,099 | 2,717 | 2,855 |
| Ratios | 2016 | 2017 | 2018 | |
| ROE | % | 36.9 | 44.0 | 31.3 |
| ROA | % | 4.00 | 4.35 | 3.85 |
| Costs (As % Of Assets) | % | 3.87 | 2.92 | 2.65 |
| Costs (As % Of Income) | % | 35.0 | 27.7 | 26.6 |
| Capital Adequacy Ratio | % | 16.4 | 20.9 | 23.7 |
| Net Interest Margin | % | 10.2 | 10.0 | 9.43 |
| Loans (As % Of Deposits) | % | 100 | 96.3 | 96.7 |
| NPLs (As % Of Loans) | % | 6.52 | 7.79 | 9.97 |
| Provisions (As % Of NPLs) | % | 50.3 | 43.6 | 42.6 |
| Valuation | 2016 | 2017 | 2018 | |
| Price/Earnings (P/E) | 14.0 | 10.8 | 7.35 | |
| Price/Book Value (P/BV) | 4.04 | 4.50 | 1.75 | |
| Earnings Per Share (EPS) | NOK | 5.33 | 8.79 | 9.62 |
| Book Value Per Share | NOK | 18.5 | 21.0 | 40.4 |
Get all company financials in excel:
| summary | Unit | 2013 | 2014 | 2015 | 2016 | 2017 | 2018 |
| income statement | |||||||
| Net Interest Income | NOK mil | 636 | 975 | 1,424 | 2,453 | ||
| Total Revenues | NOK mil | 699 | 1,044 | 1,520 | 2,655 | ||
| Operating Profit | NOK mil | 414 | 622 | 947 | 1,726 | ||
| Net Profit | NOK mil | 238 | 348 | 540 | 959 | ||
| balance sheet | |||||||
| Interbank Loans | NOK mil | 106 | 300 | 478 | 1,103 | ||
| Customer Loans | NOK mil | 6,364 | 9,419 | 13,808 | 24,534 | ||
| Debt Securities | NOK mil | 1,694 | 3,463 | 2,969 | 4,464 | ||
| Total Assets | NOK mil | 8,349 | 13,416 | 17,604 | 30,402 | ||
| Shareholders' Equity | NOK mil | 791 | 1,260 | 1,860 | 3,335 | ||
| Interbank Borrowing | NOK mil | 0 | 0 | 0 | 0 | ||
| Customer Deposits | NOK mil | 6,592 | 10,156 | 13,367 | 24,424 | ||
| Issued Debt Securities | NOK mil | 500 | 1,606 | 1,880 | 2,099 | ||
| ratios | |||||||
| ROE | % | 30.1 | 33.9 | 34.6 | 36.9 | ||
| ROA | % | 2.85 | 3.20 | 3.48 | 4.00 | ||
| Costs (As % Of Assets) | % | 3.41 | 3.88 | 3.70 | 3.87 | ||
| Costs (As % Of Income) | % | 40.8 | 40.5 | 37.7 | 35.0 | ||
| Capital Adequacy Ratio | % | 17.9 | 16.0 | 15.7 | 16.4 | ||
| Net Interest Margin | % | 7.62 | 8.96 | 9.18 | 10.2 | ||
| Interest Income (As % Of Revenues) | % | 91.0 | 93.4 | 93.6 | 92.4 | ||
| Fee Income (As % Of Revenues) | % | 7.50 | 6.89 | 7.50 | 4.79 | ||
| Staff Cost (As % Of Total Cost) | % | 16.2 | 12.3 | 10.1 | 7.11 | ||
| Equity (As % Of Assets) | % | 9.47 | 9.39 | 10.6 | 11.0 | ||
| Loans (As % Of Deposits) | % | 96.5 | 92.7 | 103 | 100 | ||
| Loans (As % Assets) | % | 76.2 | 70.2 | 78.4 | 80.7 | ||
| NPLs (As % Of Loans) | % | ... | ... | ... | 6.52 | ||
| Provisions (As % Of NPLs) | % | ... | ... | ... | 50.3 | ||
| valuation | |||||||
| Market Capitalisation (End Of Period) | USD mil | ... | ... | ... | 1,562 | ||
| Number Of Shares (Average) | mil | ... | ... | ... | 180 | ||
| Share Price (End Of Period) | NOK | ... | ... | ... | 74.8 | ||
| Earnings Per Share (EPS) | NOK | ... | ... | ... | 5.33 | ||
| Book Value Per Share | NOK | ... | ... | ... | 18.5 | ||
| Price/Earnings (P/E) | ... | ... | ... | 14.0 | |||
| Price/Book Value (P/BV) | ... | ... | ... | 4.04 | |||
| Earnings Per Share Growth | % | ... | ... | ... | ... | ||
| Book Value Per Share Growth | % | ... | 53.3 | 46.0 | 72.3 |
| income statement | Unit | 2013 | 2014 | 2015 | 2016 | 2017 | 2018 |
| income statement | |||||||
| Interest Income | NOK mil | 864 | 1,278 | 1,709 | 2,791 | ||
| Interest Cost | NOK mil | 228 | 303 | 286 | 338 | ||
| Net Interest Income | NOK mil | 636 | 975 | 1,424 | 2,453 | ||
| Net Fee Income | NOK mil | 52.4 | 71.9 | 114 | 127 | ||
| Other Income | NOK mil | 10.3 | -3.00 | -17.4 | 74.2 | ||
| Total Revenues | NOK mil | 699 | 1,044 | 1,520 | 2,655 | ||
| Staff Cost | NOK mil | 46.3 | 52.0 | 58.2 | 66.0 | ||
| Depreciation | NOK mil | 9.70 | 10.5 | 15.5 | 42.4 | ||
| Other Cost | NOK mil | 229 | 360 | 500 | 820 | ||
| Operating Cost | NOK mil | 285 | 422 | 574 | 929 | ||
| Operating Profit | NOK mil | 414 | 622 | 947 | 1,726 | ||
| Provisions | NOK mil | 82.8 | 143 | 208 | 468 | ||
| Extra and Other Cost | NOK mil | 0 | 0 | -0.100 | 0 | ||
| Pre-Tax Profit | NOK mil | 331 | 479 | 739 | 1,258 | ||
| Tax | NOK mil | 93.1 | 131 | 199 | 298 | ||
| Net Profit | NOK mil | 238 | 348 | 540 | 959 | ||
| growth rates | |||||||
| Net Interest Income Growth | % | ... | 53.3 | 46.0 | 72.3 | ||
| Net Fee Income Growth | % | ... | 37.2 | 58.6 | 11.6 | ||
| Total Revenue Growth | % | ... | 49.4 | 45.6 | 74.6 | ||
| Operating Cost Growth | % | ... | 48.2 | 35.8 | 61.9 | ||
| Operating Profit Growth | % | ... | 50.2 | 52.3 | 82.3 | ||
| Pre-Tax Profit Growth | % | ... | 44.7 | 54.3 | 70.3 | ||
| Net Profit Growth | % | ... | 46.3 | 55.1 | 77.7 |
| balance sheet | Unit | 2013 | 2014 | 2015 | 2016 | 2017 | 2018 |
| balance sheet | |||||||
| Cash | NOK mil | 54.0 | 59.0 | 59.0 | 60.0 | ||
| Interbank Loans | NOK mil | 106 | 300 | 478 | 1,103 | ||
| Customer Loans | NOK mil | 6,364 | 9,419 | 13,808 | 24,534 | ||
| Debt Securities | NOK mil | 1,694 | 3,463 | 2,969 | 4,464 | ||
| Fixed Assets | NOK mil | 32.1 | 35.0 | 42.8 | 108 | ||
| Total Assets | NOK mil | 8,349 | 13,416 | 17,604 | 30,402 | ||
| Shareholders' Equity | NOK mil | 791 | 1,260 | 1,860 | 3,335 | ||
| Liabilities | NOK mil | 7,558 | 12,156 | 15,744 | 27,067 | ||
| Interbank Borrowing | NOK mil | 0 | 0 | 0 | 0 | ||
| Customer Deposits | NOK mil | 6,592 | 10,156 | 13,367 | 24,424 | ||
| Issued Debt Securities | NOK mil | 500 | 1,606 | 1,880 | 2,099 | ||
| Other Liabilities | NOK mil | 466 | 395 | 497 | 544 | ||
| asset quality | |||||||
| Non-Performing Loans | NOK mil | ... | ... | ... | 1,654 | ||
| Gross Loans | NOK mil | 6,611 | 9,615 | 14,200 | 25,365 | ||
| Total Provisions | NOK mil | 247 | 196 | 392 | 831 | ||
| growth rates | |||||||
| Customer Loan Growth | % | ... | 48.0 | 46.6 | 77.7 | ||
| Total Asset Growth | % | ... | 60.7 | 31.2 | 72.7 | ||
| Shareholders' Equity Growth | % | ... | 59.4 | 47.7 | 79.3 | ||
| Customer Deposit Growth | % | ... | 54.1 | 31.6 | 82.7 |
| ratios | Unit | 2013 | 2014 | 2015 | 2016 | 2017 | 2018 |
| ratios | |||||||
| ROE | % | 30.1 | 33.9 | 34.6 | 36.9 | ||
| ROA | % | 2.85 | 3.20 | 3.48 | 4.00 | ||
| Costs (As % Of Assets) | % | 3.41 | 3.88 | 3.70 | 3.87 | ||
| Costs (As % Of Income) | % | 40.8 | 40.5 | 37.7 | 35.0 | ||
| Capital Adequacy Ratio | % | 17.9 | 16.0 | 15.7 | 16.4 | ||
| Tier 1 Ratio | % | 12.8 | 12.6 | 13.4 | 15.1 | ||
| Net Interest Margin | % | 7.62 | 8.96 | 9.18 | 10.2 | ||
| Interest Spread | % | ... | 8.67 | 8.97 | 10.1 | ||
| Asset Yield | % | 10.4 | 11.7 | 11.0 | 11.6 | ||
| Cost Of Liabilities | % | ... | 3.07 | 2.05 | 1.58 | ||
| Interest Income (As % Of Revenues) | % | 91.0 | 93.4 | 93.6 | 92.4 | ||
| Fee Income (As % Of Revenues) | % | 7.50 | 6.89 | 7.50 | 4.79 | ||
| Other Income (As % Of Revenues) | % | 1.47 | -0.287 | -1.14 | 2.80 | ||
| Cost Per Employee | USD per month | 13,941 | 13,610 | 10,628 | 9,785 | ||
| Cost Per Employee (Local Currency) | NOK per month | 82,092 | 92,199 | 86,607 | 85,277 | ||
| Staff Cost (As % Of Total Cost) | % | 16.2 | 12.3 | 10.1 | 7.11 | ||
| Equity (As % Of Assets) | % | 9.47 | 9.39 | 10.6 | 11.0 | ||
| Loans (As % Of Deposits) | % | 96.5 | 92.7 | 103 | 100 | ||
| Loans (As % Assets) | % | 76.2 | 70.2 | 78.4 | 80.7 | ||
| NPLs (As % Of Loans) | % | ... | ... | ... | 6.52 | ||
| Provisions (As % Of NPLs) | % | ... | ... | ... | 50.3 | ||
| Provisions (As % Of Loans) | % | 3.88 | 2.08 | 2.84 | 3.39 | ||
| Cost of Provisions (As % Of Loans) | % | 1.30 | 1.81 | 1.79 | 2.44 |
| other data | Unit | 2013 | 2014 | 2015 | 2016 | 2017 | 2018 |
| other data | |||||||
| Employees | 47.0 | 47.0 | 56.0 | 64.5 |
Get all company financials in excel:


By Helgi Library - July 3, 2019
Norwegian Finans Holding made a net profit of NOK 483 mil under revenues of NOK 1,251 mil in the first quarter of 2019, up 17.7% and 17.6% respectively when compared to the same period last year. Historically, the bank’s net profit reached an all time high of ...
By Helgi Library - July 3, 2019
Norwegian Finans Holding's net interest margin amounted to 9.16% in the first quarter of 2019, down from 9.37% when compared to the previous quarter. Historically, the bank’s net interest margin reached an all time high of 10.1% in 1Q2017 and an all time low...
By Helgi Library - July 3, 2019
Norwegian Finans Holding's net interest margin amounted to 9.16% in the first quarter of 2019, down from 9.37% when compared to the previous quarter. Historically, the bank’s net interest margin reached an all time high of 10.1% in 1Q2017 and an all time low...
By Helgi Library - October 23, 2019
Norwegian Finans Holding stock traded at NOK 70.5 per share at the end of first quarter of 2019 implying a market capitalization of USD 1,534 mil. Over the last five years, the stock has appreciated by 0 implying an annual average growth of 0% In absolute...
By Helgi Library - October 23, 2019
Norwegian Finans Holding stock traded at NOK 70.5 per share at the end of first quarter of 2019 implying a market capitalization of USD 1,534 mil. Over the last five years, the stock has appreciated by 0 implying an annual average growth of 0% In absolute...
By Helgi Library - July 3, 2019
Norwegian Finans Holding stock traded at NOK 70.5 per share at the end of first quarter of 2019 implying a market capitalization of USD 1,534 mil. Over the last five years, the stock has appreciated by % implying an annual average growth of 0 %. In absolute terms, th...
By Helgi Library - July 3, 2019
Norwegian Finans Holding generated total banking revenues of NOK 1,251 mil in the first quarter of 2019, up 17.6% when compared to the same period of last year and 2.91% when compared to the previous quarter. Historically, the bank’s revenues containing of in...
By Helgi Library - July 3, 2019
Norwegian Finans Holding generated total banking revenues of NOK 1,251 mil in the first quarter of 2019, up 17.6% when compared to the same period of last year and 2.91% when compared to the previous quarter. Historically, the bank’s revenues containing of in...
By Helgi Library - October 7, 2019
Norwegian Finans Holding's Equity reached 64.5% of total assets in the 1Q2019, up from 55.3% for the previous year. As a share of net customer loans, the ratio amounted to 90.9% at the end of the first quarter of 2019. ...

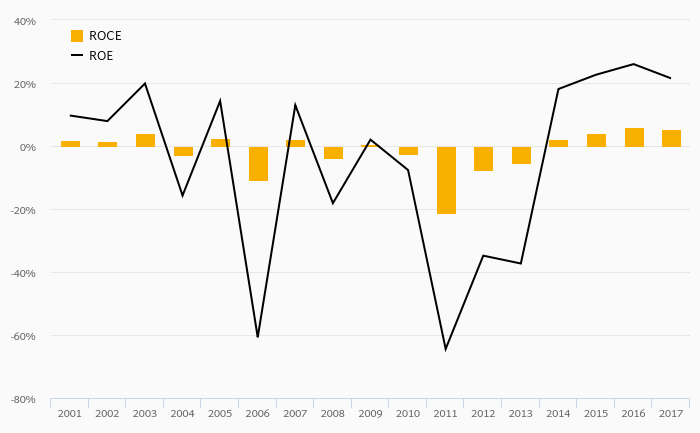
Norwegian Finans Holding has been growing its revenues and asset by 45.2% and 42.0% a year on average in the last 3 years. Its loans and deposits have grown by 39.9% and 43.0% a year during that time and loans to deposits ratio reached 96.7% at the end of 2018. The company achieved an average return on equity of 37.4% in the last three years with net profit growing 49.3% a year on average. In terms of operating efficiency, its cost to income ratio reached 26.6% in 2018, compared to 29.8% average in the last three years.
Equity represented 15.0% of total assets or 20.0% of loans at the end of 2018. Norwegian Finans Holding's non-performing loans were 9.97% of total loans while provisions covered some 42.6% of NPLs at the end of 2018.
Norwegian Finans Holding stock traded at NOK 70.7 per share at the end of 2018 resulting in a market capitalization of USD 1,608 mil. Over the previous three years, stock price rose by 0% or 0% a year on average. That’s compared to an average ROE of 37.4% the bank generated for its shareholders. This closing price put stock at a 12-month trailing price to earnings (PE) of 7.35x and price to book value (PBV) of 1.75x in 2018.
 Helgi Library