By Helgi Library - October 12, 2020
PGNiG's total assets reached PLN 50,960 mil at the end of 1Q2016, up 2.93% compared to the previous year. Current ...
By Helgi Library - April 2, 2020
PGNiG's total assets reached PLN 49,825 mil at the end of 2015, up 1.84% compared to the previous year. Current as...
| Profit Statement | Sep 2015 | Dec 2015 | Mar 2016 | |
| Sales | PLN mil | 6,305 | 9,769 | 10,980 |
| Gross Profit | PLN mil | 2,535 | 3,048 | 3,344 |
| EBITDA | PLN mil | 1,313 | 771 | 2,393 |
| EBIT | PLN mil | 627 | 54.0 | 1,721 |
| Financing Cost | PLN mil | 96.0 | 70.4 | -48.0 |
| Pre-Tax Profit | PLN mil | 480 | -17.2 | 1,769 |
| Net Profit | PLN mil | 291 | -21.0 | 1,386 |
| Dividends | PLN mil | 1,180 | 0 | 96.0 |
| Balance Sheet | Sep 2015 | Dec 2015 | Mar 2016 | |
| Total Assets | PLN mil | 48,739 | 49,825 | 50,960 |
| Non-Current Assets | PLN mil | 36,595 | 36,959 | 36,764 |
| Current Assets | PLN mil | 12,144 | 12,866 | 14,196 |
| Working Capital | PLN mil | 3,699 | 2,313 | 1,421 |
| Shareholders' Equity | PLN mil | 31,016 | 30,741 | 32,103 |
| Liabilities | PLN mil | 17,723 | 19,084 | 18,857 |
| Total Debt | PLN mil | 6,350 | 6,382 | 6,351 |
| Net Debt | PLN mil | 1,559 | 143 | -1,934 |
| Ratios | Sep 2015 | Dec 2015 | Mar 2016 | |
| ROE | % | 9.19 | 6.86 | 7.29 |
| ROCE | % | 7.10 | 5.41 | 5.84 |
| Gross Margin | % | 33.2 | 33.6 | 34.1 |
| EBITDA Margin | % | 17.5 | 16.7 | 17.6 |
| EBIT Margin | % | 10.5 | 9.02 | 9.58 |
| Net Margin | % | 7.45 | 5.85 | 6.52 |
| Net Debt/EBITDA | 0.234 | 0.024 | -0.315 | |
| Net Debt/Equity | 0.050 | 0.005 | -0.060 | |
| Cost of Financing | % | 4.98 | 3.84 | 1.72 |
| Valuation | Sep 2015 | Dec 2015 | Mar 2016 | |
Get all company financials in excel:
| summary | Unit | Mar 2010 | Jun 2010 | Sep 2010 | Dec 2010 | Mar 2011 | Jun 2011 | Sep 2011 | Dec 2011 | Mar 2012 | Jun 2012 | Sep 2012 | Dec 2012 | Mar 2013 | Jun 2013 | Sep 2013 | Dec 2013 | Mar 2014 | Jun 2014 | Sep 2014 | Dec 2014 | Mar 2015 | Jun 2015 | Sep 2015 | Dec 2015 | Mar 2016 |
| income statement | ||||||||||||||||||||||||||
| Sales | PLN mil | 6,436 | 11,487 | 12,495 | 7,895 | 6,305 | ||||||||||||||||||||
| Gross Profit | PLN mil | 2,672 | 3,459 | 3,658 | 3,008 | 2,535 | ||||||||||||||||||||
| EBIT | PLN mil | 915 | 759 | 1,662 | 947 | 627 | ||||||||||||||||||||
| Net Profit | PLN mil | 616 | 688 | 1,243 | 621 | 291 | ||||||||||||||||||||
| ROE | % | 6.78 | 9.55 | 9.60 | 10.3 | 9.19 | ||||||||||||||||||||
| EBIT Margin | % | 9.96 | 11.2 | 10.6 | 11.2 | 10.5 | ||||||||||||||||||||
| Net Margin | % | 6.18 | 8.23 | 7.74 | 8.27 | 7.45 | ||||||||||||||||||||
| balance sheet | ||||||||||||||||||||||||||
| Total Assets | PLN mil | 48,642 | 48,926 | 49,509 | 48,428 | 48,739 | ||||||||||||||||||||
| Non-Current Assets | PLN mil | 37,001 | 37,692 | 37,532 | 36,882 | 36,595 | ||||||||||||||||||||
| Current Assets | PLN mil | 11,641 | 11,234 | 11,977 | 11,546 | 12,144 | ||||||||||||||||||||
| Shareholders' Equity | PLN mil | 29,689 | 30,169 | 31,531 | 31,056 | 31,016 | ||||||||||||||||||||
| Liabilities | PLN mil | 18,953 | 18,757 | 17,978 | 17,372 | 17,723 | ||||||||||||||||||||
| Non-Current Liabilities | PLN mil | 12,166 | 12,384 | 12,245 | 11,630 | 12,714 | ||||||||||||||||||||
| Current Liabilities | PLN mil | 6,787 | 6,373 | 5,733 | 5,742 | 5,009 | ||||||||||||||||||||
| Net Debt/EBITDA | ... | ... | ... | 0.592 | 0.454 | 0.101 | -0.036 | 0.234 | ||||||||||||||||||
| Net Debt/Equity | 0.115 | 0.095 | 0.021 | -0.008 | 0.050 | |||||||||||||||||||||
| Cost of Financing | % | ... | ... | ... | 5.03 | 6.08 | 6.94 | 5.01 | 4.98 | |||||||||||||||||
| cash flow | ||||||||||||||||||||||||||
| Total Cash From Operations | PLN mil | 721 | 2,555 | 3,016 | 1,613 | 286 | ||||||||||||||||||||
| Total Cash From Investing | PLN mil | -655 | -1,786 | -851 | -659 | -781 | ||||||||||||||||||||
| Total Cash From Financing | PLN mil | 100 | -1,635 | -341 | -298 | -156 | ||||||||||||||||||||
| Net Change In Cash | PLN mil | 166 | -866 | 1,824 | 656 | -651 |
| income statement | Unit | Mar 2010 | Jun 2010 | Sep 2010 | Dec 2010 | Mar 2011 | Jun 2011 | Sep 2011 | Dec 2011 | Mar 2012 | Jun 2012 | Sep 2012 | Dec 2012 | Mar 2013 | Jun 2013 | Sep 2013 | Dec 2013 | Mar 2014 | Jun 2014 | Sep 2014 | Dec 2014 | Mar 2015 | Jun 2015 | Sep 2015 | Dec 2015 | Mar 2016 |
| income statement | ||||||||||||||||||||||||||
| Sales | PLN mil | 6,436 | 11,487 | 12,495 | 7,895 | 6,305 | ||||||||||||||||||||
| Cost of Goods & Services | PLN mil | 3,764 | 8,028 | 8,837 | 4,887 | 3,770 | ||||||||||||||||||||
| Gross Profit | PLN mil | 2,672 | 3,459 | 3,658 | 3,008 | 2,535 | ||||||||||||||||||||
| Staff Cost | PLN mil | 631 | 823 | 698 | 583 | 525 | ||||||||||||||||||||
| Other Cost | PLN mil | 522 | 1,278 | 634 | 755 | 697 | ||||||||||||||||||||
| EBITDA | PLN mil | 1,519 | 1,359 | 2,326 | 1,670 | 1,313 | ||||||||||||||||||||
| Depreciation | PLN mil | 604 | 600 | 664 | 723 | 686 | ||||||||||||||||||||
| EBIT | PLN mil | 915 | 759 | 1,662 | 947 | 627 | ||||||||||||||||||||
| Financing Cost | PLN mil | 109 | 130 | 72.0 | -14.0 | 96.0 | ||||||||||||||||||||
| Extraordinary Cost | PLN mil | 0 | -128 | 0 | 0 | 51.0 | ||||||||||||||||||||
| Pre-Tax Profit | PLN mil | 806 | 757 | 1,590 | 961 | 480 | ||||||||||||||||||||
| Tax | PLN mil | 190 | 71.0 | 346 | 340 | 188 | ||||||||||||||||||||
| Minorities | PLN mil | 0 | -2.70 | 1.00 | 0 | 1.00 | ||||||||||||||||||||
| Net Profit | PLN mil | 616 | 688 | 1,243 | 621 | 291 | ||||||||||||||||||||
| Dividends | PLN mil | 885 | 0 | 77.0 | 0 | 1,180 | ||||||||||||||||||||
| growth rates | ||||||||||||||||||||||||||
| Total Revenue Growth | % | ... | ... | ... | ... | 3.76 | 26.2 | 31.0 | 15.3 | -2.04 | ||||||||||||||||
| Operating Cost Growth | % | ... | ... | ... | ... | -3.27 | -25.0 | -10.6 | -32.6 | 5.98 | ||||||||||||||||
| EBITDA Growth | % | ... | ... | ... | ... | 3.19 | 69.0 | 6.65 | 29.9 | -13.6 | ||||||||||||||||
| EBIT Growth | % | ... | ... | ... | ... | 3.86 | 707 | 6.68 | 55.0 | -31.5 | ||||||||||||||||
| Pre-Tax Profit Growth | % | ... | ... | ... | ... | -0.494 | ... | 4.61 | 19.2 | -40.4 | ||||||||||||||||
| Net Profit Growth | % | ... | ... | ... | ... | -5.81 | -527 | 5.25 | 83.7 | -52.8 | ||||||||||||||||
| ratios | ||||||||||||||||||||||||||
| ROE | % | 6.78 | 9.55 | 9.60 | 10.3 | 9.19 | ||||||||||||||||||||
| ROCE | % | ... | ... | ... | 4.95 | 7.04 | 7.13 | 7.88 | 7.10 | |||||||||||||||||
| Gross Margin | % | ... | ... | ... | 41.4 | 38.1 | 35.1 | 33.4 | 33.2 | |||||||||||||||||
| EBITDA Margin | % | ... | ... | ... | 18.1 | 18.5 | 17.4 | 17.9 | 17.5 | |||||||||||||||||
| EBIT Margin | % | 9.96 | 11.2 | 10.6 | 11.2 | 10.5 | ||||||||||||||||||||
| Net Margin | % | 6.18 | 8.23 | 7.74 | 8.27 | 7.45 | ||||||||||||||||||||
| Payout Ratio | % | 83.7 | 31.3 | 33.3 | 30.4 | 44.2 | ||||||||||||||||||||
| Cost of Financing | % | ... | ... | ... | 5.03 | 6.08 | 6.94 | 5.01 | 4.98 | |||||||||||||||||
| Net Debt/EBITDA | ... | ... | ... | 0.592 | 0.454 | 0.101 | -0.036 | 0.234 |
| balance sheet | Unit | Mar 2010 | Jun 2010 | Sep 2010 | Dec 2010 | Mar 2011 | Jun 2011 | Sep 2011 | Dec 2011 | Mar 2012 | Jun 2012 | Sep 2012 | Dec 2012 | Mar 2013 | Jun 2013 | Sep 2013 | Dec 2013 | Mar 2014 | Jun 2014 | Sep 2014 | Dec 2014 | Mar 2015 | Jun 2015 | Sep 2015 | Dec 2015 | Mar 2016 |
| balance sheet | ||||||||||||||||||||||||||
| Non-Current Assets | PLN mil | 37,001 | 37,692 | 37,532 | 36,882 | 36,595 | ||||||||||||||||||||
| Property, Plant & Equipment | PLN mil | 32,722 | 33,528 | 33,420 | 33,088 | 32,886 | ||||||||||||||||||||
| Intangible Assets | PLN mil | 1,123 | 1,113 | 1,134 | 1,121 | 1,103 | ||||||||||||||||||||
| Current Assets | PLN mil | 11,641 | 11,234 | 11,977 | 11,546 | 12,144 | ||||||||||||||||||||
| Inventories | PLN mil | 4,314 | 3,189 | 2,214 | 2,651 | 3,502 | ||||||||||||||||||||
| Receivables | PLN mil | 2,919 | 4,236 | 3,858 | 2,414 | 2,810 | ||||||||||||||||||||
| Cash & Cash Equivalents | PLN mil | 3,823 | 2,958 | 4,783 | 5,435 | 4,791 | ||||||||||||||||||||
| Total Assets | PLN mil | 48,642 | 48,926 | 49,509 | 48,428 | 48,739 | ||||||||||||||||||||
| Shareholders' Equity | PLN mil | 29,689 | 30,169 | 31,531 | 31,056 | 31,016 | ||||||||||||||||||||
| Of Which Minority Interest | PLN mil | 8.00 | 5.00 | 6.00 | 4.00 | 5.00 | ||||||||||||||||||||
| Liabilities | PLN mil | 18,953 | 18,757 | 17,978 | 17,372 | 17,723 | ||||||||||||||||||||
| Non-Current Liabilities | PLN mil | 12,166 | 12,384 | 12,245 | 11,630 | 12,714 | ||||||||||||||||||||
| Long-Term Debt | PLN mil | 5,145 | 5,069 | 5,009 | 4,800 | 5,914 | ||||||||||||||||||||
| Deferred Tax Liabilities | PLN mil | 3,244 | 3,250 | 3,197 | 3,133 | 3,102 | ||||||||||||||||||||
| Current Liabilities | PLN mil | 6,787 | 6,373 | 5,733 | 5,742 | 5,009 | ||||||||||||||||||||
| Short-Term Debt | PLN mil | 2,105 | 769 | 430 | 390 | 436 | ||||||||||||||||||||
| Trade Payables | PLN mil | 3,197 | 3,589 | 3,508 | 3,791 | 2,613 | ||||||||||||||||||||
| Provisions | PLN mil | 595 | 720 | 591 | 610 | 652 | ||||||||||||||||||||
| Equity And Liabilities | PLN mil | 48,642 | 48,926 | 49,509 | 48,428 | 48,739 | ||||||||||||||||||||
| growth rates | ||||||||||||||||||||||||||
| Total Asset Growth | % | ... | ... | ... | ... | 3.69 | 1.12 | 5.82 | 2.61 | 0.199 | ||||||||||||||||
| Shareholders' Equity Growth | % | ... | ... | ... | ... | 4.03 | 6.03 | 6.90 | 7.53 | 4.47 | ||||||||||||||||
| Net Debt Growth | % | ... | ... | ... | ... | -38.3 | -40.4 | -74.5 | -110 | -54.5 | ||||||||||||||||
| Total Debt Growth | % | ... | ... | ... | ... | -2.67 | -23.8 | -12.9 | -15.4 | -12.4 | ||||||||||||||||
| ratios | ||||||||||||||||||||||||||
| Total Debt | PLN mil | 7,250 | 5,838 | 5,439 | 5,190 | 6,350 | ||||||||||||||||||||
| Net Debt | PLN mil | 3,427 | 2,880 | 656 | -245 | 1,559 | ||||||||||||||||||||
| Working Capital | PLN mil | 4,036 | 3,836 | 2,564 | 1,274 | 3,699 | ||||||||||||||||||||
| Capital Employed | PLN mil | 41,037 | 41,528 | 40,096 | 38,156 | 40,294 | ||||||||||||||||||||
| Net Debt/Equity | 0.115 | 0.095 | 0.021 | -0.008 | 0.050 | |||||||||||||||||||||
| Cost of Financing | % | ... | ... | ... | 5.03 | 6.08 | 6.94 | 5.01 | 4.98 |
| cash flow | Unit | Mar 2010 | Jun 2010 | Sep 2010 | Dec 2010 | Mar 2011 | Jun 2011 | Sep 2011 | Dec 2011 | Mar 2012 | Jun 2012 | Sep 2012 | Dec 2012 | Mar 2013 | Jun 2013 | Sep 2013 | Dec 2013 | Mar 2014 | Jun 2014 | Sep 2014 | Dec 2014 | Mar 2015 | Jun 2015 | Sep 2015 | Dec 2015 | Mar 2016 |
| cash flow | ||||||||||||||||||||||||||
| Net Profit | PLN mil | 616 | 688 | 1,243 | 621 | 291 | ||||||||||||||||||||
| Depreciation | PLN mil | 604 | 600 | 664 | 723 | 686 | ||||||||||||||||||||
| Non-Cash Items | PLN mil | ... | 1,060 | 1,067 | -163 | -1,021 | 1,734 | |||||||||||||||||||
| Change in Working Capital | PLN mil | ... | -1,559 | 200 | 1,272 | 1,290 | -2,425 | |||||||||||||||||||
| Total Cash From Operations | PLN mil | 721 | 2,555 | 3,016 | 1,613 | 286 | ||||||||||||||||||||
| Capital Expenditures | PLN mil | -662 | -1,798 | -873 | -683 | -734 | ||||||||||||||||||||
| Other Investments | PLN mil | 7.00 | 12.0 | 22.0 | 24.0 | -47.0 | ||||||||||||||||||||
| Total Cash From Investing | PLN mil | -655 | -1,786 | -851 | -659 | -781 | ||||||||||||||||||||
| Dividends Paid | PLN mil | ... | 0 | -885 | 0 | -77.0 | 0 | |||||||||||||||||||
| Issuance Of Debt | PLN mil | ... | 1,117 | -1,412 | -399 | -249 | 1,160 | |||||||||||||||||||
| Total Cash From Financing | PLN mil | 100 | -1,635 | -341 | -298 | -156 | ||||||||||||||||||||
| Net Change In Cash | PLN mil | 166 | -866 | 1,824 | 656 | -651 | ||||||||||||||||||||
| ratios | ||||||||||||||||||||||||||
| Days Sales Outstanding | days | 33.4 | 45.1 | 37.8 | 23.0 | 26.9 | ||||||||||||||||||||
| Days Sales Of Inventory | days | 84.2 | 54.8 | 33.4 | 37.9 | 50.1 | ||||||||||||||||||||
| Days Payable Outstanding | days | 62.4 | 61.7 | 52.9 | 54.2 | 37.4 | ||||||||||||||||||||
| Cash Conversion Cycle | days | 55.2 | 38.2 | 18.3 | 6.69 | 39.6 | ||||||||||||||||||||
| Cash Earnings | PLN mil | 1,220 | 1,288 | 1,907 | 1,344 | 977 | ||||||||||||||||||||
| Free Cash Flow | PLN mil | 66.0 | 769 | 2,165 | 954 | -495 |
| other data | Unit | Mar 2010 | Jun 2010 | Sep 2010 | Dec 2010 | Mar 2011 | Jun 2011 | Sep 2011 | Dec 2011 | Mar 2012 | Jun 2012 | Sep 2012 | Dec 2012 | Mar 2013 | Jun 2013 | Sep 2013 | Dec 2013 | Mar 2014 | Jun 2014 | Sep 2014 | Dec 2014 | Mar 2015 | Jun 2015 | Sep 2015 | Dec 2015 | Mar 2016 |
| other data | ||||||||||||||||||||||||||
| ROA | % | 4.13 | 5.89 | 5.94 | 6.48 | 5.81 | ||||||||||||||||||||
| Gross Margin | % | ... | ... | ... | 41.4 | 38.1 | 35.1 | 33.4 | 33.2 | |||||||||||||||||
| Staff Cost (As % Of Total Cost) | % | 10.8 | 9.28 | 8.52 | 8.04 | 7.69 | ||||||||||||||||||||
| Effective Tax Rate | % | 28.2 | 20.3 | 20.1 | 23.0 | 24.9 | ||||||||||||||||||||
| Sales from Natural Gas Total | PLN mil | 4,882 | 9,750 | 10,767 | 6,368 | 5,009 | ||||||||||||||||||||
| Sales from Natural Gas - High-methane gas | PLN mil | 4,623 | 9,332 | 10,310 | 6,052 | 4,734 | ||||||||||||||||||||
| Sales from Natural Gas - Nitrogen-rich gas | PLN mil | 259 | 418 | 457 | 316 | 275 | ||||||||||||||||||||
| Sales from Crude Oil | PLN mil | 567 | 435 | 461 | 587 | 462 | ||||||||||||||||||||
| Sales from NGL | PLN mil | ... | ... | ... | ... | ... | ... | ... | ... | ... | ... | ... | ... | 35.0 | 12.0 | 24.0 | 18.0 | 18.0 | ||||||||
| Sales from Helium | PLN mil | 20.0 | 18.0 | 19.0 | 24.0 | 16.0 | ||||||||||||||||||||
| Sales From Electricity | PLN mil | ... | ... | ... | ... | ... | ... | ... | ... | 385 | 444 | 439 | 326 | 330 | ||||||||||||
| Sales from Heat | PLN mil | ... | ... | ... | ... | ... | ... | ... | ... | 117 | 380 | 433 | 192 | 113 | ||||||||||||
| Sales From Services | PLN mil | 191 | 186 | 100 | 98.0 | 65.0 | ||||||||||||||||||||
| Sales from Exploration & Production | PLN mil | 1,002 | 860 | 811 | 893 | 733 | ||||||||||||||||||||
| Sales from Trade & Storage | PLN mil | 5,167 | 10,080 | 11,071 | 6,589 | 5,241 | ||||||||||||||||||||
| Sales from Distribution | PLN mil | 83.0 | 118 | 91.0 | 169 | 144 | ||||||||||||||||||||
| Sales from Generation | PLN mil | ... | ... | ... | ... | ... | ... | ... | ... | 135 | 406 | 457 | 212 | 136 | ||||||||||||
| EBIT from Exploration & Production | PLN mil | 717 | -27.0 | 561 | 286 | 425 | ||||||||||||||||||||
| EBIT from Trade & Storage | PLN mil | 86.0 | 417 | 579 | 162 | -109 | ||||||||||||||||||||
| EBIT from Distribution | PLN mil | 156 | 300 | 302 | 477 | 373 | ||||||||||||||||||||
| EBIT from Generation | PLN mil | ... | ... | ... | ... | ... | ... | ... | ... | -47.0 | 76.0 | 227 | 24.0 | -69.0 | ||||||||||||
| EBITDA from Exploration & Production | PLN mil | 994 | 208 | 878 | 664 | 767 | ||||||||||||||||||||
| EBITDA from Trade & Storage | PLN mil | 125 | 482 | 619 | 205 | -66.0 | ||||||||||||||||||||
| EBITDA from Distribution | PLN mil | 372 | 517 | 521 | 697 | 596 | ||||||||||||||||||||
| EBITDA from Generation | PLN mil | ... | ... | ... | ... | ... | ... | ... | ... | 21.0 | 154 | 310 | 102 | 5.00 | ||||||||||||
| Sales of Natural Gas Total (mcm) | mcm | 3,556 | 6,804 | 7,721 | 4,803 | 3,936 | ||||||||||||||||||||
| Sales of Natural Gas - High-methane gas (mcm) | mcm | 3,284 | 6,470 | 7,320 | 4,521 | 3,674 | ||||||||||||||||||||
| Sales of Natural Gas - Nitrogen-rich gas (mcm) | mcm | 272 | 334 | 401 | 282 | 262 | ||||||||||||||||||||
| Imports of Natural Gas - Foreign Suppliers Total (mcm) | mcm | 2,143 | 2,423 | 2,574 | 2,495 | 2,398 | ||||||||||||||||||||
| Import of Natural Gas - Gazprom (mcm) | mcm | 1,805 | 1,751 | 1,833 | 2,219 | 2,329 | ||||||||||||||||||||
| Production of Natural Gas Total (mcm) | mcm | 1,057 | 1,132 | 1,185 | 1,109 | 1,137 | ||||||||||||||||||||
| Production of Natural Gas - High-methane gas (mcm) | mcm | 475 | 440 | 501 | 507 | 515 | ||||||||||||||||||||
| Production of Natural Gas - Nitrogen-rich gas (mcm) | mcm | 582 | 692 | 684 | 602 | 622 | ||||||||||||||||||||
| Domestic Production of Natural Gas (mcm) | mcm | 928 | 1,045 | 1,038 | 951 | 969 | ||||||||||||||||||||
| Production of Crude Oil and Condensate (kt) | kt | 304 | 271 | 386 | 317 | 367 | ||||||||||||||||||||
| Sales of Crude Oil and Condensate (kt) | kt | 262 | 249 | 348 | 372 | 356 | ||||||||||||||||||||
| Gas Distribution Volumes (mcm) | mcm | 1,588 | 2,894 | 3,256 | 2,024 | 1,681 |
Get all company financials in excel:

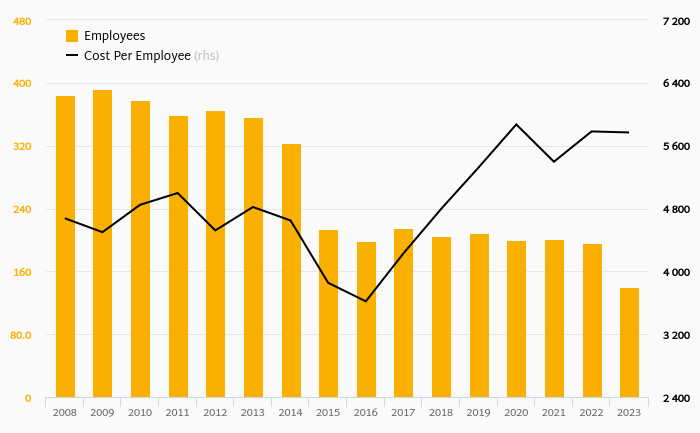


Polskie Górnictwo Naftowe i Gazownictwo (PGNiG) is a Polish state-controlled oil and natural gas company. The company's core activities include the production of natural gas and crude oil domestically, development of natural gas and crude oil on domestic and international level, geological, geophysical and exploration services in Poland and abroad, import of natural gas to Poland and storage of natural gas. PGNiG carries out out its operations through five reportable segments, namely, exploration and production, trade and storage, distribution, generation and other segments. The Company is one of the largest importer of natural gas from Russia, Central Asia, Norway and Germany and the main producer of natural gas from Polish fields. Since 2005, PGNiG is one of the largest companies listed on the Warsaw Stock Exchange
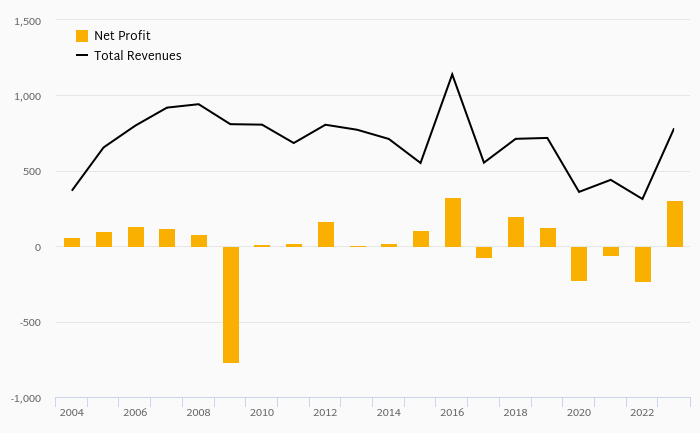
PGNiG has been growing its sales by a year on average in the last 5 years. EBITDA has grown on average by 7.43% a year during that time to total of PLN 6,080 mil in 2015, or 16.7% of sales. That’s compared to 17.1% average margin seen in last five years.
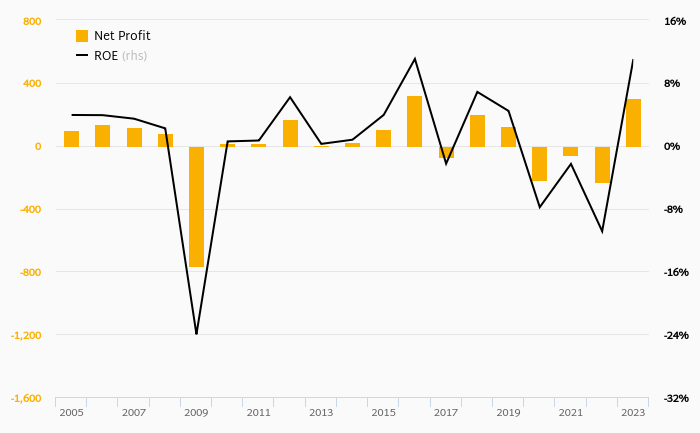
The company netted PLN 2,134 mil in 2015 implying ROE of 7.01% and ROCE of 5.04%. Again, the average figures were 7.86% and 5.38%, respectively when looking at the previous 5 years.
PGNiG’s net debt amounted to PLN 143 mil at the end of 2015, or 0.005 of equity. When compared to EBITDA, net debt was 0.024x, down when compared to average of 0.805x seen in the last 5 years.
PGNiG stock traded at EUR 5.14 per share at the end of 2015 resulting in a market capitalization of USD 7,774 mil. Over the previous five years, stock price grew by 44% or 7.56% a year on average. The closing price put stock at a 12-month trailing EV/EBITDA of 4.78x and price to earnings (PE) of 14.2x as of 2015.
 Helgi Library