By Helgi Library - April 2, 2020
Roche Czech Republic's total assets reached CZK 2,647 mil at the end of 2016, up 3.87% compared to the previous year. ...
By Helgi Library - April 2, 2020
Roche Czech Republic's total assets reached CZK 2,647 mil at the end of 2016, up 3.87% compared to the previous year. ...
| Profit Statement | 2014 | 2015 | 2016 | |
| Sales | CZK mil | 4,364 | 5,445 | 4,962 |
| Gross Profit | CZK mil | 763 | 1,489 | 784 |
| EBITDA | CZK mil | 265 | 209 | 475 |
| EBIT | CZK mil | 134 | 81.5 | 352 |
| Financing Cost | CZK mil | 1.12 | 0.819 | 1.81 |
| Pre-Tax Profit | CZK mil | 133 | 80.6 | 350 |
| Net Profit | CZK mil | 94.9 | 51.0 | 252 |
| Balance Sheet | 2014 | 2015 | 2016 | |
| Total Assets | CZK mil | 2,317 | 2,548 | 2,647 |
| Non-Current Assets | CZK mil | 334 | 319 | 292 |
| Current Assets | CZK mil | 1,962 | 2,228 | 2,276 |
| Working Capital | CZK mil | 1,532 | 1,659 | 1,667 |
| Shareholders' Equity | CZK mil | 1,134 | 1,185 | 1,436 |
| Liabilities | CZK mil | 1,183 | 1,364 | 1,210 |
| Total Debt | CZK mil | 541 | 660 | 203 |
| Net Debt | CZK mil | 541 | 660 | 203 |
| Ratios | 2014 | 2015 | 2016 | |
| ROE | % | 8.00 | 4.40 | 19.2 |
| ROCE | % | 5.39 | 2.65 | 12.8 |
| Gross Margin | % | 17.5 | 27.3 | 15.8 |
| EBITDA Margin | % | 6.07 | 3.84 | 9.57 |
| EBIT Margin | % | 3.07 | 1.50 | 7.10 |
| Net Margin | % | 2.17 | 0.936 | 5.08 |
| Net Debt/EBITDA | 2.04 | 3.15 | 0.428 | |
| Net Debt/Equity | % | 47.7 | 55.7 | 14.2 |
| Cost of Financing | % | 0.272 | 0.136 | 0.420 |
| Cash Flow | 2014 | 2015 | 2016 | |
| Total Cash From Operations | CZK mil | 66.8 | -4.71 | 621 |
| Total Cash From Investing | CZK mil | -125 | -114 | -94.9 |
| Total Cash From Financing | CZK mil | 56.2 | 118 | -458 |
| Net Change In Cash | CZK mil | -2.04 | -0.259 | 68.3 |
| Cash Conversion Cycle | days | 136 | 127 | 129 |
| Cash Earnings | CZK mil | 226 | 179 | 374 |
| Free Cash Flow | CZK mil | -58.3 | -118 | 526 |
Get all company financials in excel:
| summary | Unit | 2003 | 2004 | 2005 | 2006 | 2007 | 2008 | 2009 | 2010 | 2011 | 2012 | 2013 | 2014 | 2015 | 2016 |
| income statement | |||||||||||||||
| Sales | CZK mil | 5,073 | 5,011 | 4,869 | 4,934 | 4,364 | |||||||||
| Gross Profit | CZK mil | 680 | 620 | 634 | 770 | 763 | |||||||||
| EBIT | CZK mil | 138 | 83.1 | 69.0 | 183 | 134 | |||||||||
| Net Profit | CZK mil | 101 | 50.5 | 38.7 | 135 | 94.9 | |||||||||
| ROE | % | 10.5 | 4.85 | 3.57 | 11.5 | 8.00 | |||||||||
| EBIT Margin | % | 2.72 | 1.66 | 1.42 | 3.71 | 3.07 | |||||||||
| Net Margin | % | 1.99 | 1.01 | 0.794 | 2.73 | 2.17 | |||||||||
| Employees | 226 | 220 | 216 | 216 | 202 | ||||||||||
| balance sheet | |||||||||||||||
| Total Assets | CZK mil | 2,473 | 2,238 | 2,344 | 2,245 | 2,317 | |||||||||
| Non-Current Assets | CZK mil | 386 | 329 | 354 | 338 | 334 | |||||||||
| Current Assets | CZK mil | 2,085 | 1,971 | 1,988 | 1,905 | 1,962 | |||||||||
| Shareholders' Equity | CZK mil | 1,015 | 1,065 | 1,104 | 1,239 | 1,134 | |||||||||
| Liabilities | CZK mil | 1,458 | 1,173 | 1,240 | 1,006 | 1,183 | |||||||||
| Non-Current Liabilities | CZK mil | 0.949 | 1.46 | 0 | 0 | 0 | |||||||||
| Current Liabilities | CZK mil | 1,451 | 1,163 | 1,231 | 978 | 1,168 | |||||||||
| Net Debt/EBITDA | 1.67 | -0.002 | 0.737 | 0.867 | 2.04 | ||||||||||
| Net Debt/Equity | % | 41.6 | -0.035 | 13.7 | 23.0 | 47.7 | |||||||||
| Cost of Financing | % | ... | 1.19 | 0.316 | -2.24 | 0.681 | 0.272 | ||||||||
| cash flow | |||||||||||||||
| Total Cash From Operations | CZK mil | -232 | 65.2 | 159 | 127 | 66.8 | |||||||||
| Total Cash From Investing | CZK mil | -158 | -65.5 | -159 | -127 | -125 | |||||||||
| Total Cash From Financing | CZK mil | 390 | 0 | 0 | 0 | 56.2 | |||||||||
| Net Change In Cash | CZK mil | 0.195 | -0.286 | -0.134 | 0.104 | -2.04 |
| income statement | Unit | 2003 | 2004 | 2005 | 2006 | 2007 | 2008 | 2009 | 2010 | 2011 | 2012 | 2013 | 2014 | 2015 | 2016 |
| income statement | |||||||||||||||
| Sales | CZK mil | 5,073 | 5,011 | 4,869 | 4,934 | 4,364 | |||||||||
| Cost of Goods & Services | CZK mil | 4,393 | 4,392 | 4,235 | 4,164 | 3,601 | |||||||||
| Gross Profit | CZK mil | 680 | 620 | 634 | 770 | 763 | |||||||||
| Staff Cost | CZK mil | 338 | 329 | 345 | 373 | 373 | |||||||||
| Other Cost | CZK mil | 88.8 | 82.6 | 85.0 | 68.6 | 125 | |||||||||
| EBITDA | CZK mil | 254 | 208 | 204 | 328 | 265 | |||||||||
| Depreciation | CZK mil | 116 | 125 | 135 | 145 | 131 | |||||||||
| EBIT | CZK mil | 138 | 83.1 | 69.0 | 183 | 134 | |||||||||
| Financing Cost | CZK mil | 2.72 | 0.669 | -1.69 | 1.48 | 1.12 | |||||||||
| Extraordinary Cost | CZK mil | 0 | 0 | 0 | 0 | 0 | |||||||||
| Pre-Tax Profit | CZK mil | 135 | 82.4 | 70.7 | 182 | 133 | |||||||||
| Tax | CZK mil | 34.2 | 31.9 | 32.0 | 46.9 | 38.1 | |||||||||
| Minorities | CZK mil | 0 | 0 | 0 | 0 | 0 | |||||||||
| Net Profit | CZK mil | 101 | 50.5 | 38.7 | 135 | 94.9 | |||||||||
| growth rates | |||||||||||||||
| Total Revenue Growth | % | ... | 4.27 | -1.23 | -2.83 | 1.33 | -11.5 | ||||||||
| Operating Cost Growth | % | ... | -14.5 | -3.47 | 4.38 | 2.78 | 12.6 | ||||||||
| EBITDA Growth | % | ... | 8.45 | -18.2 | -1.49 | 60.6 | -19.3 | ||||||||
| EBIT Growth | % | ... | 8.91 | -39.8 | -16.9 | 165 | -26.8 | ||||||||
| Pre-Tax Profit Growth | % | ... | 8.03 | -39.1 | -14.2 | 157 | -26.8 | ||||||||
| Net Profit Growth | % | ... | 15.7 | -50.1 | -23.3 | 248 | -29.6 | ||||||||
| ratios | |||||||||||||||
| ROE | % | 10.5 | 4.85 | 3.57 | 11.5 | 8.00 | |||||||||
| ROCE | % | ... | 8.06 | 4.01 | 3.25 | 8.93 | 5.39 | ||||||||
| Gross Margin | % | 13.4 | 12.4 | 13.0 | 15.6 | 17.5 | |||||||||
| EBITDA Margin | % | 5.00 | 4.14 | 4.20 | 6.66 | 6.07 | |||||||||
| EBIT Margin | % | 2.72 | 1.66 | 1.42 | 3.71 | 3.07 | |||||||||
| Net Margin | % | 1.99 | 1.01 | 0.794 | 2.73 | 2.17 | |||||||||
| Cost of Financing | % | ... | 1.19 | 0.316 | -2.24 | 0.681 | 0.272 | ||||||||
| Net Debt/EBITDA | 1.67 | -0.002 | 0.737 | 0.867 | 2.04 |
| balance sheet | Unit | 2003 | 2004 | 2005 | 2006 | 2007 | 2008 | 2009 | 2010 | 2011 | 2012 | 2013 | 2014 | 2015 | 2016 |
| balance sheet | |||||||||||||||
| Non-Current Assets | CZK mil | 386 | 329 | 354 | 338 | 334 | |||||||||
| Property, Plant & Equipment | CZK mil | 386 | 329 | 354 | 338 | 334 | |||||||||
| Intangible Assets | CZK mil | 0 | 0 | 0 | 0 | 0 | |||||||||
| Current Assets | CZK mil | 2,085 | 1,971 | 1,988 | 1,905 | 1,962 | |||||||||
| Inventories | CZK mil | 1,409 | 767 | 872 | 775 | 828 | |||||||||
| Receivables | CZK mil | 635 | 983 | 1,087 | 1,108 | 1,101 | |||||||||
| Cash & Cash Equivalents | CZK mil | 0.662 | 0.376 | 0.242 | 0.346 | 0.305 | |||||||||
| Total Assets | CZK mil | 2,473 | 2,238 | 2,344 | 2,245 | 2,317 | |||||||||
| Shareholders' Equity | CZK mil | 1,015 | 1,065 | 1,104 | 1,239 | 1,134 | |||||||||
| Of Which Minority Interest | CZK mil | 0 | 0 | 0 | 0 | 0 | |||||||||
| Liabilities | CZK mil | 1,458 | 1,173 | 1,240 | 1,006 | 1,183 | |||||||||
| Non-Current Liabilities | CZK mil | 0.949 | 1.46 | 0 | 0 | 0 | |||||||||
| Long-Term Debt | CZK mil | 0 | 0 | 0 | 0 | 0 | |||||||||
| Deferred Tax Liabilities | CZK mil | 0.949 | 1.46 | 0 | 0 | 0 | |||||||||
| Current Liabilities | CZK mil | 1,451 | 1,163 | 1,231 | 978 | 1,168 | |||||||||
| Short-Term Debt | CZK mil | 423 | 0 | 151 | 285 | 541 | |||||||||
| Trade Payables | CZK mil | 936 | 1,056 | 953 | 562 | 397 | |||||||||
| Provisions | CZK mil | 6.38 | 7.65 | 9.24 | 27.6 | 15.0 | |||||||||
| Equity And Liabilities | CZK mil | 2,473 | 2,238 | 2,344 | 2,245 | 2,317 | |||||||||
| growth rates | |||||||||||||||
| Total Asset Growth | % | ... | 23.2 | -9.52 | 4.74 | -4.23 | 3.23 | ||||||||
| Shareholders' Equity Growth | % | ... | 11.1 | 4.97 | 3.63 | 12.2 | -8.48 | ||||||||
| Net Debt Growth | % | ... | 1,193 | -100 | -40,192 | 88.9 | 90.0 | ||||||||
| Total Debt Growth | % | ... | ... | 1,177 | -100 | ... | 88.9 | 89.9 | |||||||
| ratios | |||||||||||||||
| Total Debt | CZK mil | 423 | 0 | 151 | 285 | 541 | |||||||||
| Net Debt | CZK mil | 422 | -0.376 | 151 | 285 | 541 | |||||||||
| Working Capital | CZK mil | 1,108 | 694 | 1,007 | 1,321 | 1,532 | |||||||||
| Capital Employed | CZK mil | 1,495 | 1,023 | 1,361 | 1,659 | 1,865 | |||||||||
| Net Debt/Equity | % | 41.6 | -0.035 | 13.7 | 23.0 | 47.7 | |||||||||
| Cost of Financing | % | ... | 1.19 | 0.316 | -2.24 | 0.681 | 0.272 |
| cash flow | Unit | 2003 | 2004 | 2005 | 2006 | 2007 | 2008 | 2009 | 2010 | 2011 | 2012 | 2013 | 2014 | 2015 | 2016 |
| cash flow | |||||||||||||||
| Net Profit | CZK mil | 101 | 50.5 | 38.7 | 135 | 94.9 | |||||||||
| Depreciation | CZK mil | 116 | 125 | 135 | 145 | 131 | |||||||||
| Non-Cash Items | CZK mil | ... | -14.5 | -524 | 297 | 161 | 51.9 | ||||||||
| Change in Working Capital | CZK mil | ... | -434 | 414 | -312 | -314 | -211 | ||||||||
| Total Cash From Operations | CZK mil | -232 | 65.2 | 159 | 127 | 66.8 | |||||||||
| Capital Expenditures | CZK mil | -163 | -77.6 | -165 | -143 | -132 | |||||||||
| Other Investments | CZK mil | 5.21 | 12.1 | 5.53 | 16.2 | 6.80 | |||||||||
| Total Cash From Investing | CZK mil | -158 | -65.5 | -159 | -127 | -125 | |||||||||
| Issuance Of Debt | CZK mil | ... | 390 | -423 | 151 | 134 | 256 | ||||||||
| Total Cash From Financing | CZK mil | 390 | 0 | 0 | 0 | 56.2 | |||||||||
| Net Change In Cash | CZK mil | 0.195 | -0.286 | -0.134 | 0.104 | -2.04 | |||||||||
| ratios | |||||||||||||||
| Days Sales Outstanding | days | 45.7 | 71.6 | 81.5 | 81.9 | 92.1 | |||||||||
| Days Sales Of Inventory | days | 117 | 63.7 | 75.2 | 67.9 | 83.9 | |||||||||
| Days Payable Outstanding | days | 77.7 | 87.8 | 82.1 | 49.3 | 40.2 | |||||||||
| Cash Conversion Cycle | days | 85.0 | 47.6 | 74.5 | 101 | 136 | |||||||||
| Cash Earnings | CZK mil | 217 | 175 | 174 | 280 | 226 | |||||||||
| Free Cash Flow | CZK mil | -390 | -0.286 | -0.134 | 0.104 | -58.3 |
| other data | Unit | 2003 | 2004 | 2005 | 2006 | 2007 | 2008 | 2009 | 2010 | 2011 | 2012 | 2013 | 2014 | 2015 | 2016 |
| other data | |||||||||||||||
| ROA | % | 4.52 | 2.14 | 1.69 | 5.88 | 4.16 | |||||||||
| Gross Margin | % | 13.4 | 12.4 | 13.0 | 15.6 | 17.5 | |||||||||
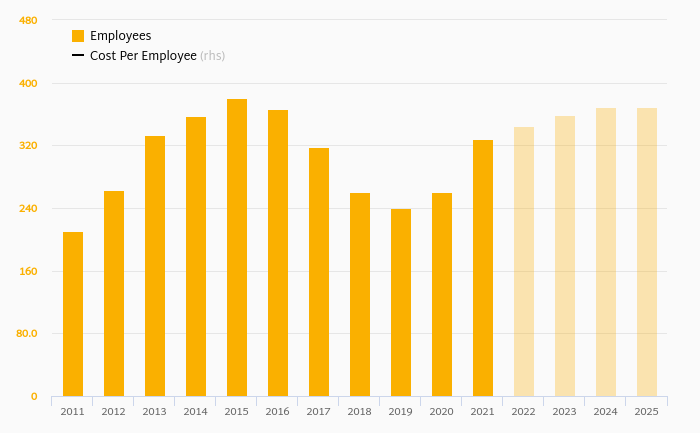
| Employees | 226 | 220 | 216 | 216 | 202 | ||||||||||
| Cost Per Employee | USD per month | 6,520 | 7,054 | 6,805 | 7,362 | 7,192 | |||||||||
| Cost Per Employee (Local Currency) | CZK per month | 124,598 | 124,765 | 133,116 | 144,043 | 153,708 | |||||||||
| Staff Cost (As % Of Total Cost) | % | 6.85 | 6.68 | 7.19 | 7.86 | 8.81 | |||||||||
| Effective Tax Rate | % | 25.2 | 38.8 | 45.3 | 25.8 | 28.6 | |||||||||
| Domestic Sales | CZK mil | ... | ... | ... | ... | ... | ... | ... | ... | ... | ... | ... | ... | ||
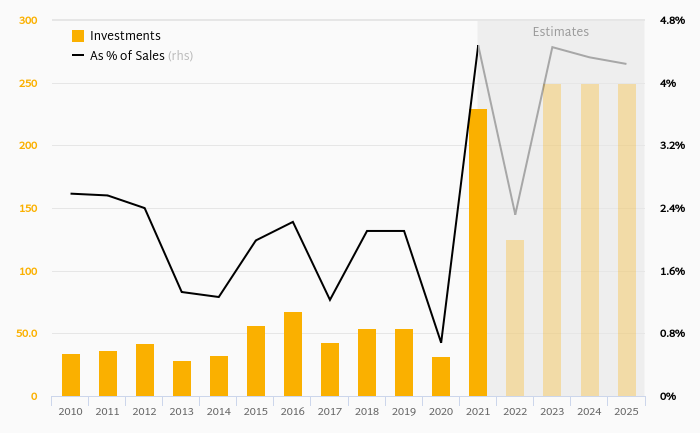
| Capital Expenditures (As % of Sales) | % | 3.22 | 1.55 | 3.38 | 2.90 | 3.02 | |||||||||
| Revenues From Abroad | CZK mil | ... | ... | ... | ... | ... | ... | ... | ... | ... | ... | ... | 265 | ||
| Revenues From Abroad (As % Of Total) | % | ... | ... | ... | ... | ... | ... | ... | ... | ... | ... | ... | 6.08 | ||
| Sales of Pharmaceutical Products & Medical Devices | CZK mil | 4,729 | 4,686 | 4,568 | 4,606 | 4,086 | |||||||||
| Sales from Reinvoicing & Services | CZK mil | 344 | 326 | 301 | 328 | 278 | |||||||||
| Sales from Pharmaceuticals Division | CZK mil | ... | 3,721 | 3,630 | 3,533 | 3,806 | 3,192 | ... | ... | ||||||
| Sales from Diagnostics & Diabetes Care Division | CZK mil | ... | 1,009 | 1,082 | 1,035 | 1,128 | 1,172 | ... | ... |
Get all company financials in excel:


Roche, s.r.o. is a Czech Republic-based subsidiary of the Swiss global health-care company F. Hoffmann-La Roche Ltd (or Roche Holding AG as it is listed on the SIX Swiss Exchange). Roche operates worldwide under two divisions: Pharmaceuticals and Diagnostics. The Company headquarters are located in Basel and the Company has some 26 manufacturing sites worldwide. Roche's revenues during fiscal year 2013 were CHF 46.8 bil and the Company was the fifth-largest pharma company worldwide. Descendants of the founding Hoffmann and Oeri families own slightly over half of the bearer shares with voting rights (a pool of family shareholders 45%, and Maja Oeri a further 5% apart), with Swiss pharma firm Novartis owning a further third of its shares.

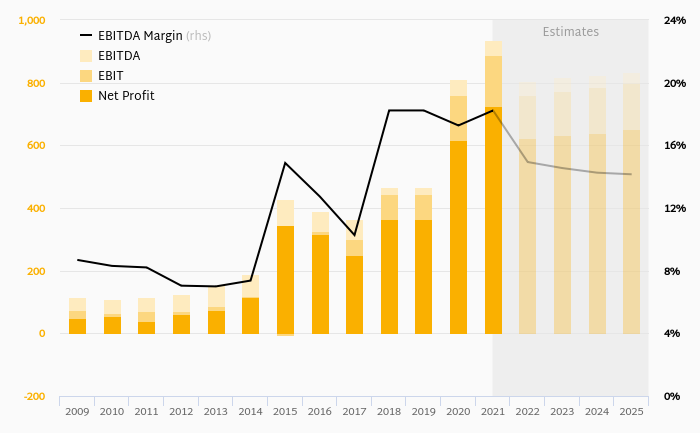
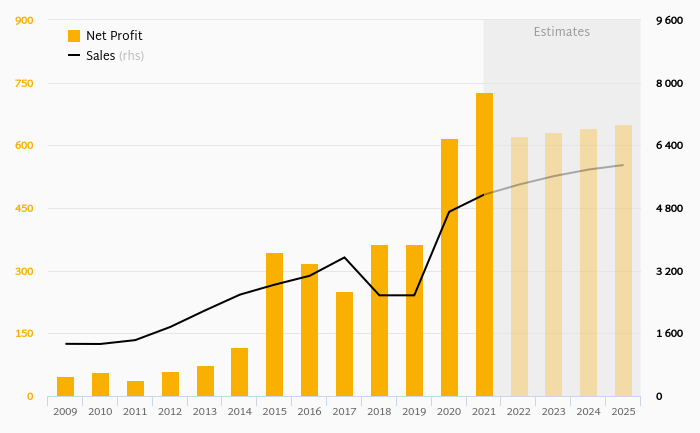
Roche Czech Republic has been growing its sales by a year on average in the last 5 years. EBITDA has grown on average by 18% a year during that time to total of CZK 475 mil in 2016, or 9.57% of sales. That’s compared to 6.07% average margin seen in last five years.
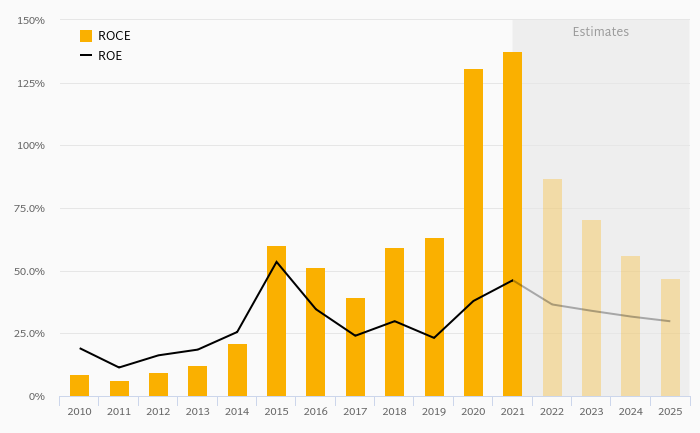
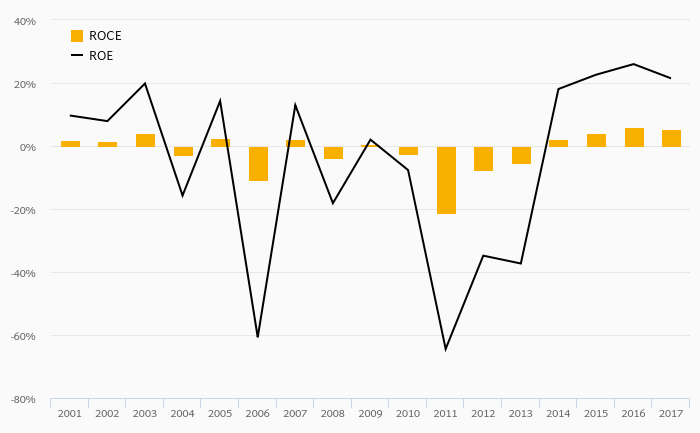
The company netted CZK 252 mil in 2016 implying ROE of 19.2% and ROCE of 12.8%. Again, the average figures were 9.34% and 6.60%, respectively when looking at the previous 5 years.
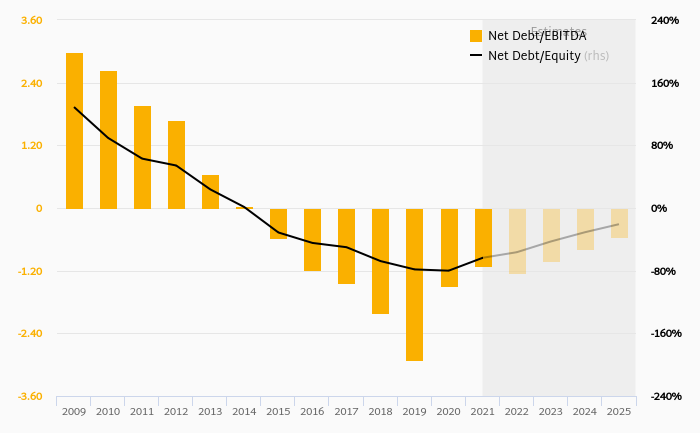
Roche Czech Republic’s net debt amounted to CZK 203 mil at the end of 2016, or 14.2% of equity. When compared to EBITDA, net debt was 0.428x, down when compared to average of 1.45x seen in the last 5 years.
 Helgi Library