By Helgi Library - November 22, 2023
Svenska Handelsbanken's mortgage loans reached SEK 864,895 mil in 1Q2016, up 2.43% compared to the previous year. Swedish banki...
By Helgi Library - November 22, 2023
Svenska Handelsbanken's mortgage loans reached SEK 864,895 mil in 1Q2016, up 2.43% compared to the previous year. Swedish banki...
By Helgi Library - November 19, 2019
Svenska Handelsbanken's customer deposits reached SEK 1,033,120 mil in 2016-03-31, up 37.0% compared to the previous year. Swed...
| Profit Statement | 2016 | 2017 | 2018 | |
| Net Interest Income | SEK mil | 28,171 | 30,357 | 31,504 |
| Net Fee Income | SEK mil | 9,156 | 9,718 | 10,247 |
| Other Income | SEK mil | 3,299 | 2,830 | 2,920 |
| Total Revenues | SEK mil | 40,626 | 42,905 | 44,671 |
| Staff Cost | SEK mil | 12,542 | 12,472 | ... |
| Operating Profit | SEK mil | 22,889 | 23,695 | 23,618 |
| Provisions | SEK mil | 1,724 | 1,683 | 881 |
| Net Profit | SEK mil | 16,244 | 16,099 | 17,354 |
| Balance Sheet | 2016 | 2017 | 2018 | |
| Interbank Loans | SEK mil | 38,840 | 26,857 | 64,744 |
| Customer Loans | SEK mil | 1,956,130 | 2,059,150 | 2,180,040 |
| Total Assets | SEK mil | 2,627,580 | 2,766,980 | 2,978,170 |
| Shareholders' Equity | SEK mil | 136,381 | 141,604 | 142,261 |
| Interbank Borrowing | SEK mil | 180,353 | 176,892 | 200,245 |
| Customer Deposits | SEK mil | 829,336 | 941,967 | 1,008,490 |
| Issued Debt Securities | SEK mil | 1,295,160 | 1,309,490 | 1,445,730 |
| Ratios | 2016 | 2017 | 2018 | |
| ROE | % | 12.3 | 11.6 | 12.2 |
| ROA | % | 0.631 | 0.597 | 0.604 |
| Costs (As % Of Assets) | % | 0.689 | 0.712 | 0.733 |
| Costs (As % Of Income) | % | 43.7 | 44.8 | 47.1 |
| Capital Adequacy Ratio | % | 31.4 | 28.3 | 21.0 |
| Net Interest Margin | % | 1.09 | 1.13 | 1.10 |
| Loans (As % Of Deposits) | % | 236 | 219 | 216 |
| NPLs (As % Of Loans) | % | 0.395 | 0.385 | 0.354 |
| Provisions (As % Of NPLs) | % | 59.9 | 64.9 | 49.2 |
| Valuation | 2016 | 2017 | 2018 | |
| Price/Earnings (P/E) | 15.2 | 13.5 | 11.0 | |
| Price/Book Value (P/BV) | 1.80 | 1.54 | 1.34 | |
| Dividend Yield | % | 3.95 | 4.90 | 5.60 |
| Earnings Per Share (EPS) | 8.23 | 8.15 | 8.79 | |
| Book Value Per Share | 69.1 | 71.7 | 72.0 | |
| Dividend Per Share | 4.93 | 5.42 | 5.42 | |
Get all company financials in excel:
| summary | Unit | 1988 | 1989 | 1990 | 1991 | 1992 | 1993 | 1994 | 1995 | 1996 | 1997 | 1998 | 1999 | 2000 | 2001 | 2002 | 2003 | 2004 | 2005 | 2006 | 2007 | 2008 | 2009 | 2010 | 2011 | 2012 | 2013 | 2014 | 2015 | 2016 | 2017 | 2018 |
| income statement | ||||||||||||||||||||||||||||||||
| Net Interest Income | SEK mil | 26,233 | 26,830 | 27,495 | 28,021 | 28,171 | ||||||||||||||||||||||||||
| Total Revenues | SEK mil | 36,435 | 37,808 | 39,883 | 41,974 | 40,626 | ||||||||||||||||||||||||||
| Operating Profit | SEK mil | 19,741 | 20,759 | 22,559 | 23,720 | 22,889 | ||||||||||||||||||||||||||
| Net Profit | SEK mil | 14,037 | 14,295 | 15,183 | 16,342 | 16,244 | ||||||||||||||||||||||||||
| balance sheet | ||||||||||||||||||||||||||||||||
| Interbank Loans | SEK mil | 123,310 | 78,609 | 94,197 | 57,398 | 38,840 | ||||||||||||||||||||||||||
| Customer Loans | SEK mil | 1,646,680 | 1,680,630 | 1,783,980 | 1,858,720 | 1,956,130 | ||||||||||||||||||||||||||
| Debt Securities | SEK mil | 147,406 | 170,171 | 188,490 | 149,677 | 181,526 | ||||||||||||||||||||||||||
| Total Assets | SEK mil | 2,383,950 | 2,484,720 | 2,816,680 | 2,522,130 | 2,627,580 | ||||||||||||||||||||||||||
| Shareholders' Equity | SEK mil | 103,850 | 111,339 | 126,827 | 128,268 | 136,381 | ||||||||||||||||||||||||||
| Interbank Borrowing | SEK mil | 212,440 | 202,073 | 220,890 | 166,186 | 180,353 | ||||||||||||||||||||||||||
| Customer Deposits | SEK mil | 669,929 | 817,601 | 1,022,100 | 753,855 | 829,336 | ||||||||||||||||||||||||||
| Issued Debt Securities | SEK mil | 1,172,590 | 1,166,610 | 1,242,900 | 1,279,580 | 1,295,160 | ||||||||||||||||||||||||||
| ratios | ||||||||||||||||||||||||||||||||
| ROE | % | 14.2 | 13.3 | 12.7 | 12.8 | 12.3 | ||||||||||||||||||||||||||
| ROA | % | 0.580 | 0.587 | 0.573 | 0.612 | 0.631 | ||||||||||||||||||||||||||
| Costs (As % Of Assets) | % | 0.690 | 0.700 | 0.654 | 0.684 | 0.689 | ||||||||||||||||||||||||||
| Costs (As % Of Income) | % | 45.8 | 45.1 | 43.4 | 43.5 | 43.7 | ||||||||||||||||||||||||||
| Capital Adequacy Ratio | % | 20.7 | 21.6 | 25.6 | 27.2 | 31.4 | ||||||||||||||||||||||||||
| Net Interest Margin | % | 1.08 | 1.10 | 1.04 | 1.05 | 1.09 | ||||||||||||||||||||||||||
| Interest Income (As % Of Revenues) | % | 72.0 | 71.0 | 68.9 | 66.8 | 69.3 | ||||||||||||||||||||||||||
| Fee Income (As % Of Revenues) | % | 20.2 | 20.6 | 21.5 | 22.2 | 22.5 | ||||||||||||||||||||||||||
| Staff Cost (As % Of Total Cost) | % | ... | ... | ... | ... | ... | ... | ... | ... | ... | ... | ... | ... | ... | ... | ... | ... | ... | ... | 66.9 | 66.9 | 67.9 | 68.9 | 70.7 | ... | |||||||
| Equity (As % Of Assets) | % | 4.36 | 4.48 | 4.50 | 5.09 | 5.19 | ||||||||||||||||||||||||||
| Loans (As % Of Deposits) | % | 246 | 206 | 175 | 247 | 236 | ||||||||||||||||||||||||||
| Loans (As % Assets) | % | 69.1 | 67.6 | 63.3 | 73.7 | 74.4 | ||||||||||||||||||||||||||
| NPLs (As % Of Loans) | % | ... | ... | ... | ... | ... | ... | 0.444 | 0.412 | 0.487 | 0.475 | 0.395 | ||||||||||||||||||||
| Provisions (As % Of NPLs) | % | ... | ... | ... | ... | ... | ... | 56.4 | 56.2 | 47.2 | 54.5 | 59.9 | ||||||||||||||||||||
| valuation | ||||||||||||||||||||||||||||||||
| Market Capitalisation (End Of Period) | USD mil | ... | ... | ... | ... | ... | ... | 22,611 | 31,260 | 29,873 | 25,508 | 27,160 | ||||||||||||||||||||
| Number Of Shares (Average) | mil | 1,950 | 1,943 | 1,959 | 1,972 | 1,973 | ||||||||||||||||||||||||||
| Share Price (End Of Period) | ... | ... | ... | ... | ... | ... | 75.4 | 103 | 119 | 109 | 125 | |||||||||||||||||||||
| Earnings Per Share (EPS) | 7.20 | 7.36 | 7.75 | 8.29 | 8.23 | |||||||||||||||||||||||||||
| Book Value Per Share | 53.3 | 57.3 | 64.7 | 65.0 | 69.1 | |||||||||||||||||||||||||||
| Dividend Per Share | 3.49 | 5.40 | 5.68 | 5.80 | 4.93 | |||||||||||||||||||||||||||
| Price/Earnings (P/E) | ... | ... | ... | ... | ... | ... | 10.5 | 14.1 | 15.3 | 13.2 | 15.2 | |||||||||||||||||||||
| Price/Book Value (P/BV) | ... | ... | ... | ... | ... | ... | 1.42 | 1.80 | 1.84 | 1.68 | 1.80 | |||||||||||||||||||||
| Dividend Yield | % | ... | ... | ... | ... | ... | ... | 4.63 | 5.22 | 4.77 | 5.31 | 3.95 | ||||||||||||||||||||
| Earnings Per Share Growth | % | ... | 12.6 | 2.22 | 5.32 | 6.93 | -0.640 | |||||||||||||||||||||||||
| Book Value Per Share Growth | % | ... | 8.60 | 7.61 | 13.0 | 0.475 | 6.28 |
| income statement | Unit | 1988 | 1989 | 1990 | 1991 | 1992 | 1993 | 1994 | 1995 | 1996 | 1997 | 1998 | 1999 | 2000 | 2001 | 2002 | 2003 | 2004 | 2005 | 2006 | 2007 | 2008 | 2009 | 2010 | 2011 | 2012 | 2013 | 2014 | 2015 | 2016 | 2017 | 2018 |
| income statement | ||||||||||||||||||||||||||||||||
| Interest Income | SEK mil | 62,966 | 54,624 | 51,150 | 43,333 | 40,178 | ||||||||||||||||||||||||||
| Interest Cost | SEK mil | 36,733 | 27,794 | 23,655 | 15,312 | 12,007 | ||||||||||||||||||||||||||
| Net Interest Income | SEK mil | 26,233 | 26,830 | 27,495 | 28,021 | 28,171 | ||||||||||||||||||||||||||
| Net Fee Income | SEK mil | 7,369 | 7,804 | 8,556 | 9,320 | 9,156 | ||||||||||||||||||||||||||
| Other Income | SEK mil | 2,833 | 3,174 | 3,832 | 4,633 | 3,299 | ||||||||||||||||||||||||||
| Total Revenues | SEK mil | 36,435 | 37,808 | 39,883 | 41,974 | 40,626 | ||||||||||||||||||||||||||
| Staff Cost | SEK mil | ... | ... | ... | ... | ... | ... | ... | ... | ... | ... | ... | ... | ... | ... | ... | ... | ... | ... | 11,167 | 11,404 | 11,766 | 12,581 | 12,542 | ... | |||||||
| Depreciation | SEK mil | ... | ... | ... | ... | ... | ... | ... | ... | ... | ... | ... | ... | ... | ... | ... | ... | ... | ... | 464 | 476 | 462 | 487 | 495 | ... | |||||||
| Other Cost | SEK mil | ... | ... | ... | ... | ... | ... | ... | ... | ... | ... | ... | ... | ... | ... | ... | ... | ... | ... | 5,063 | 5,169 | 5,096 | 5,186 | 4,700 | ... | |||||||
| Operating Cost | SEK mil | 16,694 | 17,049 | 17,324 | 18,254 | 17,737 | ||||||||||||||||||||||||||
| Operating Profit | SEK mil | 19,741 | 20,759 | 22,559 | 23,720 | 22,889 | ||||||||||||||||||||||||||
| Provisions | SEK mil | 1,251 | 1,195 | 1,781 | 1,597 | 1,724 | ||||||||||||||||||||||||||
| Extra and Other Cost | SEK mil | 1,382 | 1,476 | 1,566 | 1,648 | 532 | ||||||||||||||||||||||||||
| Pre-Tax Profit | SEK mil | 17,108 | 18,088 | 19,212 | 20,475 | 20,633 | ||||||||||||||||||||||||||
| Tax | SEK mil | 3,092 | 3,915 | 4,069 | 4,277 | 4,401 | ||||||||||||||||||||||||||
| Minorities | SEK mil | 1.00 | 0 | 1.00 | 1.00 | 1.00 | ||||||||||||||||||||||||||
| Net Profit | SEK mil | 14,037 | 14,295 | 15,183 | 16,342 | 16,244 | ||||||||||||||||||||||||||
| Dividends | SEK mil | 6,804 | 10,488 | 11,124 | 11,442 | 9,721 | ||||||||||||||||||||||||||
| growth rates | ||||||||||||||||||||||||||||||||
| Net Interest Income Growth | % | ... | 10.4 | 2.28 | 2.48 | 1.91 | 0.535 | |||||||||||||||||||||||||
| Net Fee Income Growth | % | ... | -3.96 | 5.90 | 9.64 | 8.93 | -1.76 | |||||||||||||||||||||||||
| Total Revenue Growth | % | ... | 6.84 | 3.77 | 5.49 | 5.24 | -3.21 | |||||||||||||||||||||||||
| Operating Cost Growth | % | ... | 7.97 | 2.13 | 1.61 | 5.37 | -2.83 | |||||||||||||||||||||||||
| Operating Profit Growth | % | ... | 5.90 | 5.16 | 8.67 | 5.15 | -3.50 | |||||||||||||||||||||||||
| Pre-Tax Profit Growth | % | ... | 3.46 | 5.73 | 6.21 | 6.57 | 0.772 | |||||||||||||||||||||||||
| Net Profit Growth | % | ... | 13.9 | 1.84 | 6.21 | 7.63 | -0.600 | |||||||||||||||||||||||||
| market share | ||||||||||||||||||||||||||||||||
| Market Share in Revenues | % | ... | ... | ... | ... | ... | ... | ... | ... | ... | ... | ... | ... | ... | ... | ... | ... | ... | ... | ... | ||||||||||||
| Market Share in Net Profit | % | ... | 23.7 | 20.0 | 17.3 | 21.2 | ... | ... | ... | |||||||||||||||||||||||
| Market Share in Employees | % | ... | ... | ... | ... | ... | ... | ... | ... | ... | ... | ... | ... | ... | ... | ... | ... | ... | ... | ... |
| balance sheet | Unit | 1988 | 1989 | 1990 | 1991 | 1992 | 1993 | 1994 | 1995 | 1996 | 1997 | 1998 | 1999 | 2000 | 2001 | 2002 | 2003 | 2004 | 2005 | 2006 | 2007 | 2008 | 2009 | 2010 | 2011 | 2012 | 2013 | 2014 | 2015 | 2016 | 2017 | 2018 |
| balance sheet | ||||||||||||||||||||||||||||||||
| Cash | SEK mil | 248,915 | 369,954 | 505,579 | 236,748 | 224,889 | ||||||||||||||||||||||||||
| Interbank Loans | SEK mil | 123,310 | 78,609 | 94,197 | 57,398 | 38,840 | ||||||||||||||||||||||||||
| Customer Loans | SEK mil | 1,646,680 | 1,680,630 | 1,783,980 | 1,858,720 | 1,956,130 | ||||||||||||||||||||||||||
| Mortgage Loans | SEK mil | ... | ... | ... | ... | ... | ... | ... | ... | ... | ... | ... | ... | ... | ... | ... | ... | ... | ... | 674,194 | 719,920 | 783,054 | 844,359 | 920,213 | ||||||||
| Consumer Loans | SEK mil | ... | ... | ... | ... | ... | ... | ... | ... | ... | ... | ... | ... | ... | ... | ... | ... | ... | ... | 69,260 | 68,575 | 69,412 | 68,158 | 62,427 | ||||||||
| Corporate Loans | SEK mil | ... | ... | ... | ... | ... | ... | ... | ... | ... | ... | 827,969 | 814,855 | 862,648 | 861,027 | 893,671 | ||||||||||||||||
| Debt Securities | SEK mil | 147,406 | 170,171 | 188,490 | 149,677 | 181,526 | ||||||||||||||||||||||||||
| Fixed Assets | SEK mil | 9,415 | 10,040 | 10,371 | 10,602 | 11,780 | ||||||||||||||||||||||||||
| Total Assets | SEK mil | 2,383,950 | 2,484,720 | 2,816,680 | 2,522,130 | 2,627,580 | ||||||||||||||||||||||||||
| Shareholders' Equity | SEK mil | 103,850 | 111,339 | 126,827 | 128,268 | 136,381 | ||||||||||||||||||||||||||
| Of Which Minority Interest | SEK mil | 2.00 | 2.00 | 3.00 | 4.00 | 6.00 | ||||||||||||||||||||||||||
| Liabilities | SEK mil | 2,280,100 | 2,373,380 | 2,689,850 | 2,393,860 | 2,491,200 | ||||||||||||||||||||||||||
| Interbank Borrowing | SEK mil | 212,440 | 202,073 | 220,890 | 166,186 | 180,353 | ||||||||||||||||||||||||||
| Customer Deposits | SEK mil | 669,929 | 817,601 | 1,022,100 | 753,855 | 829,336 | ||||||||||||||||||||||||||
| Retail Deposits | SEK mil | ... | ... | ... | ... | ... | ... | ... | ... | ... | ... | ... | ... | ... | ... | ... | ... | ... | ... | 267,450 | 287,319 | 318,750 | 356,432 | 404,112 | ... | |||||||
| Corporate Deposits | SEK mil | ... | ... | ... | ... | ... | ... | ... | ... | ... | ... | ... | ... | ... | ... | ... | ... | ... | ... | 598,718 | 709,510 | 903,591 | 561,193 | 604,005 | ... | |||||||
| Sight Deposits | SEK mil | 515,826 | 591,646 | 703,632 | 689,373 | 775,803 | ||||||||||||||||||||||||||
| Term Deposits | SEK mil | 154,103 | 225,955 | 318,467 | 64,482 | 53,533 | ||||||||||||||||||||||||||
| Issued Debt Securities | SEK mil | 1,172,590 | 1,166,610 | 1,242,900 | 1,279,580 | 1,295,160 | ||||||||||||||||||||||||||
| Other Liabilities | SEK mil | 225,139 | 187,102 | 203,958 | 194,241 | 186,345 | ||||||||||||||||||||||||||
| asset quality | ||||||||||||||||||||||||||||||||
| Non-Performing Loans | SEK mil | ... | ... | ... | ... | ... | ... | 7,325 | 6,944 | 8,702 | 8,844 | 7,746 | ||||||||||||||||||||
| Gross Loans | SEK mil | 1,650,810 | 1,684,530 | 1,788,090 | 1,863,540 | 1,960,770 | ||||||||||||||||||||||||||
| Provisions | SEK mil | 1,251 | 1,195 | 1,781 | 1,597 | 1,724 | ||||||||||||||||||||||||||
| growth rates | ||||||||||||||||||||||||||||||||
| Customer Loan Growth | % | ... | 4.39 | 2.06 | 6.15 | 4.19 | 5.24 | |||||||||||||||||||||||||
| Retail Loan Growth | % | ... | ... | ... | ... | ... | ... | ... | ... | ... | ... | ... | 4.25 | 6.06 | 8.11 | 7.04 | 7.68 | |||||||||||||||
| Mortgage Loan Growth | % | ... | ... | ... | ... | ... | ... | ... | ... | ... | ... | ... | ... | ... | ... | ... | ... | ... | ... | ... | 4.40 | 6.78 | 8.77 | 7.83 | 8.98 | |||||||
| Consumer Loan Growth | % | ... | ... | ... | ... | ... | ... | ... | ... | ... | ... | ... | ... | ... | ... | ... | ... | ... | ... | ... | 2.83 | -0.989 | 1.22 | -1.81 | -8.41 | |||||||
| Corporate Loan Growth | % | ... | ... | ... | ... | ... | ... | ... | ... | ... | ... | ... | 6.96 | -1.58 | 5.87 | -0.188 | 3.79 | |||||||||||||||
| Total Asset Growth | % | ... | -2.87 | 4.23 | 13.4 | -10.5 | 4.18 | |||||||||||||||||||||||||
| Shareholders' Equity Growth | % | ... | 9.87 | 7.21 | 13.9 | 1.14 | 6.33 | |||||||||||||||||||||||||
| Customer Deposit Growth | % | ... | -6.55 | 22.0 | 25.0 | -26.2 | 10.0 | |||||||||||||||||||||||||
| Retail Deposit Growth | % | ... | ... | ... | ... | ... | ... | ... | ... | ... | ... | ... | ... | ... | ... | ... | ... | ... | ... | ... | 4.50 | 7.43 | 10.9 | 11.8 | 13.4 | ... | ||||||
| Corporate Deposit Growth | % | ... | ... | ... | ... | ... | ... | ... | ... | ... | ... | ... | ... | ... | ... | ... | ... | ... | ... | ... | 27.7 | 18.5 | 27.4 | -37.9 | 7.63 | ... | ||||||
| market share | ||||||||||||||||||||||||||||||||
| Market Share in Customer Loans | % | ... | ... | ... | ... | ... | ... | ... | ... | ... | ... | ... | ... | ... | ... | ... | ... | ... | ... | ... | ||||||||||||
| Market Share in Corporate Loans | % | ... | ... | ... | ... | ... | ... | ... | ... | ... | ... | ... | ... | ... | ... | ... | ... | ... | ... | ... | ... | ... | ... | ... | ... | ... | ... | ... | ... | ... | ||
| Market Share in Consumer Loans | % | ... | ... | ... | ... | ... | ... | ... | ... | ... | ... | ... | ... | ... | ... | ... | ... | ... | ... | ... | ... | ... | ... | ... | ... | ... | ... | ... | ... | ... | ||
| Market Share in Total Assets | % | ... | ... | ... | ... | ... | ... | ... | ... | ... | ... | ... | ... | ... | ... | ... | ... | ... | ... | ... | ||||||||||||
| Market Share in Customer Deposits | % | ... | ... | ... | ... | ... | ... | ... | ... | ... | ... | ... | ... | ... | ... | ... | ... | ... | ... | ... |
| ratios | Unit | 1988 | 1989 | 1990 | 1991 | 1992 | 1993 | 1994 | 1995 | 1996 | 1997 | 1998 | 1999 | 2000 | 2001 | 2002 | 2003 | 2004 | 2005 | 2006 | 2007 | 2008 | 2009 | 2010 | 2011 | 2012 | 2013 | 2014 | 2015 | 2016 | 2017 | 2018 |
| ratios | ||||||||||||||||||||||||||||||||
| ROE | % | 14.2 | 13.3 | 12.7 | 12.8 | 12.3 | ||||||||||||||||||||||||||
| ROA | % | 0.580 | 0.587 | 0.573 | 0.612 | 0.631 | ||||||||||||||||||||||||||
| Costs (As % Of Assets) | % | 0.690 | 0.700 | 0.654 | 0.684 | 0.689 | ||||||||||||||||||||||||||
| Costs (As % Of Income) | % | 45.8 | 45.1 | 43.4 | 43.5 | 43.7 | ||||||||||||||||||||||||||
| Capital Adequacy Ratio | % | 20.7 | 21.6 | 25.6 | 27.2 | 31.4 | ||||||||||||||||||||||||||
| Tier 1 Ratio | % | ... | ... | ... | ... | ... | ... | 20.4 | 21.0 | 22.1 | 23.8 | 27.9 | ||||||||||||||||||||
| Net Interest Margin | % | 1.08 | 1.10 | 1.04 | 1.05 | 1.09 | ||||||||||||||||||||||||||
| Interest Spread | % | ... | 1.02 | 1.05 | 0.995 | 1.02 | 1.07 | |||||||||||||||||||||||||
| Asset Yield | % | 2.60 | 2.24 | 1.93 | 1.62 | 1.56 | ||||||||||||||||||||||||||
| Cost Of Liabilities | % | ... | 1.58 | 1.19 | 0.934 | 0.602 | 0.492 | |||||||||||||||||||||||||
| Payout Ratio | % | 48.5 | 73.4 | 73.3 | 70.0 | 59.8 | ||||||||||||||||||||||||||
| Interest Income (As % Of Revenues) | % | 72.0 | 71.0 | 68.9 | 66.8 | 69.3 | ||||||||||||||||||||||||||
| Fee Income (As % Of Revenues) | % | 20.2 | 20.6 | 21.5 | 22.2 | 22.5 | ||||||||||||||||||||||||||
| Other Income (As % Of Revenues) | % | 7.78 | 8.40 | 9.61 | 11.0 | 8.12 | ||||||||||||||||||||||||||
| Cost Per Employee | USD per month | ... | ... | ... | ... | ... | ... | ... | ... | ... | ... | ... | ... | ... | ... | ... | ... | ... | ... | 12,277 | 12,667 | 11,789 | 10,923 | 10,156 | ... | |||||||
| Cost Per Employee (Local Currency) | SEK per month | ... | ... | ... | ... | ... | ... | ... | ... | ... | ... | ... | ... | ... | ... | ... | ... | ... | ... | 83,147 | 82,616 | 83,861 | 88,706 | 88,882 | ... | |||||||
| Staff Cost (As % Of Total Cost) | % | ... | ... | ... | ... | ... | ... | ... | ... | ... | ... | ... | ... | ... | ... | ... | ... | ... | ... | 66.9 | 66.9 | 67.9 | 68.9 | 70.7 | ... | |||||||
| Equity (As % Of Assets) | % | 4.36 | 4.48 | 4.50 | 5.09 | 5.19 | ||||||||||||||||||||||||||
| Loans (As % Of Deposits) | % | 246 | 206 | 175 | 247 | 236 | ||||||||||||||||||||||||||
| Loans (As % Assets) | % | 69.1 | 67.6 | 63.3 | 73.7 | 74.4 | ||||||||||||||||||||||||||
| NPLs (As % Of Loans) | % | ... | ... | ... | ... | ... | ... | 0.444 | 0.412 | 0.487 | 0.475 | 0.395 | ||||||||||||||||||||
| Provisions (As % Of NPLs) | % | ... | ... | ... | ... | ... | ... | 56.4 | 56.2 | 47.2 | 54.5 | 59.9 | ||||||||||||||||||||
| Provisions (As % Of Loans) | % | ... | ... | ... | ... | ... | 0.251 | 0.232 | 0.230 | 0.259 | 0.237 | |||||||||||||||||||||
| Cost of Provisions (As % Of Loans) | % | 0.078 | 0.072 | 0.103 | 0.088 | 0.090 |
| other data | Unit | 1988 | 1989 | 1990 | 1991 | 1992 | 1993 | 1994 | 1995 | 1996 | 1997 | 1998 | 1999 | 2000 | 2001 | 2002 | 2003 | 2004 | 2005 | 2006 | 2007 | 2008 | 2009 | 2010 | 2011 | 2012 | 2013 | 2014 | 2015 | 2016 | 2017 | 2018 |
| other data | ||||||||||||||||||||||||||||||||
| Branches | ... | ... | ... | ... | ... | ... | ... | ... | ... | ... | ... | ... | ... | ... | ... | ... | ... | ... | 786 | 822 | 846 | 861 | 832 | ... | ||||||||
| Employees | 11,192 | 11,503 | 11,692 | 11,819 | 11,759 | |||||||||||||||||||||||||||
| Sight (As % Of Customer Deposits) | % | 77.0 | 72.4 | 68.8 | 91.4 | 93.5 |
Get all company financials in excel:


By Helgi Library - November 19, 2019
Svenska Handelsbanken's customer deposits reached SEK 1,033,120 mil in 2016-03-31, up 37.0% compared to the previous year. Swedish banking sector accepted customer deposits of SEK 3,955 bil in 2016-03-31, up 11.0% when compared to the last year. Svenska H...
By Helgi Library - November 19, 2019
Svenska Handelsbanken's loans reached SEK 2,289,280 mil in the third quarter of 2019, up from SEK 2,271,420 mil when compared to the previous quarter and up from SEK 2,189,020 mil when compared to the same period of last year. Historically, the bank�...
By Helgi Library - November 19, 2019
Svenska Handelsbanken's loans reached SEK 2,289,280 mil in the third quarter of 2019, up from SEK 2,271,420 mil when compared to the previous quarter and up from SEK 2,189,020 mil when compared to the same period of last year. Historically, the bank�...
By Helgi Library - November 19, 2019
Svenska Handelsbanken stock traded at 92.0 per share at the end of third quarter of 2019 implying a market capitalization of USD 18,524 mil. Over the last five years, the stock has depreciated by 15.9 implying an annual average growth of -3.41% In absolute...
By Helgi Library - November 19, 2019
Svenska Handelsbanken stock traded at 92.0 per share at the end of third quarter of 2019 implying a market capitalization of USD 18,524 mil. Over the last five years, the stock has depreciated by 15.9 implying an annual average growth of -3.41% In absolute...
By Helgi Library - November 19, 2019
Svenska Handelsbanken's non-performing loans reached 0.370% of total loans at the end of 2019-09-30, up from 0.360% compared to the previous year. Historically, the NPL ratio hit an all time high of 0.619% in 2010-12-31 and an all time low of 0.333% in 2014-06-30...
By Helgi Library - November 19, 2019
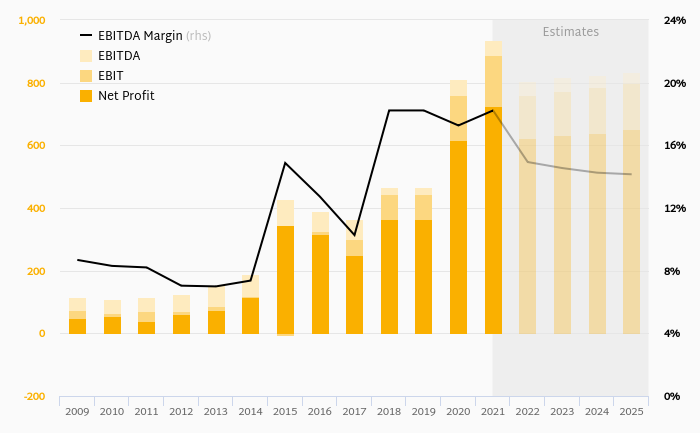
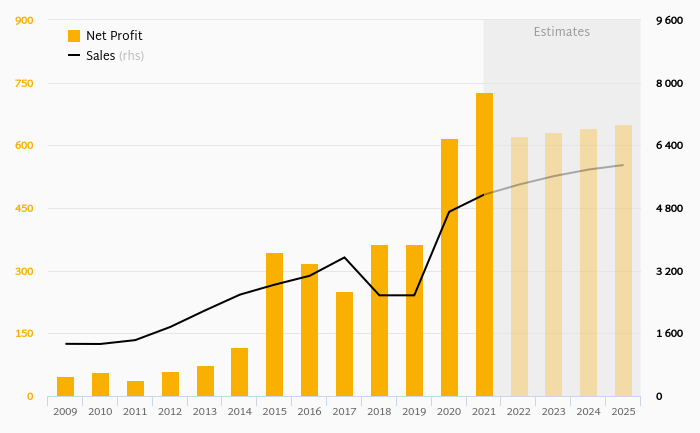
Svenska Handelsbanken made a net profit of SEK 3,570 mil under revenues of SEK 11,551 mil in the third quarter of 2019, down 13% and up 3.34% respectively when compared to the same period last year. Historically, the bank’s net profit reached an all time ...
By Helgi Library - November 19, 2019
Svenska Handelsbanken made a net profit of SEK 3,570 mil under revenues of SEK 11,551 mil in the third quarter of 2019, down 13% and up 3.34% respectively when compared to the same period last year. Historically, the bank’s net profit reached an all time ...
By Helgi Library - November 19, 2019
Svenska Handelsbanken's net interest margin amounted to 1.02% in the third quarter of 2019, down from 1.04% when compared to the previous quarter. Historically, the bank’s net interest margin reached an all time high of 1.16% in 4Q2017 and an all time low of...

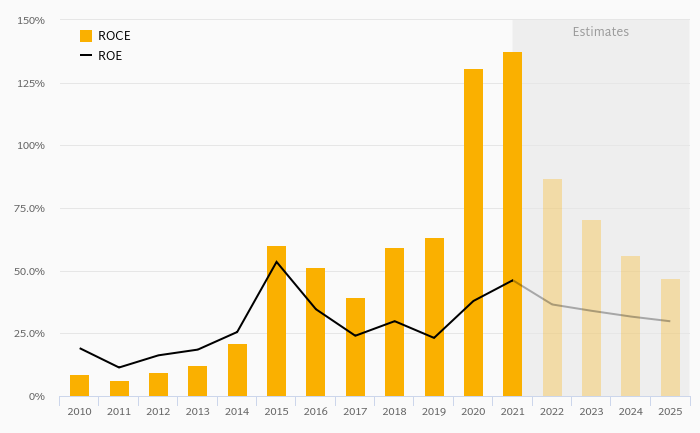
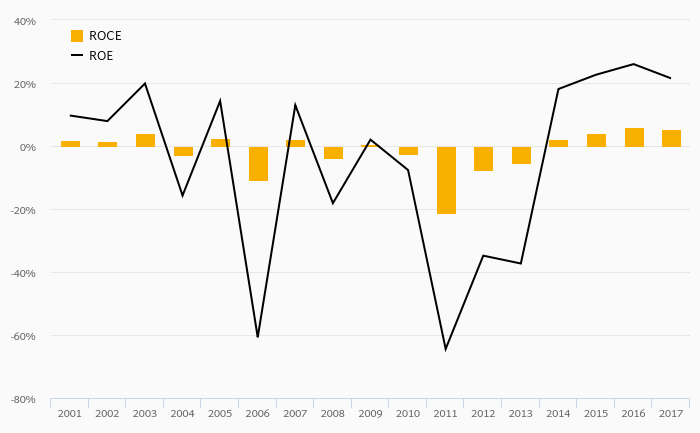
Svenska Handelsbanken has been growing its revenues and asset by 3.71% and 3.27% a year on average in the last 10 years. Its loans and deposits have grown by 3.97% and 6.49% a year during that time and loans to deposits ratio reached 216% at the end of 2018. The company achieved an average return on equity of 12.8% in the last decade with net profit growing 3.65% a year on average. In terms of operating efficiency, its cost to income ratio reached 47.1% in 2018, compared to 45.0% average in the last decade.
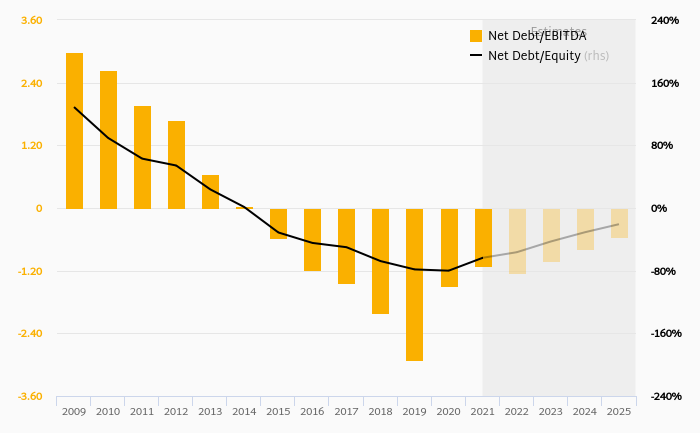
Equity represented 4.78% of total assets or 6.53% of loans at the end of 2018. Svenska Handelsbanken's non-performing loans were 0.354% of total loans while provisions covered some 49.2% of NPLs at the end of 2018.
Svenska Handelsbanken stock traded at 96.8 per share at the end of 2018 resulting in a market capitalization of USD 21,339 mil. Over the previous five years, stock price fell by 6.4% or 1.31% a year on average. That’s compared to an average ROE of 12.3% the bank generated for its shareholders. This closing price put stock at a 12-month trailing price to earnings (PE) of 11.0x and price to book value (PBV) of 1.34x in 2018.
 Helgi Library