
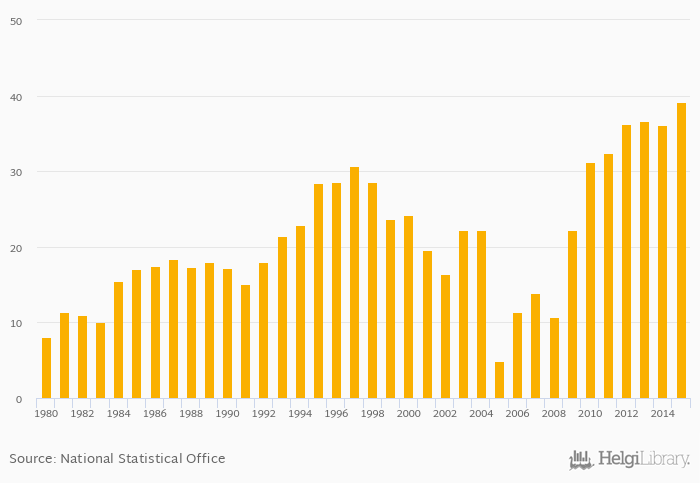
Bank assets as a share of GDP rose 8.20% to 39.1% in Zimbabwe in 2015, according to the National Central Bank.
Historically, bank assets as a share of GDP in Zimbabwe reached an all time high of 39.1% in 2015 and an all time low of 4.93% in 2005. When compared to Zimbabwe's main peers, bank assets as a share of GDP in Botswana amounted to 52.3%, 79.6% in Mozambique, 120% in South Africa and 46.6% in Zambia in 2015.
Zimbabwe has been ranked 126th within the group of 149 countries we follow in terms of bank assets as a share of GDP, 27 places above the position seen 10 years ago.
| Bank Assets (As % of GDP) | Unit | 2001 | 2002 | 2003 | 2004 | 2005 | 2006 | 2007 | 2008 | 2009 | 2010 | 2011 | 2012 | 2013 | 2014 | 2015 | 2016 | 2017 | 2018 | 2019 | 2020 | 2021 |
| Angola | % | 57.7% | 55.4% | 43.6% | 49.2% | ... | ... | ... | ||||||||||||||
| Botswana | % | 52.3% | 48.1% | 46.6% | 46.1% | 0.055% | ||||||||||||||||
| Dem. Republic of the Congo | % | ... | ... | ... | ... | ... | ... | ... | ||||||||||||||
| Lesotho | % | 44.3% | 39.8% | 46.6% | 0.056% | 0.055% | ||||||||||||||||
| Malawi | % | 34.4% | 31.4% | 34.5% | 28.9% | 28.3% | ... | |||||||||||||||
| Mozambique | % | 79.6% | 67.0% | 63.7% | 67.6% | 69.6% | ||||||||||||||||
| Namibia | % | ... | 66.6% | 66.2% | 69.7% | 73.5% | 79.1% | |||||||||||||||
| South Africa | % | 120% | 113% | 111% | 113% | 106% | ... | |||||||||||||||
| Swaziland | % | 36.6% | 33.7% | 33.5% | 33.6% | 33.2% | ... | ... | ||||||||||||||
| Tanzania | % | 29.8% | 25.9% | 24.9% | 24.0% | 23.7% | ... | |||||||||||||||
| Zambia | % | 46.6% | 29.9% | 29.1% | 29.8% | 31.0% | ||||||||||||||||
| Zimbabwe | % | 39.1% | ... | ... | ... | ... | ... | ... |
 Helgi Library


