
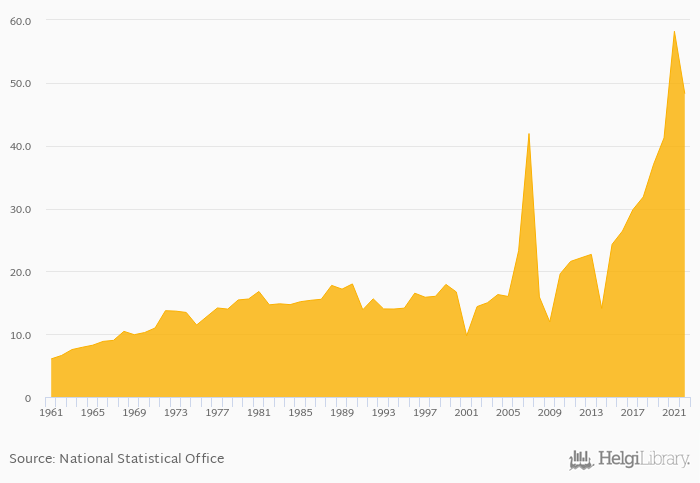
Cucumber and gherkin production fell 17.1% to 48.3 kt in Australia in 2022, according to Faostat.
Historically, cucumber and gherkin production in Australia reached an all time high of 58.2 kt in 2021 and an all time low of 6.07 kt in 1961.
Australia has been ranked 54th within the group of 122 countries we follow in terms of cucumber and gherkin production, 16 places above the position seen 10 years ago.
| Cucumber and Gherkin Production | Unit | 2002 | 2003 | 2004 | 2005 | 2006 | 2007 | 2008 | 2009 | 2010 | 2011 | 2012 | 2013 | 2014 | 2015 | 2016 | 2017 | 2018 | 2019 | 2020 | 2021 | 2022 |
| Australia | kt | 26.4 | 29.8 | 31.8 | 37.1 | 41.2 | ||||||||||||||||
| Cambodia | kt | ... | ... | ... | ... | ... | ... | ... | ... | ... | ... | ... | ... | ... | ... | ... | ... | ... | ... | ... | ... | ... |
| Indonesia | kt | 430 | 425 | 434 | 436 | 441 | ||||||||||||||||
| Malaysia | kt | 97.6 | 88.5 | 85.1 | 103 | 101 | ||||||||||||||||
| New Zealand | kt | ... | ... | 0.542 | 0.500 | 0.519 | 0.543 | 0.542 | ||||||||||||||
| Papua New Guinea | kt | ... | ... | ... | ... | ... | ... | ... | ... | ... | ... | ... | ... | ... | ... | ... | ... | ... | ... | ... | ... | ... |
| Philippines | kt | 13.1 | 13.3 | 13.4 | 13.6 | 13.5 | ||||||||||||||||
| Singapore | kt | ... | ... | ... | ... | ... | ... | ... | ... | ... | ... | ... | ... | ... | ... | ... | ... | ... | ... | |||
| Thailand | kt | 180 | 179 | 175 | 178 | 177 | ||||||||||||||||
| Vietnam | kt | ... | ... | ... | ... | ... | ... | ... | ... | ... | ... | ... | ... | ... | ... | ... | ... | ... | ... | ... | ... | ... |
 Helgi Library


