
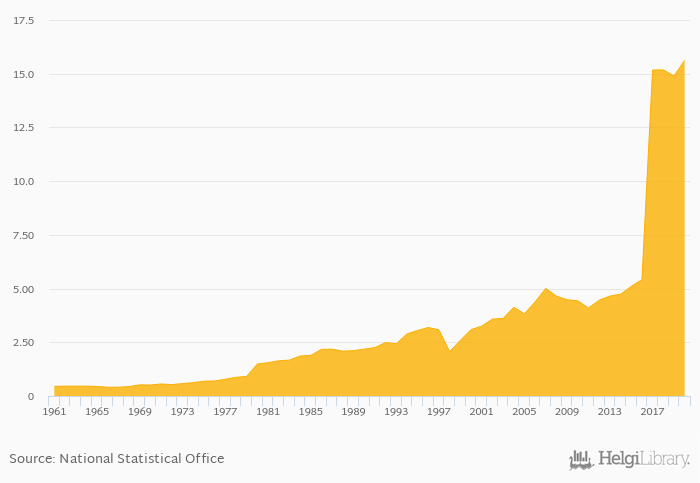
Egg consumption per capita rose 4.83% to 15.6 kg in Indonesia in 2020, according to Faostat.
Historically, egg consumption per capita in Indonesia reached an all time high of 15.6 kg in 2020 and an all time low of 0.410 kg in 1966.
Indonesia has been ranked 13th within the group of 165 countries we follow in terms of egg consumption per capita, 81 places above the position seen 10 years ago.
| Egg Consumption Per Capita | Unit | 2001 | 2002 | 2003 | 2004 | 2005 | 2006 | 2007 | 2008 | 2009 | 2010 | 2011 | 2012 | 2013 | 2014 | 2015 | 2016 | 2017 | 2018 | 2019 | 2020 | 2021 |
| Australia | kg | 7.80 | 7.97 | 8.12 | 8.34 | 8.27 | ||||||||||||||||
| Cambodia | kg | 1.23 | 1.19 | 1.22 | 1.17 | 1.15 | ||||||||||||||||
| China | kg | 20.1 | 20.7 | 20.2 | 20.3 | 21.4 | ||||||||||||||||
| Indonesia | kg | 5.08 | 5.41 | 15.2 | 15.2 | 15.0 | ||||||||||||||||
| Malaysia | kg | 18.2 | 18.9 | 18.9 | 17.4 | 13.5 | ||||||||||||||||
| New Zealand | kg | 9.98 | 10.8 | 10.6 | 10.9 | 10.9 | ||||||||||||||||
| Papua New Guinea | kg | ... | ... | ... | ... | ... | ... | ... | ... | ... | 0.550 | 0.510 | 0.540 | 0.490 | 0.530 | |||||||
| Philippines | kg | 3.98 | 4.08 | 4.26 | 4.52 | 4.85 | ||||||||||||||||
| Singapore | kg | ... | ... | ... | ... | ... | ... | ... | ... | ... | ... | ... | ... | ... | ... | ... | ... | ... | ... | ... | ... | ... |
| Taiwan | kg | ... | ... | ... | ... | ... | ... | ... | ... | |||||||||||||
| Thailand | kg | 11.8 | 11.7 | 11.7 | 11.8 | 11.8 | ||||||||||||||||
| Vietnam | kg | 4.07 | 4.29 | 2.81 | 3.13 | 3.63 |
 Helgi Library


