
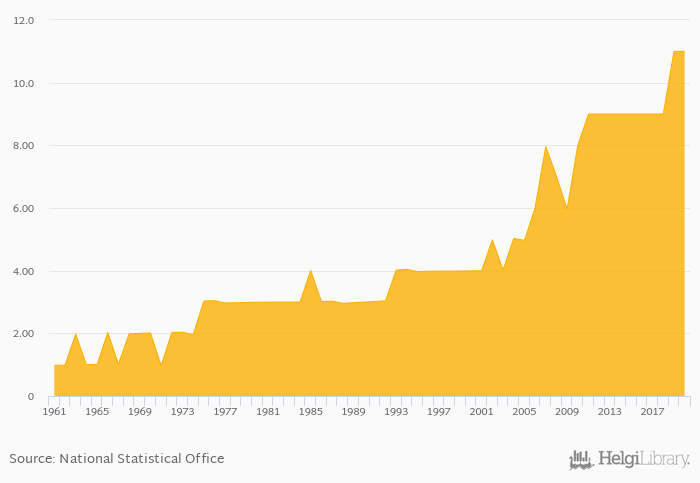
Total spice consumption rose 0% to 11.0 kt in Sweden in 2020, according to Faostat.
Historically, total spice consumption in Sweden reached an all time high of 11.0 kt in 2020 and an all time low of 0.971 kt in 1971. When compared to Sweden's main peers, total spice consumption in Denmark amounted to 13.0 kt, 3.00 kt in Finland, 3.00 kt in Norway and 38.0 kt in Russia in 2020.
Sweden has been ranked 66th within the group of 144 countries we follow in terms of total spice consumption, 1 place below the position seen 10 years ago.
| Spice Consumption (Total) | Unit | 2001 | 2002 | 2003 | 2004 | 2005 | 2006 | 2007 | 2008 | 2009 | 2010 | 2011 | 2012 | 2013 | 2014 | 2015 | 2016 | 2017 | 2018 | 2019 | 2020 | 2021 |
| Australia | kt | 20.0 | 25.0 | 20.0 | 18.0 | 18.0 | ||||||||||||||||
| China | kt | 438 | 333 | 379 | 389 | 491 | ||||||||||||||||
| Denmark | kt | 8.00 | 8.00 | 9.00 | 8.00 | 11.0 | ||||||||||||||||
| Finland | kt | 2.00 | 2.00 | 2.00 | 2.00 | 3.00 | ||||||||||||||||
| Germany | kt | 65.0 | 64.0 | 67.0 | 66.0 | 73.0 | ||||||||||||||||
| Iceland | kt | ... | ... | ... | ... | ... | ... | ... | ... | ... | ... | ... | ... | ... | ... | ... | 1.00 | 1.00 | ... | ... | ... | |
| Indonesia | kt | 392 | 394 | 427 | 448 | 495 | ||||||||||||||||
| Japan | kt | 160 | 157 | 153 | 144 | 147 | ||||||||||||||||
| Netherlands | kt | 24.0 | 23.0 | 21.0 | 22.0 | 26.0 | ||||||||||||||||
| New Zealand | kt | 5.00 | 5.00 | 5.00 | 6.00 | 5.00 | ||||||||||||||||
| Norway | kt | 2.00 | 2.00 | 2.00 | 2.00 | 3.00 | ||||||||||||||||
| Papua New Guinea | kt | ... | ... | ... | ... | ... | ... | ... | ... | ... | 1.00 | 4.00 | 9.00 | 1.00 | 1.00 | ... | ||||||
| Russia | kt | 29.0 | 55.0 | 31.0 | 31.0 | 38.0 | ||||||||||||||||
| Sweden | kt | 9.00 | 9.00 | 9.00 | 9.00 | 11.0 | ||||||||||||||||
| USA | kt | 308 | 310 | 313 | 318 | 347 |
 Helgi Library


