
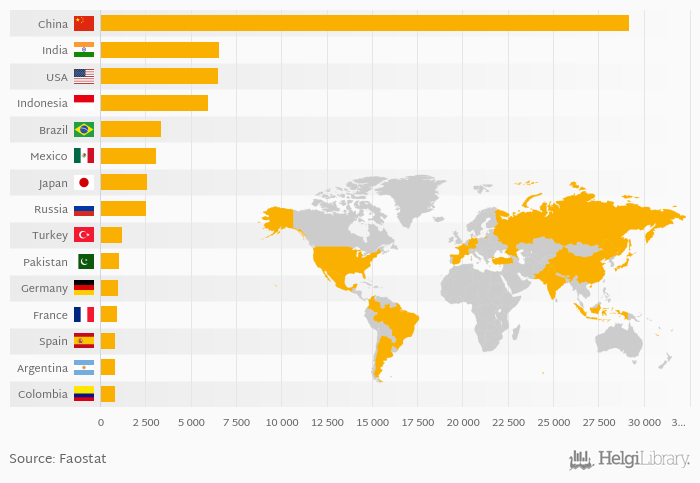
Based on a comparison of 165 countries in 2022, China ranked the highest in hen eggs production with 29,198 kt followed by India and USA. On the other end of the scale was Equatorial Guinea with 0.248 kt, Bahamas with 0.884 kt and Gambia with 0.892 kt.
Total hen eggs production reached 87,000 kt in 2022 in the World according to Faostat. This is 0.135 % less than in the previous year and 23.0 % more than 10 years ago.
Historically, total hen eggs production reached an all time high of 87,142 kt in 2020 and an all time low of 14,383 kt in 1961. The average annual growth amounted to 2.99 % since 1961.
The top ranked country, China, accounted for 33.6 % of hen eggs production in the world. The top 3 countries hold a 48.6 % share while the ten largest countries some 71.4 % in 2022.
Data for more countries are available at Hen Eggs Production indicator page.
| Hen Eggs Production | Unit | 2002 | 2003 | 2004 | 2005 | 2006 | 2007 | 2008 | 2009 | 2010 | 2011 | 2012 | 2013 | 2014 | 2015 | 2016 | 2017 | 2018 | 2019 | 2020 | 2021 | 2022 |
| Argentina | kt | 802 | 813 | 829 | 830 | 873 | ||||||||||||||||
| Brazil | kt | 2,260 | 2,883 | 3,030 | 3,150 | 3,261 | ||||||||||||||||
| China | kt | 26,864 | 26,565 | 26,849 | 28,454 | 29,825 | ||||||||||||||||
| Colombia | kt | 769 | 830 | 876 | 863 | 983 | ||||||||||||||||
| France | kt | 816 | 878 | 921 | 855 | 907 | ||||||||||||||||
| Germany | kt | 818 | 826 | 846 | 938 | 967 | ||||||||||||||||
| India | kt | 4,561 | 4,848 | 5,237 | 6,291 | 6,713 | ||||||||||||||||
| Indonesia | kt | 1,486 | 4,633 | 4,688 | 4,753 | 5,142 | ||||||||||||||||
| Japan | kt | 2,562 | 2,601 | 2,628 | 2,640 | 2,633 | ||||||||||||||||
| Mexico | kt | 2,720 | 2,771 | 2,872 | 2,950 | 3,016 | ||||||||||||||||
| Pakistan | kt | 761 | 803 | 848 | 895 | 946 | ||||||||||||||||
| Russia | kt | 2,413 | 2,484 | 2,486 | 2,492 | 2,492 | ||||||||||||||||
| Spain | kt | 831 | 851 | 839 | 811 | 860 | ||||||||||||||||
| Turkey | kt | 1,131 | 1,205 | 1,228 | 1,244 | 1,237 | ||||||||||||||||
| USA | kt | 6,047 | 6,351 | 6,518 | 6,707 | 6,659 |
 Helgi Library


