By Helgi Library - April 2, 2020
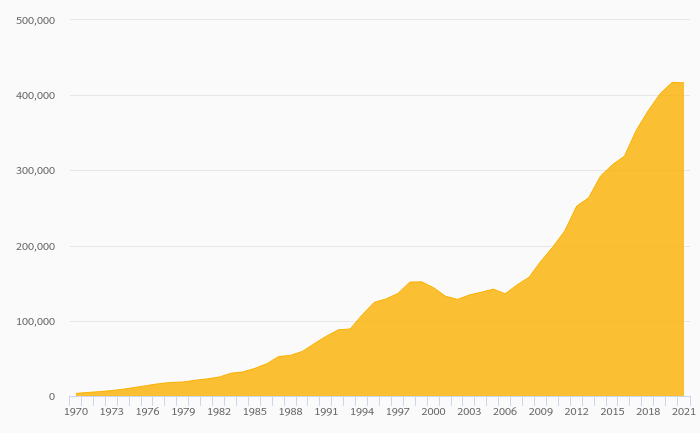
Avgol Nonwovens's total assets reached USD 401 mil at the end of 2015, down 9.95% compared to the previous year. C...
| Profit Statement |
| Balance Sheet |
| Ratios |
| Valuation |
Get all company financials in excel:
Get all company financials in excel:


Avgol Nonwoven Industries (or Avgol Industries 1953 Ltd) is an Israel-based manufacturer and supplier of ultra lightweight and top quality nonwoven fabrics. The products are used primarily for manufacturers of baby diapers, adult incontinence and feminine hygiene products. Its products are also used in other industries, such as the medical field for protective disposable garments; and agricultural field for crop covers, fruit and vegetable protection, etc. The Company's production facilities include plants in the United States, Israel, China and the Russian Federation. The Company is based in Tel Aviv, Israel, but operates subsidiaries located in the United States, the Russian Federation, China, Cyprus and India
Avgol Nonwovens has been growing its sales by a year on average in the last 5 years. EBITDA has grown on average by 5.42% a year during that time to total of USD 66.0 mil in 2015, or 19.4% of sales. That’s compared to 17.1% average margin seen in last five years.
The company netted USD 26.6 mil in 2015 implying ROE of 43.7% and ROCE of 8.26%. Again, the average figures were 21.8% and 6.96%, respectively when looking at the previous 5 years.
Avgol Nonwovens’s net debt amounted to USD 182 mil at the end of 2015, or 17.1 of equity. When compared to EBITDA, net debt was 2.76x, down when compared to average of 2.98x seen in the last 5 years.
Avgol Nonwovens stock traded at ILS 89.0 per share at the end of 2015 resulting in a market capitalization of USD 2,637 mil. Over the previous five years, stock price grew by 16.8% or 3.16% a year on average. The closing price put stock at a 12-month trailing EV/EBITDA of 42.7x and price to earnings (PE) of 99.1x as of 2015.
 Helgi Library