By Helgi Library - March 24, 2021
Bank of Georgia's net interest margin amounted to 3.73% in the fourth quarter of 2020, down from 4.05% when compared to the prev...
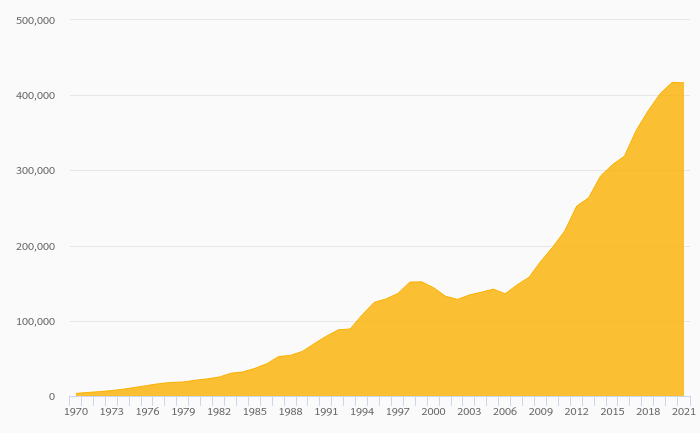
By Helgi Library - March 24, 2021
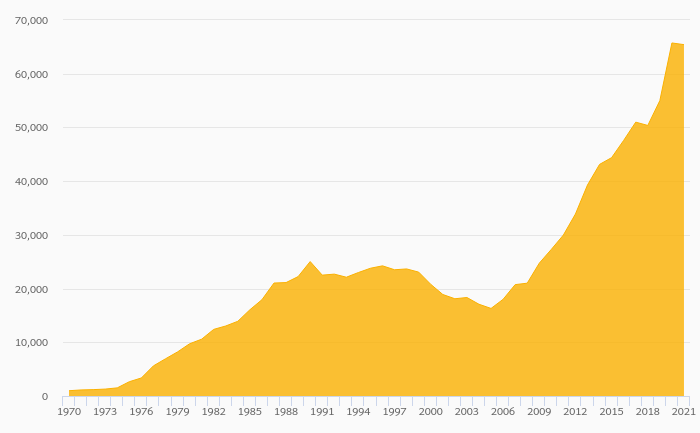
Bank of Georgia's customer loans reached GEL 6,648 mil in 2016-12-31, up 17.1% compared to the previous year. Georgian banking ...
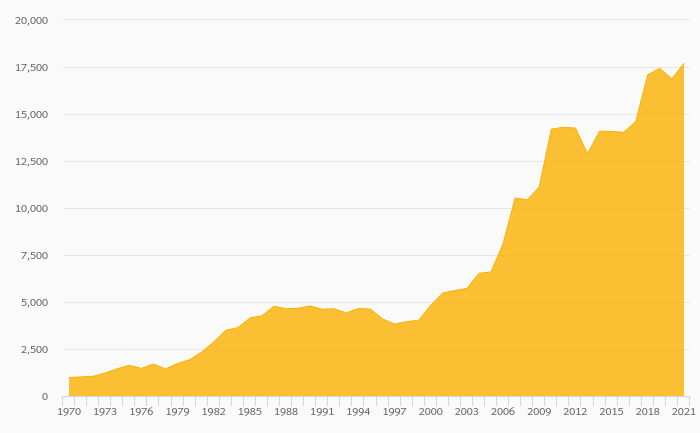
By Helgi Library - March 24, 2021
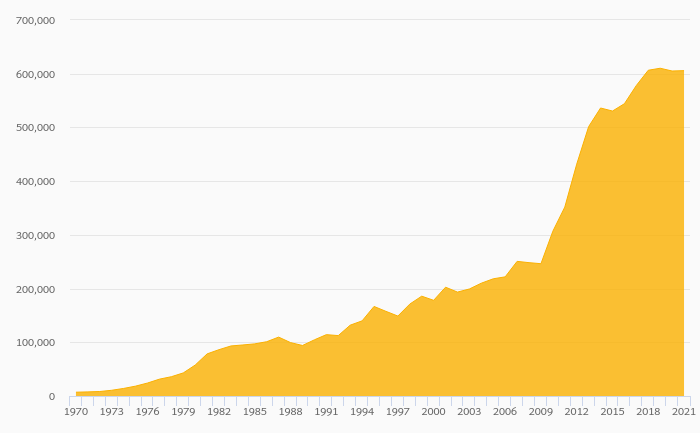
Bank of Georgia's customer deposits reached GEL 5,383 mil in 2016-12-31, up 14.5% compared to the previous year. Georgian banki...
| Profit Statement | Jun 2020 | Sep 2020 | Dec 2020 | |
| Net Interest Income | GEL mil | 180 | 204 | 202 |
| Net Fee Income | GEL mil | 32.9 | 45.5 | 47.0 |
| Other Income | GEL mil | 48.4 | 53.2 | 81.9 |
| Total Revenues | GEL mil | 261 | 303 | 330 |
| Staff Cost | GEL mil | 60.7 | 58.2 | 64.2 |
| Operating Profit | GEL mil | 134 | 195 | 188 |
| Provisions | GEL mil | -11.6 | 5.84 | 14.6 |
| Net Profit | GEL mil | 115 | 147 | 131 |
| Balance Sheet | Jun 2020 | Sep 2020 | Dec 2020 | |
| Interbank Loans | GEL mil | 1,700 | 1,980 | 2,016 |
| Customer Loans | GEL mil | 12,599 | 13,627 | 14,192 |
| Investments | GEL mil | 2,326 | 2,427 | 2,776 |
| Total Assets | GEL mil | 19,184 | 21,167 | 22,036 |
| Shareholders' Equity | GEL mil | 2,200 | 2,371 | 2,550 |
| Interbank Borrowing | GEL mil | 3,522 | 3,758 | 3,336 |
| Customer Deposits | GEL mil | 11,583 | 12,985 | 14,020 |
| Issued Debt Securities | GEL mil | 1,659 | 1,727 | 1,681 |
| Ratios | Jun 2020 | Sep 2020 | Dec 2020 | |
| ROE | % | 21.7 | 25.8 | 21.3 |
| ROA | % | 2.37 | 2.92 | 2.43 |
| Costs (As % Of Assets) | % | 2.62 | 2.14 | 2.64 |
| Costs (As % Of Income) | % | 48.6 | 35.6 | 43.2 |
| Capital Adequacy Ratio | % | 17.4 | 17.3 | 17.6 |
| Net Interest Margin | % | 3.70 | 4.05 | 3.73 |
| Loans (As % Of Deposits) | % | 109 | 105 | 101 |
| NPLs (As % Of Loans) | % | 2.72 | ... | ... |
| Provisions (As % Of NPLs) | % | 124 | ... | ... |
| Valuation | Jun 2020 | Sep 2020 | Dec 2020 | |
| Market Capitalisation | USD mil | 630 | 548 | 819 |
| Number Of Shares | mil | 47.6 | 47.5 | 47.5 |
| Share Price | GEL | 1,070 | 893 | 1,220 |
| Price/Earnings (P/E) | 11.1 | 7.19 | 11.1 | |
| Price/Book Value (P/BV) | 0.615 | 0.423 | 0.511 | |
| Dividend Yield | % | 0 | 0 | 0 |
| Earnings Per Share (EPS) | GEL | 9.68 | 12.4 | 11.0 |
| Book Value Per Share | GEL | 174 | 211 | 239 |
| Dividend Per Share | GEL | 0 | 0 | 0 |
Get all company financials in excel:
| summary | Unit | Jun 2011 | Sep 2011 | Dec 2011 | Mar 2012 | Jun 2012 | Sep 2012 | Dec 2012 | Mar 2013 | Jun 2013 | Sep 2013 | Dec 2013 | Mar 2014 | Jun 2014 | Sep 2014 | Dec 2014 | Mar 2015 | Jun 2015 | Sep 2015 | Dec 2015 | Mar 2016 | Jun 2016 | Sep 2016 | Dec 2016 | Mar 2017 | Jun 2017 | Sep 2017 | Dec 2017 | Mar 2018 | Jun 2018 | Sep 2018 | Dec 2018 | Mar 2019 | Jun 2019 | Sep 2019 | Dec 2019 | Mar 2020 | Jun 2020 | Sep 2020 | Dec 2020 |
| income statement | ||||||||||||||||||||||||||||||||||||||||
| Net Interest Income | GEL mil | 195 | 189 | 207 | 197 | 180 | ||||||||||||||||||||||||||||||||||
| Total Revenues | GEL mil | 282 | 313 | 340 | 305 | 261 | ||||||||||||||||||||||||||||||||||
| Operating Profit | GEL mil | 168 | 204 | 214 | 186 | 134 | ||||||||||||||||||||||||||||||||||
| Net Profit | GEL mil | 102 | 138 | 158 | -66.8 | 115 | ||||||||||||||||||||||||||||||||||
| balance sheet | ||||||||||||||||||||||||||||||||||||||||
| Interbank Loans | GEL mil | 1,705 | 1,834 | 1,619 | 1,954 | 1,700 | ||||||||||||||||||||||||||||||||||
| Customer Loans | GEL mil | 10,580 | 11,340 | 11,931 | 13,144 | 12,599 | ||||||||||||||||||||||||||||||||||
| Investments | GEL mil | 2,076 | 2,089 | 2,012 | 2,127 | 2,326 | ||||||||||||||||||||||||||||||||||
| Total Assets | GEL mil | 16,134 | 17,541 | 18,570 | 19,664 | 19,184 | ||||||||||||||||||||||||||||||||||
| Shareholders' Equity | GEL mil | 1,918 | 2,040 | 2,151 | 2,047 | 2,200 | ||||||||||||||||||||||||||||||||||
| Interbank Borrowing | GEL mil | 2,817 | 3,438 | 3,900 | 4,145 | 3,522 | ||||||||||||||||||||||||||||||||||
| Customer Deposits | GEL mil | 8,856 | 9,614 | 10,077 | 10,836 | 11,583 | ||||||||||||||||||||||||||||||||||
| Issued Debt Securities | GEL mil | 2,381 | 2,281 | 2,249 | 2,399 | 1,659 | ||||||||||||||||||||||||||||||||||
| ratios | ||||||||||||||||||||||||||||||||||||||||
| ROE | % | ... | 21.3 | 27.9 | 30.2 | -12.7 | 21.7 | |||||||||||||||||||||||||||||||||
| ROA | % | ... | 2.63 | 3.28 | 3.51 | -1.40 | 2.37 | |||||||||||||||||||||||||||||||||
| Costs (As % Of Assets) | % | ... | 2.92 | 2.60 | 2.80 | 2.49 | 2.62 | |||||||||||||||||||||||||||||||||
| Costs (As % Of Income) | % | 40.4 | 35.0 | 37.1 | 39.1 | 48.6 | ||||||||||||||||||||||||||||||||||
| Capital Adequacy Ratio | % | ... | ... | 16.7 | 16.8 | 18.1 | 15.3 | 17.4 | ||||||||||||||||||||||||||||||||
| Net Interest Margin | % | ... | 5.01 | 4.48 | 4.59 | 4.12 | 3.70 | |||||||||||||||||||||||||||||||||
| Interest Income (As % Of Revenues) | % | 69.2 | 60.3 | 60.9 | 64.6 | 68.9 | ||||||||||||||||||||||||||||||||||
| Fee Income (As % Of Revenues) | % | 15.3 | 15.3 | 13.7 | 13.1 | 12.6 | ||||||||||||||||||||||||||||||||||
| Staff Cost (As % Of Total Cost) | % | 61.7 | 54.4 | 48.7 | 47.4 | 47.8 | ||||||||||||||||||||||||||||||||||
| Equity (As % Of Assets) | % | 11.9 | 11.6 | 11.6 | 10.4 | 11.5 | ||||||||||||||||||||||||||||||||||
| Loans (As % Of Deposits) | % | 119 | 118 | 118 | 121 | 109 | ||||||||||||||||||||||||||||||||||
| Loans (As % Assets) | % | 65.6 | 64.6 | 64.3 | 66.8 | 65.7 | ||||||||||||||||||||||||||||||||||
| NPLs (As % Of Loans) | % | ... | ... | ... | ... | ... | ... | ... | ... | ... | ... | ... | ... | ... | ... | ... | ... | ... | ... | 3.18 | ... | 2.08 | ... | 2.72 | ... | ... | ||||||||||||||
| Provisions (As % Of NPLs) | % | ... | ... | ... | ... | ... | ... | ... | ... | ... | ... | ... | ... | ... | ... | ... | ... | ... | ... | 96.9 | ... | 90.0 | ... | 124 | ... | ... | ||||||||||||||
| valuation | ||||||||||||||||||||||||||||||||||||||||
| Market Capitalisation | USD mil | ... | ... | ... | 907 | 781 | 1,018 | 539 | 630 | |||||||||||||||||||||||||||||||
| Number Of Shares | mil | 47.9 | 47.6 | 47.4 | 47.6 | 47.6 | ||||||||||||||||||||||||||||||||||
| Share Price | GEL | ... | ... | ... | 1,498 | 1,336 | 1,625 | 915 | 1,070 | |||||||||||||||||||||||||||||||
| Earnings Per Share (EPS) | GEL | 8.54 | 11.6 | 13.4 | -5.61 | 9.68 | ||||||||||||||||||||||||||||||||||
| Book Value Per Share | GEL | 146 | 156 | 171 | 175 | 174 | ||||||||||||||||||||||||||||||||||
| Dividend Per Share | GEL | 2.55 | 0 | 0 | 0 | 0 | ||||||||||||||||||||||||||||||||||
| Price/Earnings (P/E) | ... | ... | ... | 17.5 | 11.5 | 12.1 | -16.3 | 11.1 | ||||||||||||||||||||||||||||||||
| Price/Book Value (P/BV) | ... | ... | ... | 1.03 | 0.858 | 0.952 | 0.523 | 0.615 | ||||||||||||||||||||||||||||||||
| Dividend Yield | % | ... | ... | ... | 1.70 | 0 | 0 | 0 | 0 | |||||||||||||||||||||||||||||||
| Earnings Per Share Growth | % | ... | ... | ... | ... | 35.9 | 418 | 33.1 | -160 | 13.3 | ||||||||||||||||||||||||||||||
| Book Value Per Share Growth | % | ... | ... | ... | ... | 20.6 | 30.3 | 33.1 | 24.9 | 19.6 |
| income statement | Unit | Jun 2011 | Sep 2011 | Dec 2011 | Mar 2012 | Jun 2012 | Sep 2012 | Dec 2012 | Mar 2013 | Jun 2013 | Sep 2013 | Dec 2013 | Mar 2014 | Jun 2014 | Sep 2014 | Dec 2014 | Mar 2015 | Jun 2015 | Sep 2015 | Dec 2015 | Mar 2016 | Jun 2016 | Sep 2016 | Dec 2016 | Mar 2017 | Jun 2017 | Sep 2017 | Dec 2017 | Mar 2018 | Jun 2018 | Sep 2018 | Dec 2018 | Mar 2019 | Jun 2019 | Sep 2019 | Dec 2019 | Mar 2020 | Jun 2020 | Sep 2020 | Dec 2020 |
| income statement | ||||||||||||||||||||||||||||||||||||||||
| Interest Income | GEL mil | 342 | 367 | 393 | 388 | 379 | ||||||||||||||||||||||||||||||||||
| Interest Cost | GEL mil | 147 | 178 | 186 | 191 | 199 | ||||||||||||||||||||||||||||||||||
| Net Interest Income | GEL mil | 195 | 189 | 207 | 197 | 180 | ||||||||||||||||||||||||||||||||||
| Net Fee Income | GEL mil | 43.3 | 48.0 | 46.6 | 40.1 | 32.9 | ||||||||||||||||||||||||||||||||||
| Fee Income | GEL mil | 68.0 | 76.2 | 77.5 | 70.9 | 54.4 | ||||||||||||||||||||||||||||||||||
| Fee Expense | GEL mil | 24.8 | 28.2 | 30.9 | 30.8 | 21.5 | ||||||||||||||||||||||||||||||||||
| Other Income | GEL mil | 43.6 | 76.4 | 86.5 | 68.1 | 48.4 | ||||||||||||||||||||||||||||||||||
| Total Revenues | GEL mil | 282 | 313 | 340 | 305 | 261 | ||||||||||||||||||||||||||||||||||
| Staff Cost | GEL mil | 70.4 | 59.5 | 61.5 | 56.5 | 60.7 | ||||||||||||||||||||||||||||||||||
| Operating Cost | GEL mil | 114 | 110 | 126 | 119 | 127 | ||||||||||||||||||||||||||||||||||
| Operating Profit | GEL mil | 168 | 204 | 214 | 186 | 134 | ||||||||||||||||||||||||||||||||||
| Provisions | GEL mil | 32.4 | 13.6 | 7.99 | 228 | -11.6 | ||||||||||||||||||||||||||||||||||
| Extra and Other Cost | GEL mil | 24.5 | 28.0 | 30.8 | 30.5 | 21.4 | ||||||||||||||||||||||||||||||||||
| Pre-Tax Profit | GEL mil | 111 | 162 | 175 | -72.6 | 124 | ||||||||||||||||||||||||||||||||||
| Tax | GEL mil | 8.29 | 23.4 | 16.1 | -5.36 | 8.71 | ||||||||||||||||||||||||||||||||||
| Minorities | GEL mil | 0.502 | 0.613 | 0.712 | -0.430 | 0.510 | ||||||||||||||||||||||||||||||||||
| Net Profit | GEL mil | 102 | 138 | 158 | -66.8 | 115 | ||||||||||||||||||||||||||||||||||
| Net Profit Avail. to Common | GEL mil | 102 | 138 | 158 | -66.8 | 115 | ||||||||||||||||||||||||||||||||||
| Dividends | GEL mil | 122 | 0 | 0 | 0 | 0 | ||||||||||||||||||||||||||||||||||
| growth rates | ||||||||||||||||||||||||||||||||||||||||
| Net Interest Income Growth | % | ... | ... | ... | ... | 2.49 | 1.81 | 10.5 | 3.74 | -7.87 | ||||||||||||||||||||||||||||||
| Net Fee Income Growth | % | ... | ... | ... | ... | 14.9 | 21.6 | 12.6 | -4.90 | -24.0 | ||||||||||||||||||||||||||||||
| Total Revenue Growth | % | ... | ... | ... | ... | 2.99 | 7.97 | 15.7 | 9.39 | -7.42 | ||||||||||||||||||||||||||||||
| Operating Cost Growth | % | ... | ... | ... | ... | 13.8 | 7.65 | 8.93 | 26.2 | 11.4 | ||||||||||||||||||||||||||||||
| Operating Profit Growth | % | ... | ... | ... | ... | -3.22 | 8.14 | 20.1 | 0.778 | -20.2 | ||||||||||||||||||||||||||||||
| Pre-Tax Profit Growth | % | ... | ... | ... | ... | 4.82 | 30.5 | 33.0 | -158 | 11.9 | ||||||||||||||||||||||||||||||
| Net Profit Growth | % | ... | ... | ... | ... | 49.1 | 21.2 | 32.5 | -159 | 12.5 |
| balance sheet | Unit | Jun 2011 | Sep 2011 | Dec 2011 | Mar 2012 | Jun 2012 | Sep 2012 | Dec 2012 | Mar 2013 | Jun 2013 | Sep 2013 | Dec 2013 | Mar 2014 | Jun 2014 | Sep 2014 | Dec 2014 | Mar 2015 | Jun 2015 | Sep 2015 | Dec 2015 | Mar 2016 | Jun 2016 | Sep 2016 | Dec 2016 | Mar 2017 | Jun 2017 | Sep 2017 | Dec 2017 | Mar 2018 | Jun 2018 | Sep 2018 | Dec 2018 | Mar 2019 | Jun 2019 | Sep 2019 | Dec 2019 | Mar 2020 | Jun 2020 | Sep 2020 | Dec 2020 |
| balance sheet | ||||||||||||||||||||||||||||||||||||||||
| Cash & Cash Equivalents | GEL mil | 936 | 1,369 | 2,154 | 1,507 | 1,634 | ||||||||||||||||||||||||||||||||||
| Interbank Loans | GEL mil | 1,705 | 1,834 | 1,619 | 1,954 | 1,700 | ||||||||||||||||||||||||||||||||||
| Customer Loans | GEL mil | 10,580 | 11,340 | 11,931 | 13,144 | 12,599 | ||||||||||||||||||||||||||||||||||
| Retail Loans | GEL mil | ... | ... | ... | ... | ... | ... | ... | ... | ... | ... | ... | ... | ... | ... | ... | ... | ... | ... | 4,786 | ... | 5,152 | ... | 5,461 | ... | ... | ||||||||||||||
| Mortgage Loans | GEL mil | ... | ... | ... | ... | ... | ... | ... | ... | ... | ... | ... | ... | ... | ... | ... | ... | ... | ... | 2,827 | ... | 3,067 | ... | 3,289 | ... | ... | ||||||||||||||
| Consumer Loans | GEL mil | ... | ... | ... | ... | ... | ... | ... | ... | ... | ... | ... | ... | ... | ... | ... | ... | ... | ... | 1,959 | ... | 2,085 | ... | 2,171 | ... | ... | ||||||||||||||
| Corporate Loans | GEL mil | ... | ... | ... | ... | ... | ... | ... | ... | ... | ... | ... | ... | ... | ... | ... | ... | ... | ... | 3,579 | ... | 4,102 | ... | 4,417 | ... | ... | ||||||||||||||
| Investments | GEL mil | 2,076 | 2,089 | 2,012 | 2,127 | 2,326 | ||||||||||||||||||||||||||||||||||
| Property and Equipment | GEL mil | 465 | 471 | 476 | 473 | 486 | ||||||||||||||||||||||||||||||||||
| Intangible Assets | GEL mil | 127 | 129 | 140 | 146 | 150 | ||||||||||||||||||||||||||||||||||
| Goodwill | GEL mil | 33.4 | 33.4 | 33.4 | 33.4 | 33.4 | ||||||||||||||||||||||||||||||||||
| Total Assets | GEL mil | 16,134 | 17,541 | 18,570 | 19,664 | 19,184 | ||||||||||||||||||||||||||||||||||
| Shareholders' Equity | GEL mil | 1,918 | 2,040 | 2,151 | 2,047 | 2,200 | ||||||||||||||||||||||||||||||||||
| Of Which Minority Interest | GEL mil | 8.38 | 8.98 | 9.51 | 9.09 | 9.77 | ||||||||||||||||||||||||||||||||||
| Liabilities | GEL mil | 14,216 | 15,501 | 16,419 | 17,616 | 16,984 | ||||||||||||||||||||||||||||||||||
| Interbank Borrowing | GEL mil | 2,817 | 3,438 | 3,900 | 4,145 | 3,522 | ||||||||||||||||||||||||||||||||||
| Customer Deposits | GEL mil | 8,856 | 9,614 | 10,077 | 10,836 | 11,583 | ||||||||||||||||||||||||||||||||||
| Sight Deposits | GEL mil | ... | ... | ... | ... | ... | ... | ... | ... | ... | ... | ... | ... | ... | ... | ... | ... | ... | ... | 4,341 | ... | 5,034 | ... | 4,955 | ... | ... | ||||||||||||||
| Term Deposits | GEL mil | ... | ... | ... | ... | ... | ... | ... | ... | ... | ... | ... | ... | ... | ... | ... | ... | ... | ... | 4,514 | ... | 5,043 | ... | 6,628 | ... | ... | ||||||||||||||
| Issued Debt Securities | GEL mil | 2,381 | 2,281 | 2,249 | 2,399 | 1,659 | ||||||||||||||||||||||||||||||||||
| Other Liabilities | GEL mil | 162 | 168 | 193 | 236 | 220 | ||||||||||||||||||||||||||||||||||
| asset quality | ||||||||||||||||||||||||||||||||||||||||
| Non-Performing Loans | GEL mil | 347 | 339 | 253 | 284 | 355 | ||||||||||||||||||||||||||||||||||
| Gross Loans | GEL mil | ... | ... | ... | ... | ... | ... | ... | ... | ... | ... | ... | ... | ... | ... | ... | ... | ... | ... | 10,916 | ... | 12,159 | ... | 13,040 | ... | ... | ||||||||||||||
| Risk-Weighted Assets | GEL mil | ... | ... | ... | ... | ... | ... | ... | ... | ... | ... | ... | ... | ... | ... | ... | ... | ... | ... | 13,868 | ... | ... | ... | ... | ||||||||||||||||
| Total Provisions | GEL mil | ... | ... | ... | ... | ... | ... | ... | ... | ... | ... | ... | ... | ... | ... | ... | ... | ... | ... | 336 | ... | 227 | ... | 440 | ... | ... | ||||||||||||||
| growth rates | ||||||||||||||||||||||||||||||||||||||||
| Customer Loan Growth | % | ... | ... | ... | ... | 31.0 | 29.4 | 27.0 | 37.3 | 19.1 | ||||||||||||||||||||||||||||||
| Retail Loan Growth | % | ... | ... | ... | ... | ... | ... | ... | ... | ... | ... | ... | ... | ... | ... | ... | ... | ... | ... | ... | ... | 27.0 | ... | 16.4 | ... | 14.1 | ... | ... | ||||||||||||
| Mortgage Loan Growth | % | ... | ... | ... | ... | ... | ... | ... | ... | ... | ... | ... | ... | ... | ... | ... | ... | ... | ... | ... | ... | 46.4 | ... | 20.3 | ... | 16.4 | ... | ... | ||||||||||||
| Consumer Loan Growth | % | ... | ... | ... | ... | ... | ... | ... | ... | ... | ... | ... | ... | ... | ... | ... | ... | ... | ... | ... | ... | 6.65 | ... | 11.1 | ... | 10.9 | ... | ... | ||||||||||||
| Corporate Loan Growth | % | ... | ... | ... | ... | ... | ... | ... | ... | ... | ... | ... | ... | ... | ... | ... | ... | ... | ... | ... | ... | 40.1 | ... | 38.7 | ... | 23.4 | ... | ... | ||||||||||||
| Total Asset Growth | % | ... | ... | ... | ... | 22.1 | 22.5 | 25.5 | 30.6 | 18.9 | ||||||||||||||||||||||||||||||
| Shareholders' Equity Growth | % | ... | ... | ... | ... | 17.1 | 22.2 | 19.6 | 6.70 | 14.7 | ||||||||||||||||||||||||||||||
| Customer Deposit Growth | % | ... | ... | ... | ... | 23.4 | 21.2 | 23.9 | 29.1 | 30.8 | ||||||||||||||||||||||||||||||
| market share | ||||||||||||||||||||||||||||||||||||||||
| Market Share in Customer Loans | % | ... | ... | ... | ... | ... | ... | ... | ... | ... | ... | ... | ... | ... | ... | ... | ... | |||||||||||||||||||||||
| Market Share in Corporate Loans | % | ... | ... | ... | ... | ... | ... | ... | ... | ... | ... | ... | ... | ... | ... | ... | ... | ... | ... | ... | ... | ... | ... | ... | ... | ... | ... | ... | ... | ... | ||||||||||
| Market Share in Total Assets | % | ... | ... | ... | ... | ... | ... | ... | ... | ... | ... | ... | ... | ... | ... | ... | ... | |||||||||||||||||||||||
| Market Share in Customer Deposits | % | ... | ... | ... | ... | ... | ... | ... | ... | ... | ... | ... | ... | ... | ... | ... | ... |
| ratios | Unit | Jun 2011 | Sep 2011 | Dec 2011 | Mar 2012 | Jun 2012 | Sep 2012 | Dec 2012 | Mar 2013 | Jun 2013 | Sep 2013 | Dec 2013 | Mar 2014 | Jun 2014 | Sep 2014 | Dec 2014 | Mar 2015 | Jun 2015 | Sep 2015 | Dec 2015 | Mar 2016 | Jun 2016 | Sep 2016 | Dec 2016 | Mar 2017 | Jun 2017 | Sep 2017 | Dec 2017 | Mar 2018 | Jun 2018 | Sep 2018 | Dec 2018 | Mar 2019 | Jun 2019 | Sep 2019 | Dec 2019 | Mar 2020 | Jun 2020 | Sep 2020 | Dec 2020 |
| ROE | % | ... | 21.3 | 27.9 | 30.2 | -12.7 | 21.7 | |||||||||||||||||||||||||||||||||
| ROTE | % | ... | 26.3 | 26.3 | 27.2 | 17.4 | 17.5 | |||||||||||||||||||||||||||||||||
| ROE (@ 15% of RWA) | % | ... | ... | ... | ... | ... | ... | ... | ... | ... | ... | ... | ... | ... | ... | ... | ... | ... | ... | ... | ... | ... | ... | ... | ... | ... | ... | ... | ... | ... | ... | ... | ... | ... | ||||||
| ROA | % | ... | 2.63 | 3.28 | 3.51 | -1.40 | 2.37 | |||||||||||||||||||||||||||||||||
| Return on Loans | % | ... | 4.45 | 4.31 | 4.39 | 2.65 | 2.68 | |||||||||||||||||||||||||||||||||
| Operating Profit (As % of RWA) | % | ... | ... | ... | ... | ... | ... | ... | ... | ... | ... | ... | ... | ... | ... | ... | ... | ... | ... | ... | ... | ... | ... | ... | ... | ... | ... | ... | ... | ... | ... | ... | ... | ... | ||||||
| Costs (As % Of Assets) | % | ... | 2.92 | 2.60 | 2.80 | 2.49 | 2.62 | |||||||||||||||||||||||||||||||||
| Costs (As % Of Income) | % | 40.4 | 35.0 | 37.1 | 39.1 | 48.6 | ||||||||||||||||||||||||||||||||||
| Costs (As % Of Loans) | % | ... | 4.53 | 4.00 | 4.34 | 3.80 | 3.95 | |||||||||||||||||||||||||||||||||
| Costs (As % Of Loans & Deposits) | % | 2.35 | 2.09 | 2.29 | 1.99 | 2.10 | ||||||||||||||||||||||||||||||||||
| Capital Adequacy Ratio | % | ... | ... | 16.7 | 16.8 | 18.1 | 15.3 | 17.4 | ||||||||||||||||||||||||||||||||
| Tier 1 Ratio | % | ... | ... | 10.6 | 13.3 | 13.6 | 8.30 | 9.90 | ||||||||||||||||||||||||||||||||
| Net Interest Margin | % | ... | 5.01 | 4.48 | 4.59 | 4.12 | 3.70 | |||||||||||||||||||||||||||||||||
| Interest Spread | % | ... | 4.48 | 3.92 | 4.05 | 3.63 | 3.20 | |||||||||||||||||||||||||||||||||
| Asset Yield | % | ... | 8.78 | 8.71 | 8.72 | 8.13 | 7.81 | |||||||||||||||||||||||||||||||||
| Revenues (As % of RWA) | % | ... | ... | ... | ... | ... | ... | ... | ... | ... | ... | ... | ... | ... | ... | ... | ... | ... | ... | ... | ... | ... | ... | ... | ... | ... | ... | ... | ... | ... | ... | ... | ... | ... | ||||||
| Cost Of Liabilities | % | ... | 4.30 | 4.79 | 4.67 | 4.50 | 4.61 | |||||||||||||||||||||||||||||||||
| Payout Ratio | % | ... | ... | ... | 42.1 | 20.7 | 19.3 | 27.4 | 27.2 | |||||||||||||||||||||||||||||||
| Interest Income (As % Of Revenues) | % | 69.2 | 60.3 | 60.9 | 64.6 | 68.9 | ||||||||||||||||||||||||||||||||||
| Fee Income (As % Of Revenues) | % | 15.3 | 15.3 | 13.7 | 13.1 | 12.6 | ||||||||||||||||||||||||||||||||||
| Other Income (As % Of Revenues) | % | 15.5 | 24.4 | 25.4 | 22.3 | 18.5 | ||||||||||||||||||||||||||||||||||
| Staff Cost (As % Of Total Cost) | % | 61.7 | 54.4 | 48.7 | 47.4 | 47.8 | ||||||||||||||||||||||||||||||||||
| Equity (As % Of Assets) | % | 11.9 | 11.6 | 11.6 | 10.4 | 11.5 | ||||||||||||||||||||||||||||||||||
| Equity (As % Of Loans) | % | 18.1 | 18.0 | 18.0 | 15.6 | 17.5 | ||||||||||||||||||||||||||||||||||
| Loans (As % Of Deposits) | % | 119 | 118 | 118 | 121 | 109 | ||||||||||||||||||||||||||||||||||
| Loans (As % Assets) | % | 65.6 | 64.6 | 64.3 | 66.8 | 65.7 | ||||||||||||||||||||||||||||||||||
| NPLs (As % Of Loans) | % | ... | ... | ... | ... | ... | ... | ... | ... | ... | ... | ... | ... | ... | ... | ... | ... | ... | ... | 3.18 | ... | 2.08 | ... | 2.72 | ... | ... | ||||||||||||||
| Provisions (As % Of NPLs) | % | ... | ... | ... | ... | ... | ... | ... | ... | ... | ... | ... | ... | ... | ... | ... | ... | ... | ... | 96.9 | ... | 90.0 | ... | 124 | ... | ... | ||||||||||||||
| Provisions (As % Of Loans) | % | ... | ... | ... | ... | ... | ... | ... | ... | ... | ... | ... | ... | ... | ... | ... | ... | ... | ... | 3.18 | ... | 1.91 | ... | 3.50 | ... | ... | ||||||||||||||
| Cost of Provisions (As % Of Loans) | % | ... | 1.29 | 0.497 | 0.275 | 7.28 | -0.361 |
| other data | Unit | Jun 2011 | Sep 2011 | Dec 2011 | Mar 2012 | Jun 2012 | Sep 2012 | Dec 2012 | Mar 2013 | Jun 2013 | Sep 2013 | Dec 2013 | Mar 2014 | Jun 2014 | Sep 2014 | Dec 2014 | Mar 2015 | Jun 2015 | Sep 2015 | Dec 2015 | Mar 2016 | Jun 2016 | Sep 2016 | Dec 2016 | Mar 2017 | Jun 2017 | Sep 2017 | Dec 2017 | Mar 2018 | Jun 2018 | Sep 2018 | Dec 2018 | Mar 2019 | Jun 2019 | Sep 2019 | Dec 2019 | Mar 2020 | Jun 2020 | Sep 2020 | Dec 2020 |
| Employees | ... | ... | ... | ... | ... | ... | 48,953 | 14,608 | 7,383 | 7,349 | ... | ... | ||||||||||||||||||||||||||||
| Cost Per Employee | USD per month | ... | ... | ... | ... | ... | ... | 172 | 467 | 954 | 894 | ... | ... | |||||||||||||||||||||||||||
| Cost Per Employee (Local Currency) | GEL per month | ... | ... | ... | ... | ... | ... | 479 | 1,359 | 2,777 | 2,564 | ... | ... |
Get all company financials in excel:


By Helgi Library - March 24, 2021
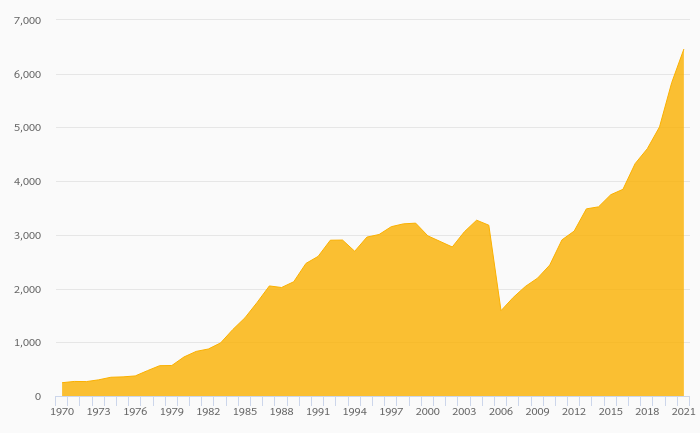
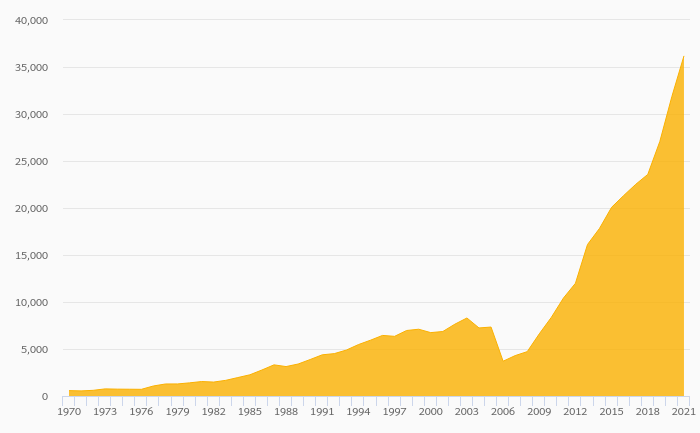
Bank of Georgia made a net profit of GEL 131 mil in the fourth quarter of 2020, down 17.2% when compared to the same period of last year. This implies a return on equity of 21.3%. Historically, the bank’s net profit reached an all time high of GEL 158 mil in 4Q20...
By Helgi Library - March 24, 2021
Bank of Georgia's non-performing loans reached 2.72% of total loans at the end of 2020-06-30, down from 3.18% compared to the previous year. Historically, the NPL ratio hit an all time high of 4.48% in 2017-06-30 and an all time low of 2.08% in 2019-12-31. ...
By Helgi Library - March 24, 2021
Bank of Georgia's loans reached GEL 13,040 mil in the second quarter of 2020, down from when compared to the previous quarter and up from GEL 10,916 mil when compared to the same period of last year. Historically, the bank’s loans reached an all ti...
By Helgi Library - March 24, 2021
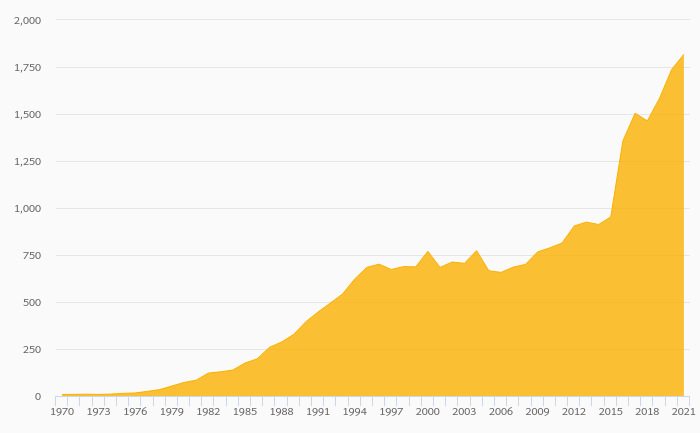
Bank of Georgia's capital adequacy ratio reached 17.6% at the end of fourth quarter of 2020, up from 17.3% when compared to the previous quarter. Historically, the bank’s capital ratio hit an all time high of 29.7% in 1Q2012 and an all time low of 14.1% in 4Q2014. ...
By Helgi Library - March 24, 2021
Bank of Georgia generated total banking revenues of GEL 330 mil in the fourth quarter of 2020, down 2.86% when compared to the same period of last year and up 9.15% when compared to the previous quarter. Historically, the bank’s revenues containin...
By Helgi Library - March 24, 2021
Bank of Georgia's retail loans reached GEL 5,461 mil at the end of 2020-06-30, down 0% compared to the previous year. In the last decade, the average annual loan growth amounted to 0%. Overall, retail loans accounted for 43.3% of the bank's loan book at the...
By Helgi Library - March 24, 2021
Bank of Georgia's Equity reached 11.6% of total assets in the 4Q2020, down from 11.6% for the previous year. As a share of net customer loans, the ratio amounted to 18.0% at the end of the fourth quarter of 2020. ...
By Helgi Library - March 24, 2021
Bank of Georgia's customer loan growth reached 18.9% in 2020-12-31, down from 27.0% compared to the previous year. Historically, the bank’s loans growth reached an all time high of 48.1% in 2015-03-31 and an all time low of 3.94% in 2016-03-31. In the las...
By Helgi Library - March 24, 2021
Bank of Georgia's non-performing loans reached 2.08% of total loans at the end of 2019, down from 3.28% compared to the previous year. Historically, the NPL ratio hit an all time high of 4.37% in 2015 and an all time low of 2.08% in 2019. Provision coverage...
By Helgi Library - March 24, 2021
Bank of Georgia's net interest margin amounted to 3.83% in 2020, down from 4.73% compared to the previous year. Historically, the bank’s net interest margin reached an all time high of 5.68% in 2015 and an all time low of 3.83% in 2020. The average marg...
Bank of Georgia has been growing its revenues and asset by 8.09% and 16.9% a year on average in the last 5 years. Its loans and deposits have grown by 21.7% and 24.2% a year during that time and loans to deposits ratio reached 101% at the end of 2020. The company achieved an average return on equity of 17.7% in the last five years with net profit growing 5.11% a year on average. In terms of operating efficiency, its cost to income ratio reached 38.0% in 2020, compared to 36.6% average in the last five years.
Equity represented 11.6% of total assets or 18.0% of loans at the end of 2020. Bank of Georgia's non-performing loans were of total loans while provisions covered some of NPLs at the end of 2020.
Bank of Georgia stock traded at per share at the end of 2020 resulting in a market capitalization of . Over the previous three years, stock price rose by 0% or 0% a year on average. That’s compared to an average ROE of 19.8% the bank generated for its shareholders. This closing price put stock at a 12-month trailing price to earnings (PE) of 16.0x and price to book value (PBV) of 0.511x in 2020.
 Helgi Library