By Helgi Library - February 21, 2020
DZ Bank's non-performing loans reached 2.87% of total loans at the end of 2018, down from 3.56% compared to the previous year. ...
By Helgi Library - February 21, 2020
DZ Bank's net interest margin amounted to 0.532% in 2018, down from 0.575% compared to the previous year. Historically, th...
By Helgi Library - February 21, 2020
DZ Bank made a net profit of EUR 895 mil under revenues of EUR 24,144 mil in 2018, up -3.68% and -7.22% respectively compared to the ...
| Profit Statement | 2016 | 2017 | 2018 | |
| Net Interest Income | EUR mil | 2,660 | 2,916 | 2,726 |
| Net Fee Income | EUR mil | 1,698 | 1,864 | 1,955 |
| Other Income | EUR mil | 20,969 | 21,244 | 19,463 |
| Total Revenues | EUR mil | 25,327 | 26,024 | 24,144 |
| Staff Cost | EUR mil | 1,760 | 1,808 | 1,843 |
| Operating Profit | EUR mil | 4,225 | 4,313 | 3,482 |
| Provisions | EUR mil | 569 | 822 | 206 |
| Net Profit | EUR mil | 1,412 | 929 | 895 |
| Balance Sheet | 2016 | 2017 | 2018 | |
| Interbank Loans | EUR mil | 107,253 | 89,414 | 91,627 |
| Customer Loans | EUR mil | 174,138 | 171,582 | 172,133 |
| Total Assets | EUR mil | 509,447 | 505,594 | 518,733 |
| Shareholders' Equity | EUR mil | 22,890 | 23,505 | 23,512 |
| Interbank Borrowing | EUR mil | 179,484 | 163,589 | 171,386 |
| Customer Deposits | EUR mil | 124,425 | 126,319 | 132,548 |
| Issued Debt Securities | EUR mil | 82,961 | 71,226 | 66,806 |
| Ratios | 2016 | 2017 | 2018 | |
| ROE | % | 6.63 | 4.00 | 3.81 |
| ROA | % | 0.308 | 0.183 | 0.175 |
| Costs (As % Of Assets) | % | 4.60 | 4.28 | 4.03 |
| Costs (As % Of Income) | % | 83.3 | 83.4 | 85.6 |
| Capital Adequacy Ratio | % | 18.6 | 17.2 | 16.8 |
| Net Interest Margin | % | 0.580 | 0.575 | 0.532 |
| Loans (As % Of Deposits) | % | 140 | 136 | 130 |
| NPLs (As % Of Loans) | % | 3.29 | 3.56 | 2.87 |
| Provisions (As % Of NPLs) | % | 41.3 | 45.1 | 46.1 |
| Growth Rates | 2016 | 2017 | 2018 | |
| Total Revenue Growth | % | 4.42 | 2.75 | -7.22 |
| Operating Cost Growth | % | 5.23 | 2.89 | -4.83 |
| Operating Profit Growth | % | 0.547 | 2.08 | -19.3 |
| Net Profit Growth | % | -0.249 | -34.2 | -3.68 |
| Customer Loan Growth | % | 39.6 | -1.47 | 0.321 |
| Total Asset Growth | % | 24.8 | -0.756 | 2.60 |
| Customer Deposit Growth | % | 29.4 | 1.52 | 4.93 |
| Shareholders' Equity Growth | % | 16.0 | 2.69 | 0.030 |
| Employees | 25,302 | 31,272 | 30,732 | |
Get all company financials in excel:
| summary | Unit | 2005 | 2006 | 2007 | 2008 | 2009 | 2010 | 2011 | 2012 | 2013 | 2014 | 2015 | 2016 | 2017 | 2018 |
| income statement | |||||||||||||||
| Net Interest Income | EUR mil | 3,260 | 3,118 | 3,049 | 2,870 | 2,660 | |||||||||
| Total Revenues | EUR mil | 20,917 | 22,669 | 25,156 | 24,255 | 25,327 | |||||||||
| Operating Profit | EUR mil | 3,465 | 4,521 | 4,511 | 4,202 | 4,225 | |||||||||
| Net Profit | EUR mil | 691 | 1,169 | 1,730 | 1,416 | 1,412 | |||||||||
| balance sheet | |||||||||||||||
| Interbank Loans | EUR mil | 79,429 | 74,214 | 79,317 | 80,735 | 107,253 | |||||||||
| Customer Loans | EUR mil | 121,302 | 117,618 | 120,049 | 124,777 | 174,138 | |||||||||
| Debt Securities | EUR mil | 192,797 | 179,986 | 191,364 | 188,569 | 209,832 | |||||||||
| Total Assets | EUR mil | 407,236 | 385,398 | 402,682 | 408,341 | 509,447 | |||||||||
| Shareholders' Equity | EUR mil | 12,641 | 14,188 | 18,245 | 19,729 | 22,890 | |||||||||
| Interbank Borrowing | EUR mil | 100,596 | 136,926 | 140,956 | 142,604 | 179,484 | |||||||||
| Customer Deposits | EUR mil | 92,169 | 98,411 | 96,428 | 96,186 | 124,425 | |||||||||
| Issued Debt Securities | EUR mil | 67,592 | 56,955 | 59,393 | 59,093 | 82,961 | |||||||||
| ratios | |||||||||||||||
| ROE | % | ... | 5.90 | 8.71 | 10.7 | 7.46 | 6.63 | ||||||||
| ROA | % | ... | 0.170 | 0.295 | 0.439 | 0.349 | 0.308 | ||||||||
| Costs (As % Of Assets) | % | ... | 4.29 | 4.58 | 5.24 | 4.95 | 4.60 | ||||||||
| Costs (As % Of Income) | % | 83.4 | 80.1 | 82.1 | 82.7 | 83.3 | |||||||||
| Capital Adequacy Ratio | % | 13.8 | 17.9 | 16.8 | 18.8 | 18.6 | |||||||||
| Net Interest Margin | % | ... | 0.802 | 0.787 | 0.774 | 0.708 | 0.580 | ||||||||
| Interest Income (As % Of Revenues) | % | 15.6 | 13.8 | 12.1 | 11.8 | 10.5 | |||||||||
| Fee Income (As % Of Revenues) | % | 4.90 | 4.87 | 5.62 | 6.73 | 6.70 | |||||||||
| Staff Cost (As % Of Total Cost) | % | ... | ... | 8.47 | 8.34 | 7.75 | 8.03 | 8.34 | |||||||
| Equity (As % Of Assets) | % | 3.10 | 3.68 | 4.53 | 4.83 | 4.49 | |||||||||
| Loans (As % Of Deposits) | % | 132 | 120 | 124 | 130 | 140 | |||||||||
| Loans (As % Assets) | % | 29.8 | 30.5 | 29.8 | 30.6 | 34.2 | |||||||||
| NPLs (As % Of Loans) | % | ... | ... | ... | 3.83 | 4.83 | 4.82 | 4.10 | 3.29 | ||||||
| Provisions (As % Of NPLs) | % | ... | ... | ... | 52.9 | 43.8 | 40.5 | 39.9 | 41.3 | ||||||
| valuation | |||||||||||||||
| Number Of Shares (Average) | mil | ... | ... | ... | ... | ... | ... | ... | ... | ... | ... | ... | |||
| Earnings Per Share (EPS) | EUR | ... | ... | ... | ... | ... | ... | ... | ... | ... | ... | ... | |||
| Book Value Per Share | EUR | ... | ... | ... | ... | ... | ... | ... | ... | ... | ... | ... | |||
| Dividend Per Share | EUR | ... | ... | ... | ... | ... | ... | ... | ... | ... | ... | ||||
| Earnings Per Share Growth | % | ... | ... | ... | ... | ... | ... | ... | ... | ... | ... | ... | ... | ||
| Book Value Per Share Growth | % | ... | 3.92 | -4.36 | -2.21 | -5.87 | -7.32 |
| income statement | Unit | 2005 | 2006 | 2007 | 2008 | 2009 | 2010 | 2011 | 2012 | 2013 | 2014 | 2015 | 2016 | 2017 | 2018 |
| income statement | |||||||||||||||
| Interest Income | EUR mil | 8,544 | 7,459 | 7,302 | 6,667 | 6,811 | |||||||||
| Interest Cost | EUR mil | 5,284 | 4,341 | 4,253 | 3,797 | 4,151 | |||||||||
| Net Interest Income | EUR mil | 3,260 | 3,118 | 3,049 | 2,870 | 2,660 | |||||||||
| Net Fee Income | EUR mil | 1,024 | 1,104 | 1,415 | 1,632 | 1,698 | |||||||||
| Other Income | EUR mil | 16,633 | 18,447 | 20,692 | 19,753 | 20,969 | |||||||||
| Total Revenues | EUR mil | 20,917 | 22,669 | 25,156 | 24,255 | 25,327 | |||||||||
| Staff Cost | EUR mil | ... | ... | 1,478 | 1,513 | 1,599 | 1,610 | 1,760 | |||||||
| Depreciation | EUR mil | ... | ... | ... | ... | ... | ... | ... | ... | 116 | 138 | 140 | 157 | ||
| Other Cost | EUR mil | ... | ... | ... | ... | ... | ... | ... | ... | 16,519 | 18,908 | 18,303 | 19,185 | ||
| Operating Cost | EUR mil | 17,452 | 18,148 | 20,645 | 20,053 | 21,102 | |||||||||
| Operating Profit | EUR mil | 3,465 | 4,521 | 4,511 | 4,202 | 4,225 | |||||||||
| Provisions | EUR mil | 527 | 540 | 191 | 153 | 569 | |||||||||
| Extra and Other Cost | EUR mil | 1,619 | 1,760 | 1,453 | 1,596 | 1,538 | |||||||||
| Pre-Tax Profit | EUR mil | 1,319 | 2,221 | 2,867 | 2,453 | 2,118 | |||||||||
| Tax | EUR mil | 350 | 754 | 710 | 657 | 568 | |||||||||
| Minorities | EUR mil | 278 | 298 | 427 | 380 | 138 | |||||||||
| Net Profit | EUR mil | 691 | 1,169 | 1,730 | 1,416 | 1,412 | |||||||||
| Dividends | EUR mil | ... | ... | ... | ... | ... | ... | ... | |||||||
| growth rates | |||||||||||||||
| Net Interest Income Growth | % | ... | 3.92 | -4.36 | -2.21 | -5.87 | -7.32 | ||||||||
| Net Fee Income Growth | % | ... | 6.33 | 7.81 | 28.2 | 15.3 | 4.04 | ||||||||
| Total Revenue Growth | % | ... | 16.0 | 8.38 | 11.0 | -3.58 | 4.42 | ||||||||
| Operating Cost Growth | % | ... | 11.0 | 3.99 | 13.8 | -2.87 | 5.23 | ||||||||
| Operating Profit Growth | % | ... | 50.0 | 30.5 | -0.221 | -6.85 | 0.547 | ||||||||
| Pre-Tax Profit Growth | % | ... | 222 | 68.4 | 29.1 | -14.4 | -13.7 | ||||||||
| Net Profit Growth | % | ... | 47.0 | 69.2 | 48.0 | -18.2 | -0.249 |
| balance sheet | Unit | 2005 | 2006 | 2007 | 2008 | 2009 | 2010 | 2011 | 2012 | 2013 | 2014 | 2015 | 2016 | 2017 | 2018 |
| balance sheet | |||||||||||||||
| Cash | EUR mil | 2,497 | 3,812 | 3,033 | 6,542 | 8,515 | |||||||||
| Interbank Loans | EUR mil | 79,429 | 74,214 | 79,317 | 80,735 | 107,253 | |||||||||
| Customer Loans | EUR mil | 121,302 | 117,618 | 120,049 | 124,777 | 174,138 | |||||||||
| Retail Loans | EUR mil | ... | ... | ... | ... | ... | ... | ... | ... | ... | ... | ... | ... | ||
| Mortgage Loans | EUR mil | ... | ... | ... | ... | ... | ... | ... | ... | ... | ... | ... | ... | ||
| Consumer Loans | EUR mil | ... | ... | ... | ... | ... | ... | ... | ... | ... | ... | ... | ... | ||
| Corporate Loans | EUR mil | 67,093 | 67,321 | 68,235 | 69,502 | 110,702 | |||||||||
| Debt Securities | EUR mil | 192,797 | 179,986 | 191,364 | 188,569 | 209,832 | |||||||||
| Fixed Assets | EUR mil | 1,841 | 1,762 | 2,292 | 1,710 | 1,752 | |||||||||
| Intangible Assets | EUR mil | ... | ... | ... | ... | ... | ... | ... | 216 | 216 | 169 | 787 | |||
| Goodwill | EUR mil | ... | ... | ... | 275 | 216 | 216 | 169 | 169 | ||||||
| Total Assets | EUR mil | 407,236 | 385,398 | 402,682 | 408,341 | 509,447 | |||||||||
| Shareholders' Equity | EUR mil | 12,641 | 14,188 | 18,245 | 19,729 | 22,890 | |||||||||
| Of Which Minority Interest | EUR mil | 4,690 | 4,841 | 5,338 | 4,722 | 2,826 | |||||||||
| Liabilities | EUR mil | 394,595 | 371,210 | 384,437 | 388,612 | 486,557 | |||||||||
| Interbank Borrowing | EUR mil | 100,596 | 136,926 | 140,956 | 142,604 | 179,484 | |||||||||
| Customer Deposits | EUR mil | 92,169 | 98,411 | 96,428 | 96,186 | 124,425 | |||||||||
| Term Deposits | EUR mil | 44,145 | 47,205 | 49,543 | 83,443 | 109,677 | |||||||||
| Issued Debt Securities | EUR mil | 67,592 | 56,955 | 59,393 | 59,093 | 82,961 | |||||||||
| Subordinated Debt | EUR mil | ... | ... | ... | ... | ... | ... | ... | ... | ... | 3,784 | 4,142 | 4,723 | ||
| Other Liabilities | EUR mil | 134,238 | 78,918 | 87,660 | 90,729 | 99,687 | |||||||||
| asset quality | |||||||||||||||
| Non-Performing Loans | EUR mil | ... | ... | ... | 4,743 | 5,800 | 5,900 | 5,200 | 5,800 | ||||||
| Gross Loans | EUR mil | 123,811 | 120,158 | 122,437 | 126,850 | 176,532 | |||||||||
| Total Provisions | EUR mil | ... | 2,509 | 2,540 | 2,388 | 2,073 | 2,394 | ||||||||
| growth rates | |||||||||||||||
| Customer Loan Growth | % | ... | 2.38 | -3.04 | 2.07 | 3.94 | 39.6 | ||||||||
| Retail Loan Growth | % | ... | ... | ... | ... | ... | ... | ... | ... | ... | ... | ... | ... | ... | |
| Mortgage Loan Growth | % | ... | ... | ... | ... | ... | ... | ... | ... | ... | ... | ... | ... | ... | |
| Corporate Loan Growth | % | ... | 2.77 | 0.340 | 1.36 | 1.86 | 59.3 | ||||||||
| Total Asset Growth | % | ... | 0.323 | -5.36 | 4.48 | 1.41 | 24.8 | ||||||||
| Shareholders' Equity Growth | % | ... | 17.3 | 12.2 | 28.6 | 8.13 | 16.0 | ||||||||
| Customer Deposit Growth | % | ... | -0.756 | 6.77 | -2.02 | -0.251 | 29.4 |
| ratios | Unit | 2005 | 2006 | 2007 | 2008 | 2009 | 2010 | 2011 | 2012 | 2013 | 2014 | 2015 | 2016 | 2017 | 2018 |
| ratios | |||||||||||||||
| ROE | % | ... | 5.90 | 8.71 | 10.7 | 7.46 | 6.63 | ||||||||
| ROA | % | ... | 0.170 | 0.295 | 0.439 | 0.349 | 0.308 | ||||||||
| Costs (As % Of Assets) | % | ... | 4.29 | 4.58 | 5.24 | 4.95 | 4.60 | ||||||||
| Costs (As % Of Income) | % | 83.4 | 80.1 | 82.1 | 82.7 | 83.3 | |||||||||
| Capital Adequacy Ratio | % | 13.8 | 17.9 | 16.8 | 18.8 | 18.6 | |||||||||
| Tier 1 Ratio | % | 13.6 | 16.4 | 13.7 | 15.6 | 16.0 | |||||||||
| Net Interest Margin | % | ... | 0.802 | 0.787 | 0.774 | 0.708 | 0.580 | ||||||||
| Interest Spread | % | ... | 0.763 | 0.748 | 0.727 | 0.662 | 0.536 | ||||||||
| Asset Yield | % | ... | 2.10 | 1.88 | 1.85 | 1.64 | 1.48 | ||||||||
| Cost Of Liabilities | % | ... | 1.34 | 1.13 | 1.13 | 0.982 | 0.949 | ||||||||
| Payout Ratio | % | ... | ... | ... | ... | ... | ... | ... | |||||||
| Interest Income (As % Of Revenues) | % | 15.6 | 13.8 | 12.1 | 11.8 | 10.5 | |||||||||
| Fee Income (As % Of Revenues) | % | 4.90 | 4.87 | 5.62 | 6.73 | 6.70 | |||||||||
| Other Income (As % Of Revenues) | % | 79.5 | 81.4 | 82.3 | 81.4 | 82.8 | |||||||||
| Cost Per Employee | USD per month | ... | ... | ... | 6,759 | 7,038 | 6,804 | 6,080 | 6,215 | ||||||
| Cost Per Employee (Local Currency) | EUR per month | ... | ... | ... | 5,259 | 5,302 | 5,279 | 5,304 | 5,797 | ||||||
| Staff Cost (As % Of Total Cost) | % | ... | ... | 8.47 | 8.34 | 7.75 | 8.03 | 8.34 | |||||||
| Equity (As % Of Assets) | % | 3.10 | 3.68 | 4.53 | 4.83 | 4.49 | |||||||||
| Loans (As % Of Deposits) | % | 132 | 120 | 124 | 130 | 140 | |||||||||
| Loans (As % Assets) | % | 29.8 | 30.5 | 29.8 | 30.6 | 34.2 | |||||||||
| NPLs (As % Of Loans) | % | ... | ... | ... | 3.83 | 4.83 | 4.82 | 4.10 | 3.29 | ||||||
| Provisions (As % Of NPLs) | % | ... | ... | ... | 52.9 | 43.8 | 40.5 | 39.9 | 41.3 | ||||||
| Provisions (As % Of Loans) | % | ... | 2.07 | 2.16 | 1.99 | 1.66 | 1.37 | ||||||||
| Cost of Provisions (As % Of Loans) | % | ... | 0.440 | 0.452 | 0.161 | 0.125 | 0.381 |
| other data | Unit | 2005 | 2006 | 2007 | 2008 | 2009 | 2010 | 2011 | 2012 | 2013 | 2014 | 2015 | 2016 | 2017 | 2018 |
| other data | |||||||||||||||
| Employees | ... | 23,420 | 23,780 | 25,242 | 25,296 | 25,302 | |||||||||
| Risk-Weighted Assets | EUR mil | 89,232 | 85,307 | 98,262 | 98,027 | 118,634 | |||||||||
| Return on Loans | % | 0.576 | 0.979 | 1.46 | 1.16 | 0.945 | |||||||||
| Operating Profit (As % of Loans) | % | ... | 2.89 | 3.78 | 3.80 | 3.43 | 2.83 | ||||||||
| Costs (As % Of Loans) | % | ... | 14.6 | 15.2 | 17.4 | 16.4 | 14.1 | ||||||||
| Equity (As % Of Loans) | % | 10.4 | 12.1 | 15.2 | 15.8 | 13.1 |
Get all company financials in excel:

By Helgi Library - February 21, 2020
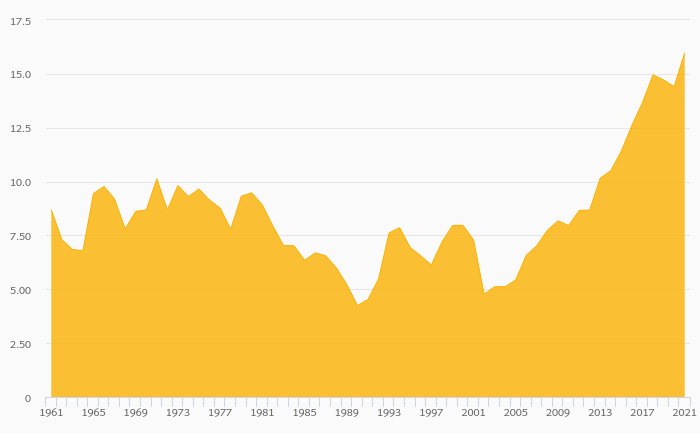
DZ Bank's capital adequacy ratio reached 16.8% at the end of 2018, down from 17.2% compared to the previous year. Historically, the bank’s capital ratio hit an all time high of 18.8% in 2015 and an all time low of 9.70% in 2008. The Tier 1 ratio amounted to ...
By Helgi Library - February 21, 2020
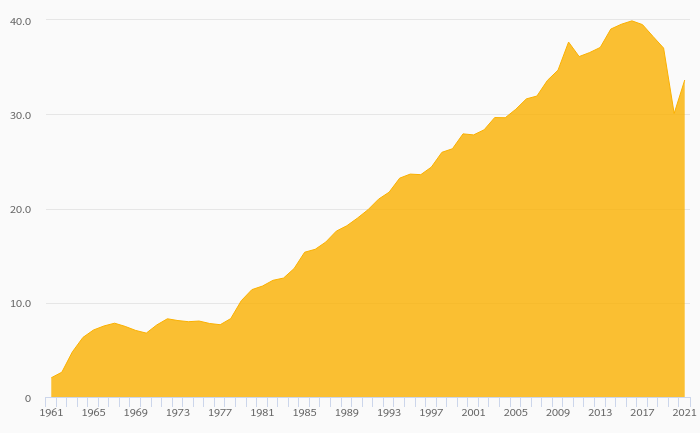
DZ Bank generated total banking revenues of EUR 24,144 mil in 2018, down 7.22% compared to the previous year. Historically, the bank’s revenues containing of interest, fee and other non-interest income reached an all time high of EUR 26,024 mil in 2017 and an a...
By Helgi Library - February 21, 2020
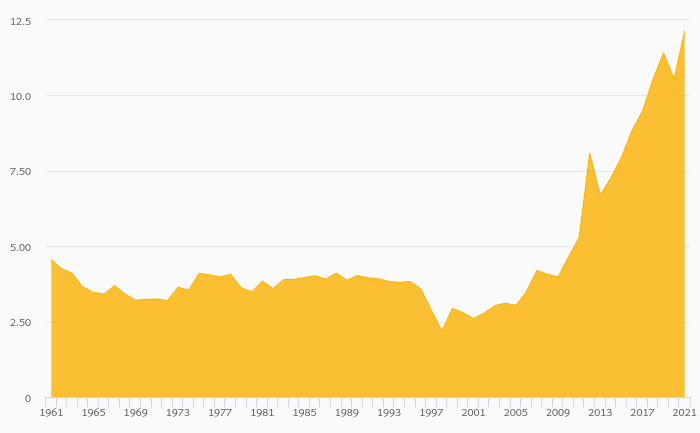
DZ Bank's customer loan growth reached 0.321% in 2018, up from -1.47% compared to the previous year. Historically, the bank’s loans growth reached an all time high of 39.6% in 2016 and an all time low of -3.97% in 2009. In the last decade, the average ann...
 Helgi Library