By Helgi Library - December 13, 2021
Epwin Group made a net profit of GBP 2.60 mil with revenues of GBP 241 mil in 2020, down by 75.7% and down by 14.6%, ...
By Helgi Library - December 14, 2021
Epwin Group stock traded at GBP 106 per share at the end 2020 translating into a market capitalization of USD 206 mil. Since the...
By Helgi Library - December 14, 2021
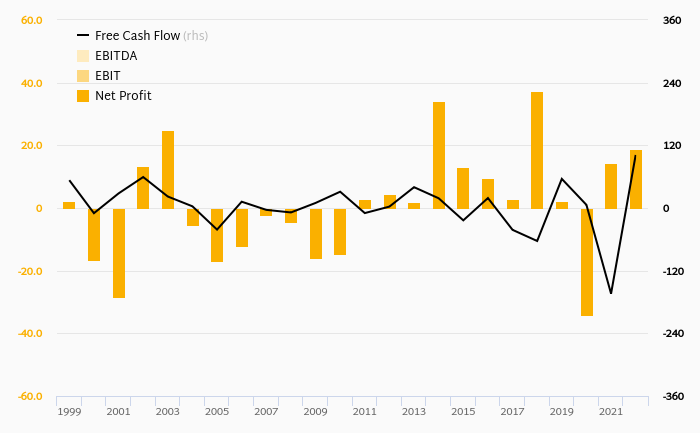
Epwin Group made a net profit of GBP 2.60 mil in 2020, down 75.7% compared to the previous year. Historically, between 2013...
| Profit Statement | 2021 | 2022 | 2023 | |
| Sales | GBP mil | 313 | 315 | 324 |
| Gross Profit | GBP mil | 93.7 | 94.8 | 97.5 |
| EBITDA | GBP mil | 35.8 | 39.7 | 41.1 |
| EBIT | GBP mil | 17.3 | 21.0 | 22.4 |
| Financing Cost | GBP mil | 4.40 | 4.37 | 4.33 |
| Pre-Tax Profit | GBP mil | 12.9 | 16.7 | 18.0 |
| Net Profit | GBP mil | 9.67 | 12.6 | 13.2 |
| Dividends | GBP mil | 4.86 | 6.29 | 6.72 |
| Balance Sheet | 2021 | 2022 | 2023 | |
| Total Assets | GBP mil | 266 | 280 | 294 |
| Non-Current Assets | GBP mil | ... | ... | ... |
| Current Assets | GBP mil | ... | ... | ... |
| Working Capital | GBP mil | ... | ... | ... |
| Shareholders' Equity | GBP mil | 97.5 | 105 | 112 |
| Liabilities | GBP mil | 169 | 174 | 182 |
| Total Debt | GBP mil | ... | ... | ... |
| Net Debt | GBP mil | 13.4 | 7.96 | 1.40 |
| Ratios | 2021 | 2022 | 2023 | |
| ROE | % | 10.3 | 12.5 | 12.1 |
| ROCE | % | ... | ... | ... |
| Gross Margin | % | 29.9 | 30.1 | 30.1 |
| EBITDA Margin | % | 11.4 | 12.6 | 12.7 |
| EBIT Margin | % | 5.51 | 6.67 | 6.91 |
| Net Margin | % | 3.09 | 4.01 | 4.07 |
| Net Debt/EBITDA | 0.375 | 0.201 | 0.034 | |
| Net Debt/Equity | % | 13.8 | 7.56 | 1.25 |
| Cost of Financing | % | ... | ... | ... |
| Valuation | 2021 | 2022 | 2023 | |
| Market Capitalisation | USD mil | 197 | 197 | 197 |
| Enterprise Value (EV) | USD mil | 215 | 208 | 199 |
| Number Of Shares | mil | 143 | 143 | 143 |
| Share Price | GBP | 106 | 106 | 106 |
| EV/EBITDA | 4.49 | 4.01 | 3.71 | |
| EV/Sales | 0.514 | 0.504 | 0.471 | |
| Price/Earnings (P/E) | 15.6 | 12.0 | 11.5 | |
| Price/Book Value (P/BV) | 1.55 | 1.43 | 1.35 | |
| Dividend Yield | % | 3.22 | 4.16 | 4.45 |
Get all company financials in excel:
| overview | Unit | 2012 | 2013 | 2014 | 2015 | 2016 | 2017 | 2018 | 2019 | 2020 | 2021 | 2022 | 2023 |
| income statement | |||||||||||||
| Sales | GBP mil | ... | 293 | 281 | 282 | 241 | 313 | ||||||
| Gross Profit | GBP mil | ... | 91.3 | 84.8 | 88.8 | 72.2 | 93.7 | ||||||
| EBIT | GBP mil | ... | 15.1 | 14.8 | 17.2 | 6.30 | 17.3 | ||||||
| Net Profit | GBP mil | ... | 10.1 | 5.80 | 10.7 | 2.60 | 9.67 | ||||||
| ROE | % | ... | 10.9 | 6.31 | 12.0 | 2.92 | 10.3 | ||||||
| EBIT Margin | % | ... | 5.16 | 5.27 | 6.10 | 2.61 | 5.51 | ||||||
| Net Margin | % | ... | 3.45 | 2.06 | 3.79 | 1.08 | 3.09 | ||||||
| Employees | 2,542 | 2,304 | 2,103 | ... | ... | ... | ... | ||||||
| balance sheet | |||||||||||||
| Total Assets | GBP mil | ... | 188 | 187 | 274 | 254 | 266 | ||||||
| Non-Current Assets | GBP mil | ... | 106 | 112 | 182 | 177 | ... | ... | ... | ||||
| Current Assets | GBP mil | ... | 82.2 | 75.7 | 91.5 | 76.8 | ... | ... | ... | ||||
| Shareholders' Equity | GBP mil | ... | 93.7 | 90.0 | 88.8 | 89.3 | 97.5 | ||||||
| Liabilities | GBP mil | ... | 94.7 | 97.4 | 185 | 164 | 169 | ||||||
| Non-Current Liabilities | GBP mil | ... | 15.5 | 28.1 | 98.7 | 96.3 | ... | ... | ... | ||||
| Current Liabilities | GBP mil | ... | 79.2 | 69.3 | 86.3 | 68.1 | ... | ... | ... | ||||
| Net Debt/EBITDA | ... | 1.05 | 1.04 | 2.50 | 3.89 | 0.375 | |||||||
| Net Debt/Equity | % | ... | 26.8 | 27.6 | 97.0 | 111 | 13.8 | ||||||
| Cost of Financing | % | ... | ... | 3.64 | 4.74 | 3.13 | 1.46 | ... | ... | ... | |||
| cash flow | |||||||||||||
| Total Cash From Operations | GBP mil | ... | 16.4 | 23.8 | 29.9 | 22.9 | ... | ... | ... | ||||
| Total Cash From Investing | GBP mil | ... | -9.20 | -12.5 | -0.700 | -8.00 | ... | ... | ... | ||||
| Total Cash From Financing | GBP mil | ... | -12.9 | -12.5 | -18.1 | -29.9 | ... | ... | ... | ||||
| Net Change In Cash | GBP mil | ... | -5.70 | -1.20 | 11.1 | -15.0 | ... | ... | ... | ||||
| valuation | |||||||||||||
| Market Capitalisation | USD mil | ... | ... | 161 | 132 | 197 | 206 | 197 | |||||
| Enterprise Value (EV) | USD mil | ... | ... | 195 | 164 | 311 | 342 | 215 | |||||
| Number Of Shares | mil | ... | ... | 143 | 143 | 143 | 143 | 143 | |||||
| Share Price | GBP | ... | ... | 71.3 | 66.6 | 101 | 106 | 106 | |||||
| Price/Earnings (P/E) | ... | ... | 10.1 | 16.4 | 13.6 | 58.1 | 15.6 | ||||||
| Price/Cash Earnings (P/CE) | ... | ... | 5.78 | 7.17 | 5.30 | 7.91 | 5.44 | ||||||
| EV/EBITDA | ... | ... | 6.34 | 5.25 | 6.99 | 10.0 | 4.49 | ||||||
| Price/Book Value (P/BV) | ... | ... | 1.09 | 1.06 | 1.64 | 1.69 | 1.55 | ||||||
| Dividend Yield | % | ... | ... | 9.30 | 9.25 | 4.88 | 0.947 | 3.22 |
| income statement | Unit | 2012 | 2013 | 2014 | 2015 | 2016 | 2017 | 2018 | 2019 | 2020 | 2021 | 2022 | 2023 |
| income statement | |||||||||||||
| Sales | GBP mil | ... | 293 | 281 | 282 | 241 | 313 | ||||||
| Cost of Goods & Services | GBP mil | ... | 202 | 196 | 193 | 169 | 220 | ||||||
| Gross Profit | GBP mil | ... | 91.3 | 84.8 | 88.8 | 72.2 | 93.7 | ||||||
| Selling, General & Admin | GBP mil | ... | 76.2 | 70.0 | 71.6 | 65.9 | ... | ... | ... | ||||
| Research & Development | GBP mil | ... | 0 | 0 | 0 | 0 | ... | ... | ... | ||||
| Other Operating Expense | GBP mil | ... | ... | ... | ... | 0 | 0 | 0 | 0 | ... | ... | ... | |
| Staff Cost | GBP mil | ... | 73.4 | 69.6 | 67.0 | 56.0 | ... | ... | ... | ||||
| Other Operating Cost (Income) | GBP mil | ... | ... | ... | ... | 0 | 0 | 0 | 0 | ... | ... | ... | |
| EBITDA | GBP mil | ... | 23.9 | 23.8 | 34.5 | 25.5 | 35.8 | ||||||
| Depreciation | GBP mil | ... | 7.50 | 7.50 | 16.7 | 16.5 | 18.1 | ||||||
| EBIT | GBP mil | ... | 15.1 | 14.8 | 17.2 | 6.30 | 17.3 | ||||||
| Net Financing Cost | GBP mil | ... | 1.20 | 1.50 | 2.10 | 1.50 | 4.40 | ||||||
| Financing Cost | GBP mil | ... | 1.20 | 1.50 | 2.10 | 1.50 | 4.40 | ||||||
| Financing Income | GBP mil | ... | 0 | 0 | 0 | 0 | ... | ... | ... | ||||
| FX (Gain) Loss | GBP mil | ... | ... | ... | ... | 0 | 0 | 0 | 0 | ... | ... | ... | |
| (Income) / Loss from Affiliates | GBP mil | ... | ... | ... | ... | ... | ... | ... | ... | ... | ... | ||
| Extraordinary Cost | GBP mil | ... | 1.50 | 5.00 | 0 | 0 | 0 | ||||||
| Pre-Tax Profit | GBP mil | ... | 13.9 | 13.3 | 12.4 | 1.90 | 12.9 | ||||||
| Tax | GBP mil | ... | 2.30 | 2.50 | 1.70 | -0.700 | 3.20 | ||||||
| Minorities | GBP mil | ... | 0 | 0 | 0 | 0 | 0 | ||||||
| Net Profit | GBP mil | ... | 10.1 | 5.80 | 10.7 | 2.60 | 9.67 | ||||||
| Net Profit Avail. to Common | GBP mil | ... | 10.1 | 5.80 | 10.7 | 2.60 | 9.67 | ||||||
| Dividends | GBP mil | ... | 9.48 | 8.80 | 7.07 | 1.43 | 4.86 | ||||||
| growth rates | |||||||||||||
| Total Revenue Growth | % | ... | ... | -0.136 | -4.00 | 0.356 | -14.6 | 30.0 | |||||
| Operating Cost Growth | % | ... | ... | 11.1 | -8.14 | 2.29 | -7.96 | ... | ... | ... | |||
| Staff Cost Growth | % | ... | ... | 0.824 | -5.18 | -3.74 | -16.4 | ... | ... | ... | |||
| EBITDA Growth | % | ... | ... | -27.1 | -0.418 | 45.0 | -26.1 | 40.5 | |||||
| EBIT Growth | % | ... | ... | -37.1 | -1.99 | 16.2 | -63.4 | 174 | |||||
| Pre-Tax Profit Growth | % | ... | ... | -39.6 | -4.32 | -6.77 | -84.7 | 577 | |||||
| Net Profit Growth | % | ... | ... | -48.5 | -42.6 | 84.5 | -75.7 | 272 | |||||
| ratios | |||||||||||||
| ROE | % | ... | 10.9 | 6.31 | 12.0 | 2.92 | 10.3 | ||||||
| ROA | % | ... | 5.32 | 3.09 | 4.64 | 0.986 | 3.72 | ||||||
| ROCE | % | ... | ... | 7.43 | 4.33 | 6.35 | 1.27 | ... | ... | ... | |||
| Gross Margin | % | ... | 31.2 | 30.2 | 31.5 | 30.0 | 29.9 | ||||||
| EBITDA Margin | % | ... | 8.16 | 8.47 | 12.2 | 10.6 | 11.4 | ||||||
| EBIT Margin | % | ... | 5.16 | 5.27 | 6.10 | 2.61 | 5.51 | ||||||
| Net Margin | % | ... | 3.45 | 2.06 | 3.79 | 1.08 | 3.09 | ||||||
| Payout Ratio | % | ... | 93.8 | 152 | 66.1 | 55.0 | 50.3 | ||||||
| Cost of Financing | % | ... | ... | 3.64 | 4.74 | 3.13 | 1.46 | ... | ... | ... | |||
| Net Debt/EBITDA | ... | 1.05 | 1.04 | 2.50 | 3.89 | 0.375 |
| balance sheet | Unit | 2012 | 2013 | 2014 | 2015 | 2016 | 2017 | 2018 | 2019 | 2020 | 2021 | 2022 | 2023 |
| balance sheet | |||||||||||||
| Cash & Cash Equivalents | GBP mil | ... | 7.30 | 6.10 | 17.2 | 2.20 | ... | ... | ... | ||||
| Receivables | GBP mil | ... | 38.7 | 35.0 | 34.0 | 34.9 | ... | ... | ... | ||||
| Inventories | GBP mil | ... | 29.6 | 29.2 | 30.3 | 29.6 | ... | ... | ... | ||||
| Other ST Assets | GBP mil | ... | 6.60 | 5.40 | 10.0 | 10.1 | ... | ... | ... | ||||
| Current Assets | GBP mil | ... | 82.2 | 75.7 | 91.5 | 76.8 | ... | ... | ... | ||||
| Property, Plant & Equipment | GBP mil | ... | 36.0 | 37.2 | 103 | 98.1 | ... | ... | ... | ||||
| LT Investments & Receivables | GBP mil | ... | 0 | 0 | 0 | 0 | ... | ... | ... | ||||
| Intangible Assets | GBP mil | ... | 69.6 | 73.7 | 75.7 | 75.0 | ... | ... | ... | ||||
| Goodwill | GBP mil | ... | 65.7 | 70.2 | 72.2 | 72.2 | ... | ... | ... | ||||
| Non-Current Assets | GBP mil | ... | 106 | 112 | 182 | 177 | ... | ... | ... | ||||
| Total Assets | GBP mil | ... | 188 | 187 | 274 | 254 | 266 | ||||||
| Trade Payables | GBP mil | ... | 38.6 | 43.8 | 41.7 | 37.0 | ... | ... | ... | ||||
| Short-Term Debt | GBP mil | ... | 21.0 | 5.60 | 9.00 | 9.30 | ... | ... | ... | ||||
| Other ST Liabilities | GBP mil | ... | 2.10 | 1.80 | 1.10 | 1.20 | ... | ... | ... | ||||
| Current Liabilities | GBP mil | ... | 79.2 | 69.3 | 86.3 | 68.1 | ... | ... | ... | ||||
| Long-Term Debt | GBP mil | ... | 11.4 | 25.3 | 94.3 | 92.2 | ... | ... | ... | ||||
| Other LT Liabilities | GBP mil | ... | 4.10 | 2.80 | 4.40 | 4.10 | ... | ... | ... | ||||
| Non-Current Liabilities | GBP mil | ... | 15.5 | 28.1 | 98.7 | 96.3 | ... | ... | ... | ||||
| Liabilities | GBP mil | ... | 94.7 | 97.4 | 185 | 164 | 169 | ||||||
| Preferred Equity and Hybrid Capital | GBP mil | ... | 0 | 0 | 0 | 0 | ... | ... | ... | ||||
| Share Capital | GBP mil | ... | 12.6 | 12.6 | 12.6 | 12.6 | ... | ... | ... | ||||
| Treasury Stock | GBP mil | ... | 0 | 0 | 0 | 0 | ... | ... | ... | ||||
| Equity Before Minority Interest | GBP mil | ... | 93.7 | 90.0 | 88.8 | 89.3 | 97.5 | ||||||
| Minority Interest | GBP mil | ... | 0 | 0 | 0 | 0 | 0 | ||||||
| Equity | GBP mil | ... | 93.7 | 90.0 | 88.8 | 89.3 | 97.5 | ||||||
| growth rates | |||||||||||||
| Total Asset Growth | % | ... | ... | -1.41 | -0.531 | 46.1 | -7.34 | 5.00 | |||||
| Shareholders' Equity Growth | % | ... | ... | 3.08 | -3.95 | -1.33 | 0.563 | 9.22 | |||||
| Net Debt Growth | % | ... | 21.8 | -1.20 | 247 | 15.3 | -86.5 | ||||||
| Total Debt Growth | % | ... | ... | -3.57 | -4.63 | 234 | -1.74 | ... | ... | ... | |||
| ratios | |||||||||||||
| Total Debt | GBP mil | ... | 32.4 | 30.9 | 103 | 102 | ... | ... | ... | ||||
| Net Debt | GBP mil | 25.1 | 24.8 | 86.1 | 99.3 | 13.4 | |||||||
| Working Capital | GBP mil | ... | 29.7 | 20.4 | 22.6 | 27.5 | ... | ... | ... | ||||
| Capital Employed | GBP mil | ... | 136 | 132 | 205 | 204 | ... | ... | ... | ||||
| Net Debt/Equity | % | ... | 26.8 | 27.6 | 97.0 | 111 | 13.8 | ||||||
| Current Ratio | ... | 1.04 | 1.09 | 1.06 | 1.13 | ... | ... | ... | |||||
| Quick Ratio | ... | 0.581 | 0.593 | 0.593 | 0.545 | ... | ... | ... |
| cash flow | Unit | 2012 | 2013 | 2014 | 2015 | 2016 | 2017 | 2018 | 2019 | 2020 | 2021 | 2022 | 2023 |
| cash flow | |||||||||||||
| Net Profit | GBP mil | ... | 10.1 | 5.80 | 10.7 | 2.60 | 9.67 | ||||||
| Depreciation | GBP mil | ... | 7.50 | 7.50 | 16.7 | 16.5 | 18.1 | ||||||
| Non-Cash Items | GBP mil | ... | 1.00 | 1.10 | 3.70 | 2.90 | ... | ... | ... | ||||
| Change in Working Capital | GBP mil | ... | -5.00 | 2.90 | -1.80 | -1.80 | ... | ... | ... | ||||
| Total Cash From Operations | GBP mil | ... | 16.4 | 23.8 | 29.9 | 22.9 | ... | ... | ... | ||||
| Capital Expenditures | GBP mil | ... | ... | ... | ... | -5.30 | -12.5 | -8.60 | -3.20 | ... | ... | ... | |
| Net Change in LT Investment | GBP mil | ... | 0 | 0 | 0 | 0 | ... | ... | ... | ||||
| Net Cash From Acquisitions | GBP mil | ... | ... | ... | ... | -3.90 | 0 | -2.20 | 0 | ... | ... | ... | |
| Other Investing Activities | GBP mil | ... | 0 | 0 | 10.1 | -4.80 | ... | ... | ... | ||||
| Total Cash From Investing | GBP mil | ... | -9.20 | -12.5 | -0.700 | -8.00 | ... | ... | ... | ||||
| Dividends Paid | GBP mil | ... | -9.50 | -8.80 | -7.10 | 0 | ... | ... | ... | ||||
| Issuance Of Shares | GBP mil | ... | 0 | 0 | 0 | 0 | ... | ... | ... | ||||
| Issuance Of Debt | GBP mil | ... | -1.40 | -1.80 | -11.0 | -25.6 | ... | ... | ... | ||||
| Other Financing Activities | GBP mil | ... | 0 | 0 | 0 | -4.30 | ... | ... | ... | ||||
| Total Cash From Financing | GBP mil | ... | -12.9 | -12.5 | -18.1 | -29.9 | ... | ... | ... | ||||
| Effect of FX Rates | GBP mil | ... | ... | ... | ... | 0 | 0 | 0 | 0 | ... | ... | ... | |
| Net Change In Cash | GBP mil | ... | -5.70 | -1.20 | 11.1 | -15.0 | ... | ... | ... | ||||
| ratios | |||||||||||||
| Days Sales Outstanding | days | ... | 48.2 | 45.4 | 44.0 | 52.9 | ... | ... | ... | ||||
| Days Sales Of Inventory | days | ... | 53.6 | 54.3 | 57.2 | 64.0 | ... | ... | ... | ||||
| Days Payable Outstanding | days | ... | 69.9 | 81.4 | 78.7 | 80.0 | ... | ... | ... | ||||
| Cash Conversion Cycle | days | ... | 31.9 | 18.3 | 22.5 | 36.9 | ... | ... | ... | ||||
| Cash Earnings | GBP mil | ... | 17.6 | 13.3 | 27.4 | 19.1 | 27.8 | ||||||
| Free Cash Flow | GBP mil | ... | 7.20 | 11.3 | 29.2 | 14.9 | ... | ... | ... | ||||
| Capital Expenditures (As % of Sales) | % | ... | ... | ... | ... | 1.81 | 4.45 | 3.05 | 1.33 | ... | ... | ... |
| other ratios | Unit | 2012 | 2013 | 2014 | 2015 | 2016 | 2017 | 2018 | 2019 | 2020 | 2021 | 2022 | 2023 |
| Employees | 2,542 | 2,304 | 2,103 | ... | ... | ... | ... | ||||||
| Cost Per Employee | USD per month | ... | 3,099 | 3,295 | 3,426 | ... | ... | ... | ... | ||||
| Cost Per Employee (Local Currency) | GBP per month | ... | 2,406 | 2,517 | 2,655 | ... | ... | ... | ... | ||||
| Operating Cost (As % of Sales) | % | ... | 26.0 | 24.9 | 25.4 | 27.3 | ... | ... | ... | ||||
| Research & Development (As % of Sales) | % | ... | 0 | 0 | 0 | 0 | ... | ... | ... | ||||
| Staff Cost (As % of Sales) | % | ... | 25.1 | 24.8 | 23.8 | 23.2 | ... | ... | ... | ||||
| Effective Tax Rate | % | ... | 16.5 | 18.8 | 13.7 | -36.8 | 24.9 | ||||||
| Total Revenue Growth (5-year average) | % | ... | ... | ... | ... | ... | ... | 1.94 | 1.68 | -1.20 | 1.34 | ||
| Total Revenue Growth (10-year average) | % | ... | ... | ... | ... | ... | ... | ... | ... | ... | ... | ... |
| valuation | Unit | 2012 | 2013 | 2014 | 2015 | 2016 | 2017 | 2018 | 2019 | 2020 | 2021 | 2022 | 2023 |
| Market Capitalisation | USD mil | ... | ... | 161 | 132 | 197 | 206 | 197 | |||||
| Enterprise Value (EV) | USD mil | ... | ... | 195 | 164 | 311 | 342 | 215 | |||||
| Number Of Shares | mil | ... | ... | 143 | 143 | 143 | 143 | 143 | |||||
| Share Price | GBP | ... | ... | 71.3 | 66.6 | 101 | 106 | 106 | |||||
| EV/EBITDA | ... | ... | 6.34 | 5.25 | 6.99 | 10.0 | 4.49 | ||||||
| Price/Earnings (P/E) | ... | ... | 10.1 | 16.4 | 13.6 | 58.1 | 15.6 | ||||||
| Price/Cash Earnings (P/CE) | ... | ... | 5.78 | 7.17 | 5.30 | 7.91 | 5.44 | ||||||
| P/FCF | ... | ... | 14.1 | 8.43 | 4.98 | 10.1 | ... | ... | ... | ||||
| Price/Book Value (P/BV) | ... | ... | 1.09 | 1.06 | 1.64 | 1.69 | 1.55 | ||||||
| Dividend Yield | % | ... | ... | 9.30 | 9.25 | 4.88 | 0.947 | 3.22 | |||||
| Free Cash Flow Yield | % | ... | ... | 5.75 | 11.2 | 19.1 | 9.66 | ... | ... | ... | |||
| Earnings Per Share (EPS) | GBP | ... | ... | 0.071 | 0.041 | 0.075 | 0.018 | 0.068 | |||||
| Cash Earnings Per Share | GBP | ... | ... | 0.123 | 0.093 | 0.191 | 0.134 | 0.194 | |||||
| Free Cash Flow Per Share | GBP | ... | ... | 0.050 | 0.079 | 0.204 | 0.104 | ... | ... | ... | |||
| Book Value Per Share | GBP | ... | ... | 0.657 | 0.629 | 0.620 | 0.625 | 0.682 | |||||
| Dividend Per Share | GBP | ... | ... | 6.63 | 6.16 | 4.95 | 1.00 | 3.40 | |||||
| EV/Sales | ... | ... | 0.517 | 0.445 | 0.855 | 1.06 | 0.514 | ||||||
| EV/EBIT | ... | ... | 10.0 | 8.45 | 14.0 | 40.6 | 9.32 | ||||||
| EV/Free Cash Flow | ... | ... | 21.0 | 11.1 | 8.26 | 17.2 | ... | ... | ... | ||||
| EV/Capital Employed | ... | ... | 1.06 | 0.971 | 1.15 | 1.22 | ... | ... | ... | ||||
| Earnings Per Share Growth | % | ... | ... | ... | -48.6 | -42.8 | 84.4 | -75.6 | 272 | ||||
| Cash Earnings Per Share Growth | % | ... | ... | ... | -35.4 | -24.7 | 106 | -30.2 | 45.4 | ||||
| Book Value Per Share Growth | % | ... | ... | ... | 2.84 | -4.29 | -1.32 | 0.734 | 9.22 |
Get all company financials in excel:


By Helgi Library - December 14, 2021
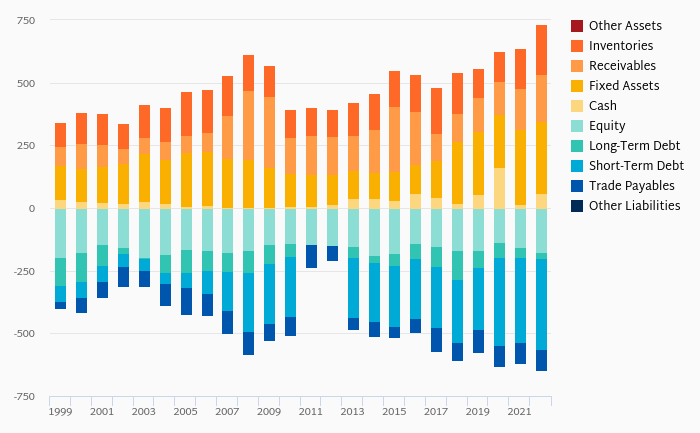
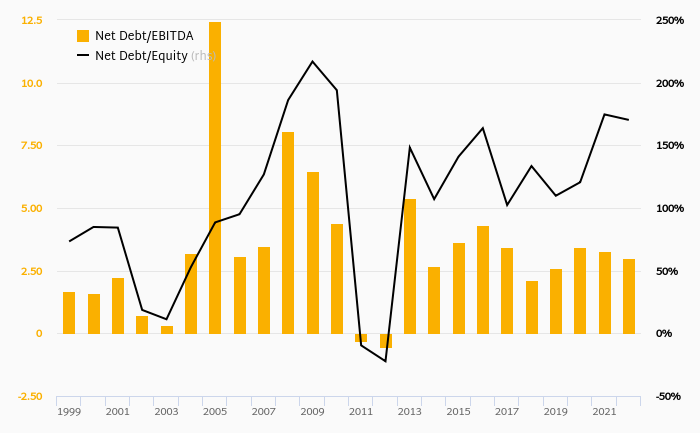
Epwin Group's net debt stood at GBP 99.3 mil and accounted for 111% of equity at the end of 2020. The ratio is up 14.2 pp compared to the previous year. Historically, the firm’s net debt to equity reached a high of 111% in 2020 and a low of ...
By Helgi Library - December 13, 2021
Epwin Group invested a total of GBP 3.20 mil in 2020, down 62.8% compared to the previous year. Historically, between 2016 - 2020, the company's investments stood at a high of GBP 12.7 mil in 2016 and a low of GBP 3.20 mil in 2020. A...
By Helgi Library - December 13, 2021
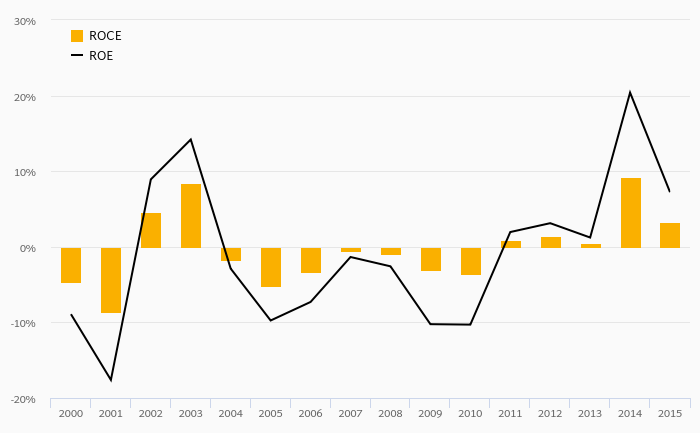
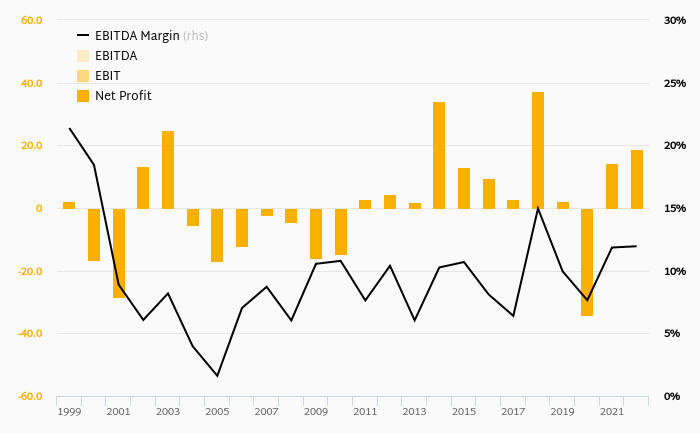
Epwin Group made a net profit of GBP 2.60 mil with revenues of GBP 241 mil in 2020, down by 75.7% and down by 14.6%, respectively, compared to the previous year. This translates into a net margin of 1.08%. Historically, between 2013 and 2020, the f...
By Helgi Library - December 13, 2021
Epwin Group stock traded at GBP 106 per share at the end 2020 implying a market capitalization of USD 206 mil. Since the end of 2015, stock has appreciated by 5.61% implying an annual average growth of 1.10% In absolute terms, the value of the company f...
By Helgi Library - December 13, 2021
Epwin Group stock traded at GBP 106 per share at the end 2020 translating into a market capitalization of USD 206 mil. Since the end of 2015, the stock has appreciated by 5.61% representing an annual average growth of 1.10%. At the end of 2020, the firm...
By Helgi Library - December 13, 2021
Epwin Group employed 2,103 employees in 2019, down 8.72% compared to the previous year. Historically, between 2012 and 2019, the firm's workforce hit a high of 2,592 employees in 2016 and a low of 2,103 employees in 2019. Average personnel cost stoo...
Epwin Group has been growing its sales by 2.86% a year on average in the last 5 years. EBITDA has grown on average by 11.5% a year during that time to total of GBP 41.1 mil in 2023, or 12.7% of sales. That’s compared to 11.9% average margin seen in last five years.
The company netted GBP 13.2 mil in 2023 implying ROE of 12.1% and ROCE of . Again, the average figures were 9.96% and 3.81%, respectively when looking at the previous 5 years.
Epwin Group’s net debt amounted to GBP 1.40 mil at the end of 2023, or 1.25% of equity. When compared to EBITDA, net debt was 0.034x, down when compared to average of 1.40x seen in the last 5 years.
Epwin Group stock traded at GBP 106 per share at the end of 2023 resulting in a market capitalization of USD 197 mil. Over the previous five years, stock price grew by 58.8% or 9.69% a year on average. The closing price put stock at a 12-month trailing EV/EBITDA of 3.71x and price to earnings (PE) of 11.5x as of 2023.
 Helgi Library