By Helgi Library - April 2, 2020
Fresenius Medical Care's total assets reached EUR 26,242 mil at the end of 2018, up 9.23% compared to the previous year. ...
| Profit Statement |
| Balance Sheet |
| Ratios |
| Valuation |
Get all company financials in excel:
Get all company financials in excel:


Fresenius Medical Care has been growing its sales by a year on average in the last 5 years. EBITDA has grown on average by 5.9% a year during that time to total of EUR 2,880 mil in 2018, or 17.4% of sales. That’s compared to 17.9% average margin seen in last five years.
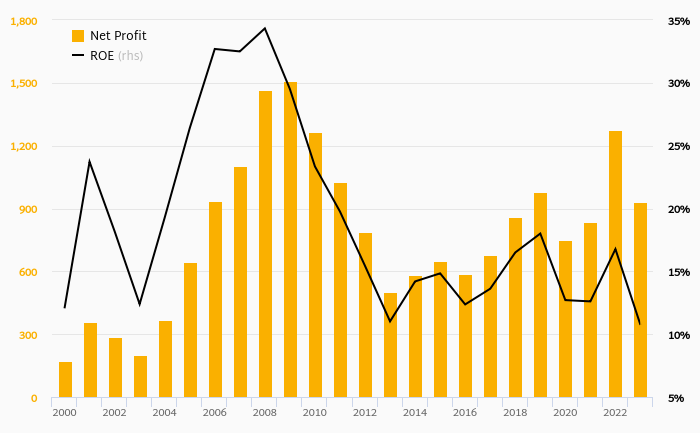
The company netted EUR 1,982 mil in 2018 implying ROE of 16.7% and ROCE of 9.43%. Again, the average figures were 11.4% and 6.24%, respectively when looking at the previous 5 years.
Fresenius Medical Care’s net debt amounted to EUR 5,401 mil at the end of 2018, or 0.419 of equity. When compared to EBITDA, net debt was 1.88x, down when compared to average of 2.50x seen in the last 5 years.
Fresenius Medical Care stock traded at EUR 56.6 per share at the end of 2018 resulting in a market capitalization of USD 19,901 mil. Over the previous five years, stock price grew by 10.5% or 2.01% a year on average. The closing price put stock at a 12-month trailing EV/EBITDA of 7.73x and price to earnings (PE) of 8.77x as of 2018.
 Helgi Library