By Helgi Library - October 12, 2020
Hino Motors's total assets reached JPY 1,240 bil at the end of 2Q2020, down 4.8% compared to the previous year. Cu...
By Helgi Library - September 27, 2020
Hino Motors generated sales of JPY 300 bil in 2Q2020, down 32.7% compared to the previous year. Historically, between 2...
By Helgi Library - September 27, 2020
Hino Motors made a net profit of JPY 1.53 bil with revenues of JPY 441 bil in 1Q2020, down by 91% and down by 15.4%, ...
| Profit Statement |
| Balance Sheet |
| Ratios |
| Valuation |
Get all company financials in excel:
Get all company financials in excel:


By Helgi Library - September 27, 2020
Hino Motors's operating cash flow stood at JPY 14.2 bil in 1Q2020, up 9.79% when compared to the previous year. Historically, between 2Q1999 - 1Q2020, the firm’s operating cash flow reached a high of JPY 43.1 bil in 1Q2010 and a low of JPY -32.0 bil ...
By Helgi Library - September 27, 2020
Hino Motors employed 34,548 employees in 2019, up 1.41% compared to the previous year. Historically, between 1999 and 2019, the firm's workforce hit a high of 34,548 employees in 2019 and a low of 20,560 employees in 2003. Average personnel cost stoo...
By Helgi Library - September 27, 2020
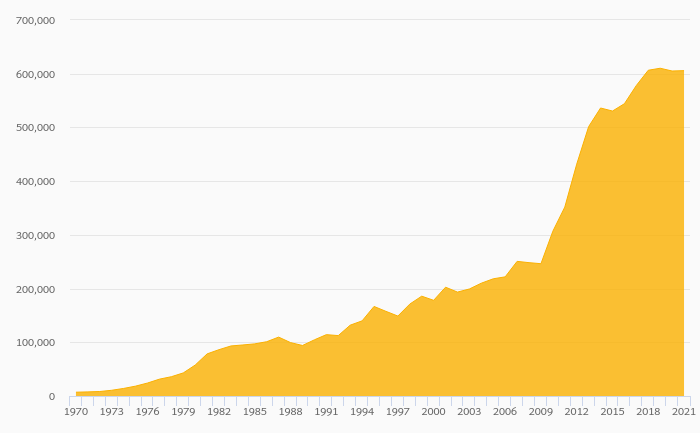
Hino Motors made a net profit of JPY 47.0 bil with revenues of JPY 1,896 bil in 2019, down by 6.09% and down by 3.74%, respectively, compared to the previous year. This translates into a net margin of 2.48%. Historically, between 1995 - 2019, the...
By Helgi Library - September 27, 2020
Hino Motors stock traded at JPY 909 per share at the end 2019 translating into a market capitalization of USD 4,829 mil. Since the end of 2014, stock has depreciated by 31.2% representing an annual average growth of -7.20%. In absolute terms, the value ...
By Helgi Library - September 27, 2020
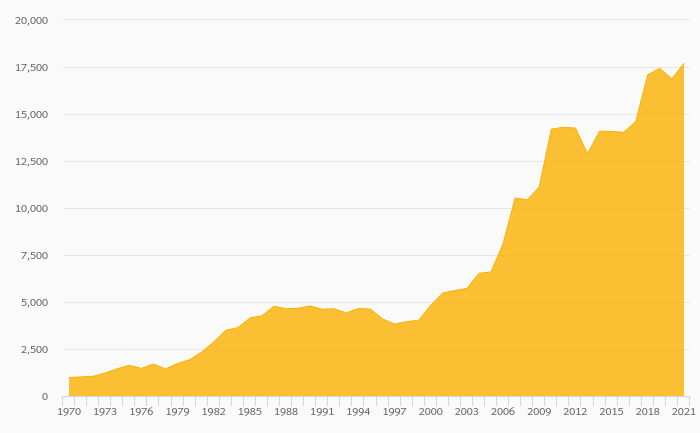
Hino Motors's net debt stood at JPY 188 bil and accounted for 30.3% of equity at the end of 2019. The ratio is down 0.919 pp compared to the previous year. Historically, the firm’s net debt to equity reached a high of 443% in 2000 and a low of ...
By Helgi Library - September 27, 2020
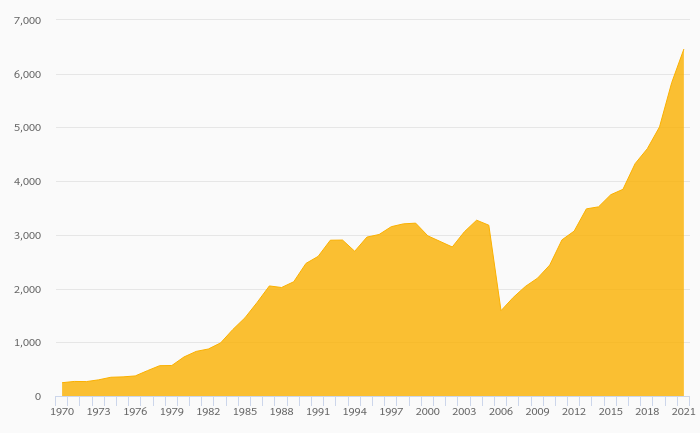
Hino Motors made a net profit of JPY 47.0 bil in 2019, down 6.09% compared to the previous year. Historically, between 1995 and 2019, the company's net profit reached a high of JPY 83.0 bil in 2014 and a low of JPY -71.2 bil in 2009. The result implies a ...
By Helgi Library - September 27, 2020
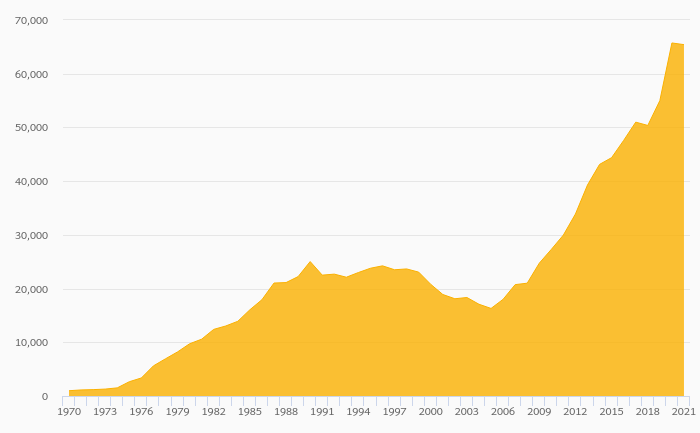
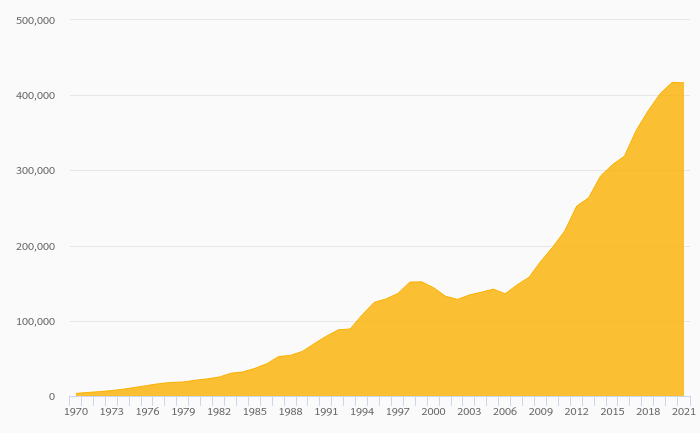
Hino Motors's total assets reached JPY 1,286 bil at the end of 2019, up 0.173% compared to the previous year. Current assets amounted to JPY 661 bil, or 51.4% of total assets while cash stood at JPY 36.9 bil at the end of 2019. ...
By Helgi Library - September 27, 2020
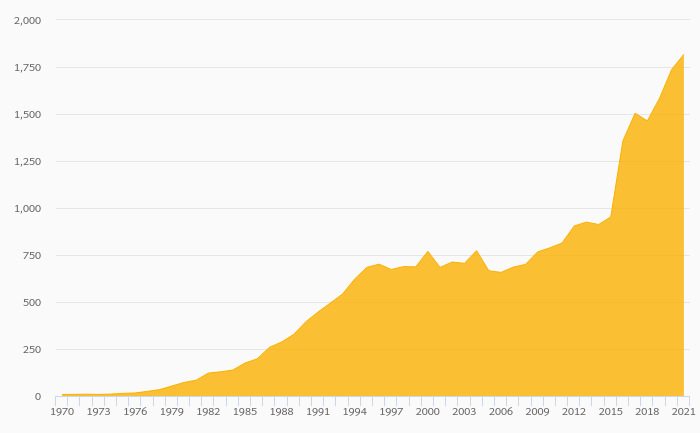
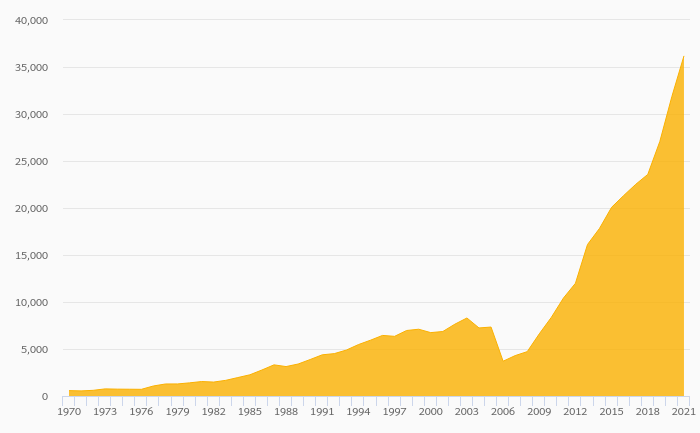
Hino Motors's operating cash flow stood at JPY 94.0 bil in 2019, up 57.5% when compared to the previous year. Historically, between 2000 - 2019, the firm’s operating cash flow reached a high of JPY 132 bil in 2013 and a low of JPY 30.5 bil in 2000....
By Helgi Library - September 27, 2020
Hino Motors stock traded at JPY 909 per share at the end 2019 implying a market capitalization of USD 4,829 mil. Since the end of 2014, stock has appreciated by -31.2% implying an annual average growth of -7.20% In absolute terms, the value of the company ...
By Helgi Library - September 27, 2020
Hino Motors made a net profit of JPY 47.0 bil with revenues of JPY 1,896 bil in 2019, down by 6.09% and down by 3.74%, respectively, compared to the previous year. This translates into a net margin of 2.48%. Historically, between 1995 and 2019, the ...
Hino Motors Ltd. is a Japan-based manufacturing company. The Company is based in Hino, Tokyo, Japan and is engaged in the manufacture and sale of trucks, buses and other automobiles, as well as the entrusted manufacture according to the order from Toyota Motor Corporation. Worldwide sales of Hino-brand trucks and buses total about 150,000 vehicles a year. The Hino Brand is almost 80 years old and is recognized globally as the 3rd largest truck manufacturer in the world. The company is No. 1 producer in Japan, has a strong market share in South East Asia and has been increasingly focusing on the US market when leveraging the experience and success of Toyota Motor Corporation there

Hino Motors has been growing its sales by 2.61% a year on average in the last 5 years. EBITDA has fallen on average by 2.1% a year during that time to total of JPY 130 bil in 2019, or 6.87% of sales. That’s compared to 7.52% average margin seen in last five years.
The company netted JPY 47.0 bil in 2019 implying ROE of 7.91% and ROCE of 5.11%. Again, the average figures were 10.5% and 6.61%, respectively when looking at the previous 5 years.
Hino Motors’s net debt amounted to JPY 188 bil at the end of 2019, or 30.3% of equity. When compared to EBITDA, net debt was 1.44x, up when compared to average of 1.18x seen in the last 5 years.
Hino Motors stock traded at JPY 909 per share at the end of 2019 resulting in a market capitalization of USD 4,829 mil. Over the previous five years, stock price fell by 31.2% or -7.20% a year on average. The closing price put stock at a 12-month trailing EV/EBITDA of 4.08x and price to earnings (PE) of 9.50x as of 2019.
 Helgi Library