By Helgi Library - May 11, 2022
Mex Polska made a net profit of PLN 7.33 mil with revenues of PLN 47.2 mil in 2021, up by 171% and up by 12.6%, res...
By Helgi Library - May 11, 2022
Mex Polska stock traded at PLN 2.30 per share at the end 2021 translating into a market capitalization of USD 5.02 mil. Since the...
By Helgi Library - May 11, 2022
Mex Polska made a net profit of PLN 7.33 mil with revenues of PLN 47.2 mil in 2021, up by 171% and up by 12.6%, respectively...
| Profit Statement | 2019 | 2020 | 2021 | |
| Sales | PLN mil | 75.3 | 41.9 | 47.2 |
| Gross Profit | PLN mil | 11.5 | -0.435 | 6.09 |
| EBITDA | PLN mil | 12.6 | -2.59 | 15.7 |
| EBIT | PLN mil | 4.14 | -9.86 | 5.01 |
| Financing Cost | PLN mil | 1.73 | 1.35 | 1.26 |
| Pre-Tax Profit | PLN mil | 2.50 | -12.5 | 7.28 |
| Net Profit | PLN mil | 1.39 | -10.3 | 7.33 |
| Dividends | PLN mil | 0 | 0 | ... |
| Balance Sheet | 2019 | 2020 | 2021 | |
| Total Assets | PLN mil | 68.0 | 54.8 | 66.0 |
| Non-Current Assets | PLN mil | 59.3 | 47.1 | 54.1 |
| Current Assets | PLN mil | 8.76 | 7.66 | 11.9 |
| Working Capital | PLN mil | -0.025 | -1.96 | -1.64 |
| Shareholders' Equity | PLN mil | 14.0 | 2.12 | 7.95 |
| Liabilities | PLN mil | 54.0 | 52.7 | 58.2 |
| Total Debt | PLN mil | 43.3 | 43.6 | 48.7 |
| Net Debt | PLN mil | 40.0 | 39.2 | 39.9 |
| Ratios | 2019 | 2020 | 2021 | |
| ROE | % | 10.6 | -128 | 123 |
| ROCE | % | 2.51 | -19.7 | 15.0 |
| Gross Margin | % | 15.3 | -1.04 | 12.9 |
| EBITDA Margin | % | 16.7 | -6.19 | 33.3 |
| EBIT Margin | % | 5.50 | -23.5 | 10.6 |
| Net Margin | % | 1.85 | -24.6 | 15.5 |
| Net Debt/EBITDA | 3.17 | -15.1 | 2.53 | |
| Net Debt/Equity | % | 285 | 1,850 | 501 |
| Cost of Financing | % | 4.20 | 3.11 | 2.74 |
| Valuation | 2019 | 2020 | 2021 | |
| Market Capitalisation | USD mil | 5.99 | 2.77 | 5.02 |
| Enterprise Value (EV) | USD mil | 16.5 | 13.3 | 14.9 |
| Number Of Shares | mil | 8.82 | 8.82 | 8.82 |
| Share Price | PLN | 2.96 | 1.35 | 2.30 |
| EV/EBITDA | 4.95 | -19.9 | 3.63 | |
| EV/Sales | 0.829 | 1.23 | 1.21 | |
| Price/Earnings (P/E) | 18.5 | -1.01 | 3.28 | |
| Price/Book Value (P/BV) | 1.86 | 5.62 | 2.55 | |
| Dividend Yield | % | 6.42 | 14.1 | ... |
Get all company financials in excel:
| overview | Unit | 2008 | 2009 | 2010 | 2011 | 2012 | 2013 | 2014 | 2015 | 2016 | 2017 | 2018 | 2019 | 2020 | 2021 |
| income statement | |||||||||||||||
| Sales | PLN mil | 52.3 | 58.9 | 64.4 | 66.5 | 75.3 | |||||||||
| Gross Profit | PLN mil | 7.39 | 8.35 | 9.07 | 10.0 | 11.5 | |||||||||
| EBIT | PLN mil | 4.12 | 4.84 | 4.77 | 5.53 | 4.14 | |||||||||
| Net Profit | PLN mil | 4.22 | 3.70 | 3.84 | 2.62 | 1.39 | |||||||||
| ROE | % | 41.0 | 26.1 | 24.7 | 18.4 | 10.6 | |||||||||
| EBIT Margin | % | 7.88 | 8.22 | 7.40 | 8.31 | 5.50 | |||||||||
| Net Margin | % | 8.07 | 6.28 | 5.96 | 3.94 | 1.85 | |||||||||
| Employees | 132 | 161 | 207 | 204 | 232 | ... | |||||||||
| balance sheet | |||||||||||||||
| Total Assets | PLN mil | 27.9 | 29.3 | 29.2 | 59.5 | 68.0 | |||||||||
| Non-Current Assets | PLN mil | 20.8 | 22.4 | 22.2 | 52.4 | 59.3 | |||||||||
| Current Assets | PLN mil | 7.18 | 6.94 | 7.04 | 7.16 | 8.76 | |||||||||
| Shareholders' Equity | PLN mil | 13.4 | 14.9 | 16.1 | 12.4 | 14.0 | |||||||||
| Liabilities | PLN mil | 14.5 | 14.4 | 13.1 | 47.2 | 54.0 | |||||||||
| Non-Current Liabilities | PLN mil | 6.24 | 4.96 | 4.20 | 30.3 | 34.5 | |||||||||
| Current Liabilities | PLN mil | 8.25 | 9.45 | 8.88 | 16.9 | 19.5 | |||||||||
| Net Debt/EBITDA | 0.706 | 0.700 | 0.463 | 2.72 | 3.17 | ||||||||||
| Net Debt/Equity | % | 29.5 | 30.2 | 17.1 | 285 | 285 | |||||||||
| Cost of Financing | % | 7.13 | 5.82 | 6.87 | 7.23 | 4.20 | |||||||||
| cash flow | |||||||||||||||
| Total Cash From Operations | PLN mil | 4.66 | 4.73 | 4.92 | 9.61 | 10.5 | |||||||||
| Total Cash From Investing | PLN mil | -4.88 | -2.60 | -0.781 | -1.88 | -3.31 | |||||||||
| Total Cash From Financing | PLN mil | 2.71 | -3.44 | -3.54 | -7.53 | -7.90 | |||||||||
| Net Change In Cash | PLN mil | 2.49 | -1.31 | 0.600 | 0.200 | -0.710 | |||||||||
| valuation | |||||||||||||||
| Market Capitalisation | USD mil | ... | ... | ... | ... | 8.59 | 12.2 | 9.16 | 7.88 | 5.99 | |||||
| Enterprise Value (EV) | USD mil | ... | ... | ... | ... | 9.60 | 13.3 | 9.95 | 17.3 | 16.5 | |||||
| Number Of Shares | mil | ... | ... | ... | ... | 7.67 | 7.67 | 7.67 | 7.67 | 8.82 | |||||
| Share Price | PLN | ... | ... | ... | ... | 3.61 | 5.73 | 3.75 | 3.62 | 2.96 | |||||
| Price/Earnings (P/E) | ... | ... | ... | ... | 6.56 | 11.9 | 7.50 | 10.6 | 18.5 | ||||||
| Price/Cash Earnings (P/CE) | ... | ... | ... | ... | ... | ... | ... | 4.84 | 8.31 | 5.74 | 4.07 | 2.65 | |||
| EV/EBITDA | ... | ... | ... | ... | 6.36 | 8.34 | 6.41 | 4.85 | 4.95 | ||||||
| Price/Book Value (P/BV) | ... | ... | ... | ... | 2.06 | 2.95 | 1.78 | 2.24 | 1.86 | ||||||
| Dividend Yield | % | ... | ... | ... | ... | 9.15 | 5.76 | 8.53 | 4.70 | 6.42 | ... |
| income statement | Unit | 2008 | 2009 | 2010 | 2011 | 2012 | 2013 | 2014 | 2015 | 2016 | 2017 | 2018 | 2019 | 2020 | 2021 |
| income statement | |||||||||||||||
| Sales | PLN mil | 52.3 | 58.9 | 64.4 | 66.5 | 75.3 | |||||||||
| Cost of Goods & Services | PLN mil | 44.9 | 50.5 | 55.4 | 56.5 | 63.8 | |||||||||
| Gross Profit | PLN mil | 7.39 | 8.35 | 9.07 | 10.0 | 11.5 | |||||||||
| Selling, General & Admin | PLN mil | ... | ... | ... | ... | ... | ... | 3.55 | 4.35 | 4.77 | 5.05 | 6.42 | ... | ||
| Research & Development | PLN mil | ... | ... | ... | ... | ... | 0 | 0 | 0 | 0 | 0 | ... | |||
| Other Operating Expense | PLN mil | ... | ... | ... | ... | ... | ... | ... | ... | ... | 0.512 | 0.188 | 1.52 | ... | |
| Staff Cost | PLN mil | 13.8 | 16.3 | 20.7 | 21.9 | 26.5 | ... | ||||||||
| Other Operating Cost (Income) | PLN mil | 0.382 | 0.462 | 1.06 | 0.855 | 0.650 | ... | ||||||||
| EBITDA | PLN mil | 5.62 | 6.44 | 5.94 | 12.9 | 12.6 | |||||||||
| Depreciation | PLN mil | ... | ... | ... | ... | ... | ... | ... | 1.49 | 1.59 | 1.17 | 4.19 | 8.45 | ||
| EBIT | PLN mil | 4.12 | 4.84 | 4.77 | 5.53 | 4.14 | |||||||||
| Net Financing Cost | PLN mil | ... | ... | ... | ... | 0.444 | 0.358 | 0.445 | 1.63 | 1.72 | |||||
| Financing Cost | PLN mil | 0.514 | 0.470 | 0.486 | 1.65 | 1.73 | |||||||||
| Financing Income | PLN mil | ... | ... | 0.070 | 0.112 | 0.041 | 0.015 | 0.013 | |||||||
| FX (Gain) Loss | PLN mil | ... | ... | ... | ... | < 0.001 | < 0.001 | < 0.001 | 0.117 | -0.053 | |||||
| (Income) / Loss from Affiliates | PLN mil | ... | ... | ... | ... | ... | ... | ... | ... | ... | ... | ... | ... | ... | |
| Extraordinary Cost | PLN mil | 0 | 0 | 0 | 0 | 0 | |||||||||
| Pre-Tax Profit | PLN mil | 4.38 | 4.35 | 4.65 | 3.94 | 2.50 | |||||||||
| Tax | PLN mil | 0.321 | 0.614 | 0.933 | 1.44 | 0.512 | |||||||||
| Minorities | PLN mil | -0.158 | 0.035 | -0.123 | -0.130 | 0.597 | |||||||||
| Net Profit | PLN mil | 4.22 | 3.70 | 3.84 | 2.62 | 1.39 | |||||||||
| Net Profit Avail. to Common | PLN mil | 4.22 | 3.70 | 3.84 | 2.62 | 1.39 | |||||||||
| Dividends | PLN mil | 2.53 | 2.45 | 1.30 | 0 | 0 | ... | ||||||||
| growth rates | |||||||||||||||
| Total Revenue Growth | % | ... | 10.00 | 12.6 | 9.40 | 3.27 | 13.2 | ||||||||
| Operating Cost Growth | % | ... | -23.7 | 8.51 | 35.4 | -0.827 | 50.5 | ... | |||||||
| Staff Cost Growth | % | ... | 24.5 | 17.4 | 27.4 | 6.01 | 20.7 | ... | |||||||
| EBITDA Growth | % | ... | 97.9 | 14.5 | -7.66 | 117 | -2.47 | ||||||||
| EBIT Growth | % | ... | 291 | 17.5 | -1.56 | 16.0 | -25.2 | ||||||||
| Pre-Tax Profit Growth | % | ... | -550 | -0.785 | 6.88 | -15.3 | -36.4 | ||||||||
| Net Profit Growth | % | ... | -372 | -12.3 | 3.75 | -31.7 | -46.9 | ||||||||
| ratios | |||||||||||||||
| ROE | % | 41.0 | 26.1 | 24.7 | 18.4 | 10.6 | |||||||||
| ROA | % | 17.5 | 12.9 | 13.1 | 5.91 | 2.19 | |||||||||
| ROCE | % | 26.9 | 17.3 | 17.1 | 7.11 | 2.51 | |||||||||
| Gross Margin | % | 14.1 | 14.2 | 14.1 | 15.0 | 15.3 | |||||||||
| EBITDA Margin | % | 10.7 | 10.9 | 9.23 | 19.4 | 16.7 | |||||||||
| EBIT Margin | % | 7.88 | 8.22 | 7.40 | 8.31 | 5.50 | |||||||||
| Net Margin | % | 8.07 | 6.28 | 5.96 | 3.94 | 1.85 | |||||||||
| Payout Ratio | % | 59.9 | 66.3 | 34.0 | 0 | 0 | ... | ||||||||
| Cost of Financing | % | 7.13 | 5.82 | 6.87 | 7.23 | 4.20 | |||||||||
| Net Debt/EBITDA | 0.706 | 0.700 | 0.463 | 2.72 | 3.17 |
| balance sheet | Unit | 2008 | 2009 | 2010 | 2011 | 2012 | 2013 | 2014 | 2015 | 2016 | 2017 | 2018 | 2019 | 2020 | 2021 |
| balance sheet | |||||||||||||||
| Cash & Cash Equivalents | PLN mil | 4.45 | 3.14 | 3.74 | 3.94 | 3.32 | |||||||||
| Receivables | PLN mil | 0.936 | 1.86 | 1.39 | 0.951 | 1.75 | |||||||||
| Inventories | PLN mil | 1.08 | 1.31 | 0.854 | 0.874 | 1.10 | |||||||||
| Other ST Assets | PLN mil | 0.655 | 0.629 | 1.05 | 1.39 | 2.59 | |||||||||
| Current Assets | PLN mil | 7.18 | 6.94 | 7.04 | 7.16 | 8.76 | |||||||||
| Property, Plant & Equipment | PLN mil | 7.99 | 9.13 | 9.44 | 40.2 | 45.3 | |||||||||
| LT Investments & Receivables | PLN mil | 1.20 | 1.29 | 1.30 | 1.29 | 1.22 | |||||||||
| Intangible Assets | PLN mil | 9.11 | 9.41 | 9.41 | 9.41 | 9.55 | |||||||||
| Goodwill | PLN mil | 9.09 | 9.40 | 9.40 | 9.40 | 9.53 | |||||||||
| Non-Current Assets | PLN mil | 20.8 | 22.4 | 22.2 | 52.4 | 59.3 | |||||||||
| Total Assets | PLN mil | 27.9 | 29.3 | 29.2 | 59.5 | 68.0 | |||||||||
| Trade Payables | PLN mil | 2.85 | 2.76 | 2.36 | 2.47 | 2.88 | |||||||||
| Short-Term Debt | PLN mil | 2.61 | 2.99 | 2.55 | 9.95 | 11.4 | |||||||||
| Other ST Liabilities | PLN mil | 2.80 | 3.70 | 1.65 | 2.53 | 3.00 | |||||||||
| Current Liabilities | PLN mil | 8.25 | 9.45 | 8.88 | 16.9 | 19.5 | |||||||||
| Long-Term Debt | PLN mil | 5.87 | 4.66 | 3.95 | 29.2 | 31.9 | |||||||||
| Other LT Liabilities | PLN mil | 0.367 | 0.298 | 0.253 | 1.11 | 2.64 | |||||||||
| Non-Current Liabilities | PLN mil | 6.24 | 4.96 | 4.20 | 30.3 | 34.5 | |||||||||
| Liabilities | PLN mil | 14.5 | 14.4 | 13.1 | 47.2 | 54.0 | |||||||||
| Preferred Equity and Hybrid Capital | PLN mil | 0 | 0 | 0 | 0 | 0 | ... | ||||||||
| Share Capital | PLN mil | 0.767 | 0.767 | 14.3 | 14.3 | 14.3 | |||||||||
| Treasury Stock | PLN mil | ... | ... | ... | ... | ... | ... | 0 | 0 | 0 | 0 | 0 | ... | ||
| Equity Before Minority Interest | PLN mil | 13.7 | 14.8 | 16.2 | 12.6 | 13.7 | |||||||||
| Minority Interest | PLN mil | -0.234 | 0.152 | -0.048 | -0.277 | 0.303 | |||||||||
| Equity | PLN mil | 13.4 | 14.9 | 16.1 | 12.4 | 14.0 | |||||||||
| growth rates | |||||||||||||||
| Total Asset Growth | % | ... | 37.1 | 4.95 | -0.370 | 104 | 14.2 | ||||||||
| Shareholders' Equity Growth | % | ... | 88.9 | 11.0 | 8.18 | -23.4 | 13.3 | ||||||||
| Net Debt Growth | % | ... | -1.13 | 13.5 | -38.9 | 1,178 | 13.5 | ||||||||
| Total Debt Growth | % | ... | 43.4 | -9.90 | -15.1 | 503 | 10.6 | ||||||||
| ratios | |||||||||||||||
| Total Debt | PLN mil | 8.49 | 7.65 | 6.49 | 39.1 | 43.3 | |||||||||
| Net Debt | PLN mil | 3.97 | 4.51 | 2.75 | 35.2 | 40.0 | |||||||||
| Working Capital | PLN mil | -0.834 | 0.402 | -0.113 | -0.644 | -0.025 | |||||||||
| Capital Employed | PLN mil | 19.9 | 22.8 | 22.1 | 51.7 | 59.2 | |||||||||
| Net Debt/Equity | % | 29.5 | 30.2 | 17.1 | 285 | 285 | |||||||||
| Current Ratio | 0.870 | 0.734 | 0.793 | 0.424 | 0.449 | ||||||||||
| Quick Ratio | 0.653 | 0.529 | 0.579 | 0.290 | 0.260 |
| cash flow | Unit | 2008 | 2009 | 2010 | 2011 | 2012 | 2013 | 2014 | 2015 | 2016 | 2017 | 2018 | 2019 | 2020 | 2021 |
| cash flow | |||||||||||||||
| Net Profit | PLN mil | 4.22 | 3.70 | 3.84 | 2.62 | 1.39 | |||||||||
| Depreciation | PLN mil | ... | ... | ... | ... | ... | ... | ... | 1.49 | 1.59 | 1.17 | 4.19 | 8.45 | ||
| Non-Cash Items | PLN mil | -0.106 | 0.248 | -1.00 | -0.255 | 3.04 | |||||||||
| Change in Working Capital | PLN mil | -0.952 | -0.811 | 0.908 | -0.142 | -2.40 | |||||||||
| Total Cash From Operations | PLN mil | 4.66 | 4.73 | 4.92 | 9.61 | 10.5 | |||||||||
| Capital Expenditures | PLN mil | ... | ... | ... | ... | ... | ... | ... | ... | ... | -0.781 | -1.93 | -3.23 | ||
| Net Change in LT Investment | PLN mil | 0 | 0 | 0 | -0.153 | -0.076 | ... | ||||||||
| Net Cash From Acquisitions | PLN mil | ... | ... | ... | ... | ... | ... | ... | ... | ... | 0 | 0 | 0 | ... | |
| Other Investing Activities | PLN mil | -4.14 | 0 | 0 | 0.195 | 0 | |||||||||
| Total Cash From Investing | PLN mil | -4.88 | -2.60 | -0.781 | -1.88 | -3.31 | |||||||||
| Dividends Paid | PLN mil | 0 | -2.53 | -2.45 | -1.33 | -1.46 | |||||||||
| Issuance Of Shares | PLN mil | 0 | 0 | 0 | 0 | 0 | |||||||||
| Issuance Of Debt | PLN mil | 2.20 | -0.787 | -1.09 | -6.20 | -6.44 | |||||||||
| Other Financing Activities | PLN mil | 0.508 | -0.126 | 0 | 0 | 0 | ... | ||||||||
| Total Cash From Financing | PLN mil | 2.71 | -3.44 | -3.54 | -7.53 | -7.90 | |||||||||
| Effect of FX Rates | PLN mil | ... | ... | ... | ... | ... | ... | ... | ... | ... | 0 | 0 | 0 | ... | |
| Net Change In Cash | PLN mil | 2.49 | -1.31 | 0.600 | 0.200 | -0.710 | |||||||||
| ratios | |||||||||||||||
| Days Sales Outstanding | days | 6.53 | 11.5 | 7.90 | 5.21 | 8.49 | |||||||||
| Days Sales Of Inventory | days | 8.74 | 9.43 | 5.63 | 5.64 | 6.29 | |||||||||
| Days Payable Outstanding | days | 23.1 | 20.0 | 15.6 | 15.9 | 16.5 | |||||||||
| Cash Conversion Cycle | days | -7.85 | 1.000 | -2.04 | -5.08 | -1.68 | |||||||||
| Cash Earnings | PLN mil | ... | ... | ... | ... | ... | ... | ... | 5.71 | 5.29 | 5.01 | 6.81 | 9.85 | ||
| Free Cash Flow | PLN mil | -0.218 | 2.13 | 4.14 | 7.73 | 7.19 | |||||||||
| Capital Expenditures (As % of Sales) | % | ... | ... | ... | ... | ... | ... | ... | ... | ... | 1.21 | 2.89 | 4.30 |
| other ratios | Unit | 2008 | 2009 | 2010 | 2011 | 2012 | 2013 | 2014 | 2015 | 2016 | 2017 | 2018 | 2019 | 2020 | 2021 |
| Employees | 132 | 161 | 207 | 204 | 232 | ... | |||||||||
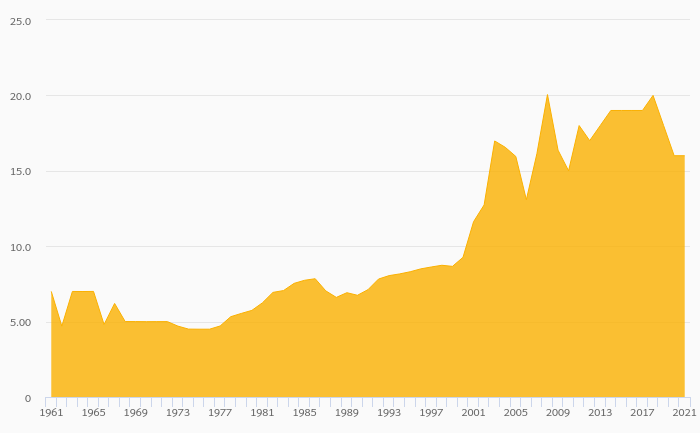
| Cost Per Employee | USD per month | 2,350 | 2,082 | 2,176 | 2,476 | 2,519 | ... | ||||||||
| Cost Per Employee (Local Currency) | PLN per month | 8,742 | 8,414 | 8,335 | 8,966 | 9,517 | ... | ||||||||
| Operating Cost (As % of Sales) | % | 6.99 | 6.73 | 8.33 | 8.00 | 10.6 | ... | ||||||||
| Research & Development (As % of Sales) | % | ... | ... | ... | ... | ... | 0 | 0 | 0 | 0 | 0 | ... | |||
| Staff Cost (As % of Sales) | % | 26.5 | 27.6 | 32.1 | 33.0 | 35.2 | ... | ||||||||
| Effective Tax Rate | % | 7.33 | 14.1 | 20.1 | 36.7 | 20.5 | |||||||||
| Total Revenue Growth (5-year average) | % | ... | ... | ... | ... | ... | ... | ... | ... | ... | 9.81 | 9.35 | 9.63 | ||
| Total Revenue Growth (10-year average) | % | ... | ... | ... | ... | ... | ... | ... | ... | ... | ... | 19.8 | 16.3 |
| valuation | Unit | 2008 | 2009 | 2010 | 2011 | 2012 | 2013 | 2014 | 2015 | 2016 | 2017 | 2018 | 2019 | 2020 | 2021 |
| Market Capitalisation | USD mil | ... | ... | ... | ... | 8.59 | 12.2 | 9.16 | 7.88 | 5.99 | |||||
| Enterprise Value (EV) | USD mil | ... | ... | ... | ... | 9.60 | 13.3 | 9.95 | 17.3 | 16.5 | |||||
| Number Of Shares | mil | ... | ... | ... | ... | 7.67 | 7.67 | 7.67 | 7.67 | 8.82 | |||||
| Share Price | PLN | ... | ... | ... | ... | 3.61 | 5.73 | 3.75 | 3.62 | 2.96 | |||||
| EV/EBITDA | ... | ... | ... | ... | 6.36 | 8.34 | 6.41 | 4.85 | 4.95 | ||||||
| Price/Earnings (P/E) | ... | ... | ... | ... | 6.56 | 11.9 | 7.50 | 10.6 | 18.5 | ||||||
| Price/Cash Earnings (P/CE) | ... | ... | ... | ... | ... | ... | ... | 4.84 | 8.31 | 5.74 | 4.07 | 2.65 | |||
| P/FCF | ... | ... | ... | ... | -127 | 20.6 | 6.94 | 3.59 | 3.63 | ||||||
| Price/Book Value (P/BV) | ... | ... | ... | ... | 2.06 | 2.95 | 1.78 | 2.24 | 1.86 | ||||||
| Dividend Yield | % | ... | ... | ... | ... | 9.15 | 5.76 | 8.53 | 4.70 | 6.42 | ... | ||||
| Free Cash Flow Yield | % | ... | ... | ... | ... | -0.684 | 4.32 | 11.8 | 27.1 | 31.8 | |||||
| Earnings Per Share (EPS) | PLN | ... | ... | ... | ... | 0.550 | 0.480 | 0.500 | 0.340 | 0.160 | |||||
| Cash Earnings Per Share | PLN | ... | ... | ... | ... | ... | ... | ... | 0.744 | 0.690 | 0.654 | 0.888 | 1.12 | ||
| Free Cash Flow Per Share | PLN | ... | ... | ... | ... | -0.028 | 0.278 | 0.540 | 1.01 | 0.815 | |||||
| Book Value Per Share | PLN | ... | ... | ... | ... | 1.75 | 1.95 | 2.11 | 1.61 | 1.59 | |||||
| Dividend Per Share | PLN | ... | ... | ... | ... | 0.330 | 0.330 | 0.320 | 0.170 | 0.190 | ... | ||||
| EV/Sales | ... | ... | ... | ... | 0.683 | 0.911 | 0.592 | 0.941 | 0.829 | ||||||
| EV/EBIT | ... | ... | ... | ... | 8.67 | 11.1 | 8.00 | 11.3 | 15.1 | ||||||
| EV/Free Cash Flow | ... | ... | ... | ... | -164 | 25.2 | 9.20 | 8.11 | 8.69 | ||||||
| EV/Capital Employed | ... | ... | ... | ... | 1.88 | 2.44 | 1.57 | 1.25 | 1.06 | ||||||
| Earnings Per Share Growth | % | ... | ... | ... | ... | ... | -320 | -12.7 | 4.17 | -32.0 | -52.9 | ||||
| Cash Earnings Per Share Growth | % | ... | ... | ... | ... | ... | ... | ... | ... | -7.27 | -5.30 | 35.9 | 25.8 | ||
| Book Value Per Share Growth | % | ... | ... | ... | ... | ... | 56.6 | 11.0 | 8.18 | -23.4 | -1.52 |
Get all company financials in excel:

By Helgi Library - May 11, 2022
Mex Polska stock traded at PLN 2.30 per share at the end 2021 implying a market capitalization of USD 5.02 mil. Since the end of 2016, stock has appreciated by -59.9% implying an annual average growth of -16.7% In absolute terms, the value of the company ...
By Helgi Library - May 11, 2022
Mex Polska stock traded at PLN 2.30 per share at the end 2021 translating into a market capitalization of USD 5.02 mil. Since the end of 2016, the stock has depreciated by 59.9% representing an annual average growth of -16.7%. At the end of 2021, the fir...
By Helgi Library - May 11, 2022
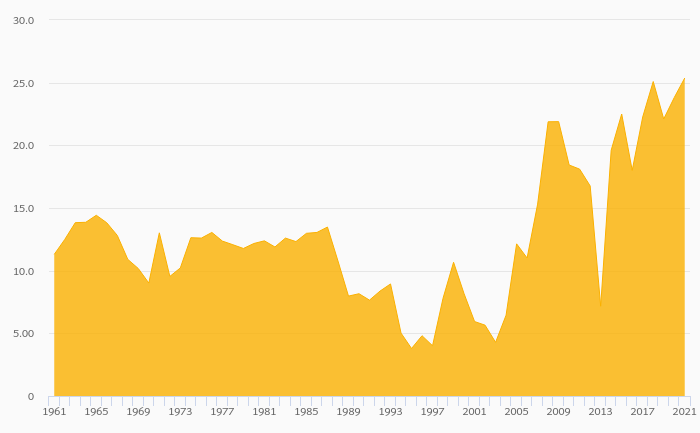
Mex Polska's net debt stood at PLN 39.9 mil and accounted for 501% of equity at the end of 2021. The ratio is down 1,349 pp compared to the previous year. Historically, the firm’s net debt to equity reached a high of 1,850% in 2020 and a low of ...
By Helgi Library - May 11, 2022
Mex Polska made a net profit of PLN 7.33 mil in 2021, up 171% compared to the previous year. Historically, between 2008 and 2021, the company's net profit reached a high of PLN 7.33 mil in 2021 and a low of PLN -10.3 mil in 2020. The result implies a retu...
By Helgi Library - May 11, 2022
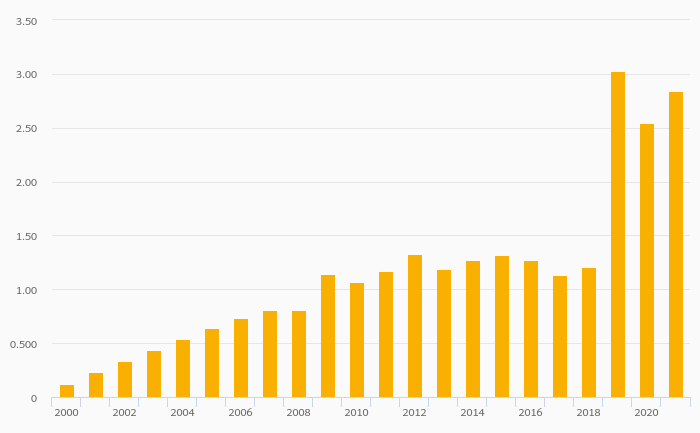
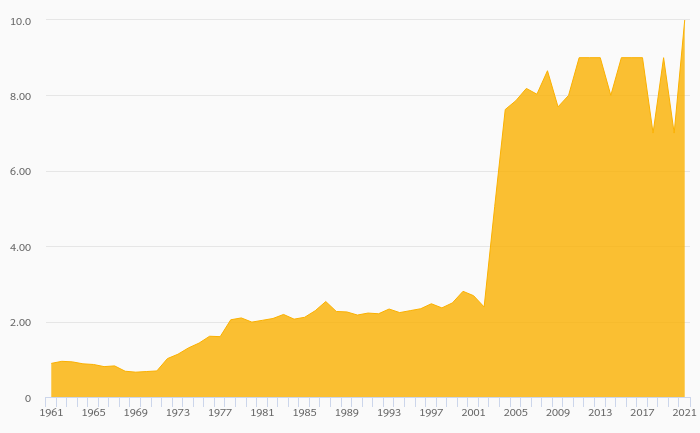
Mex Polska invested a total of PLN 0.087 mil in 2021, down 85.2% compared to the previous year. Historically, between 2017 - 2021, the company's investments stood at a high of PLN 3.23 mil in 2019 and a low of PLN 0.087 mil in 2021. A...
By Helgi Library - May 11, 2022
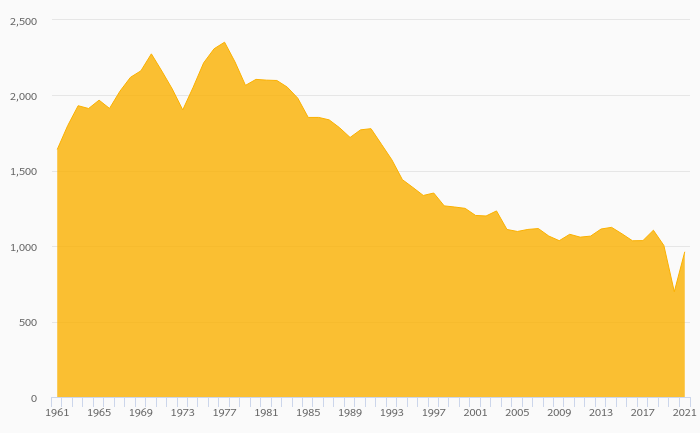
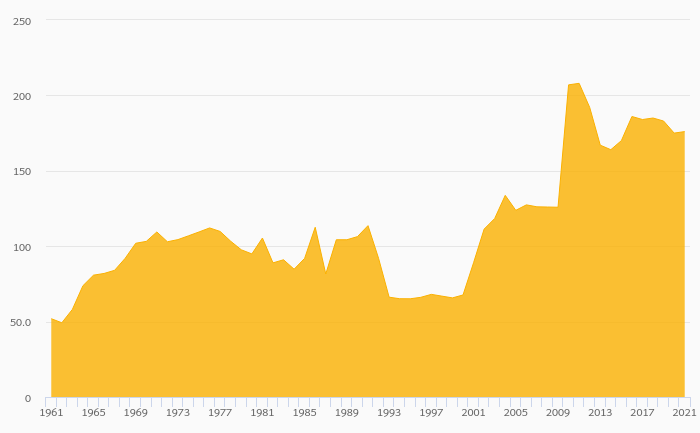
Mex Polska employed 152 employees in 2020, down 34.5% compared to the previous year. Historically, between 2008 and 2020, the firm's workforce hit a high of 386 employees in 2012 and a low of 8.00 employees in 2011. Average personnel cost stood at US...

Mex Polska has been growing its sales by -4.33% a year on average in the last 5 years. EBITDA has grown on average by 19.6% a year during that time to total of PLN 15.7 mil in 2021, or 33.3% of sales. That’s compared to 14.5% average margin seen in last five years.
The company netted PLN 7.33 mil in 2021 implying ROE of 123% and ROCE of 15.0%. Again, the average figures were 9.69% and 4.40%, respectively when looking at the previous 5 years.
Mex Polska’s net debt amounted to PLN 39.9 mil at the end of 2021, or 501% of equity. When compared to EBITDA, net debt was 2.53x, up when compared to average of -1.24x seen in the last 5 years.
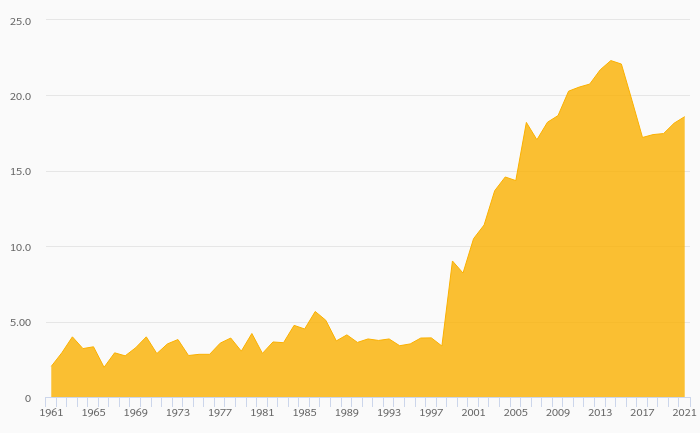
Mex Polska stock traded at PLN 2.30 per share at the end of 2021 resulting in a market capitalization of USD 5.02 mil. Over the previous five years, stock price fell by 59.9% or -16.7% a year on average. The closing price put stock at a 12-month trailing EV/EBITDA of 3.63x and price to earnings (PE) of 3.28x as of 2021.
 Helgi Library