By Helgi Library - April 2, 2020
OMV Petrom's total assets reached RON 41,118 mil at the end of 2015, down 4.65% compared to the previous year. Cur...
| Profit Statement |
| Balance Sheet |
| Ratios |
| Valuation |
Get all company financials in excel:
Get all company financials in excel:


OMV Petrom SA is a Romania-based oil company and the largest corporation in Romania. With activities in Exploration and Production, Gas and Power, and Refining and Marketing, the Petrom Group has proven oil and gas reserves of approximately 775 mn boe in Romania and Kazakhstan (750 mn boe in Romania) providing a maximum annual refining capacity of 4.2 mil tonnes. The Company operates a network of approximately 800 filling stations under two brands, Petrom and OMV, in Romania, the Republic of Moldova, Bulgaria and Serbia. In addition, Petrom is involved in the energy business running a 860 MW gas fired power plant at Brazi and a 45 MW wind park at Dorobantu. The Company was privatized at the end of 2004 and sold to Austrian oil company OMV.
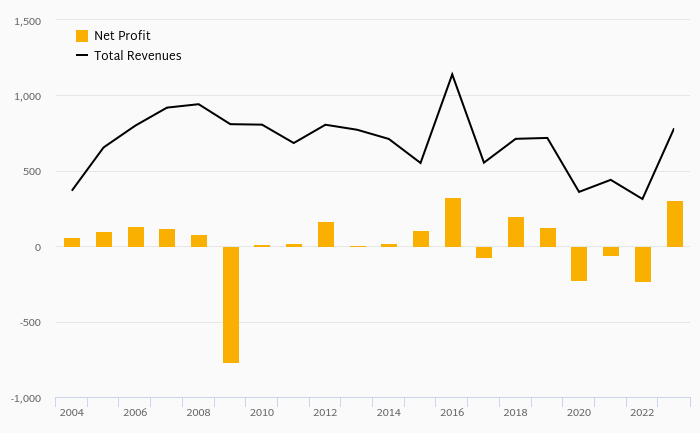
OMV Petrom has been growing its sales by a year on average in the last 5 years. EBITDA has grown on average by 1.46% a year during that time to total of RON 6,231 mil in 2015, or 34.3% of sales. That’s compared to 35.5% average margin seen in last five years.
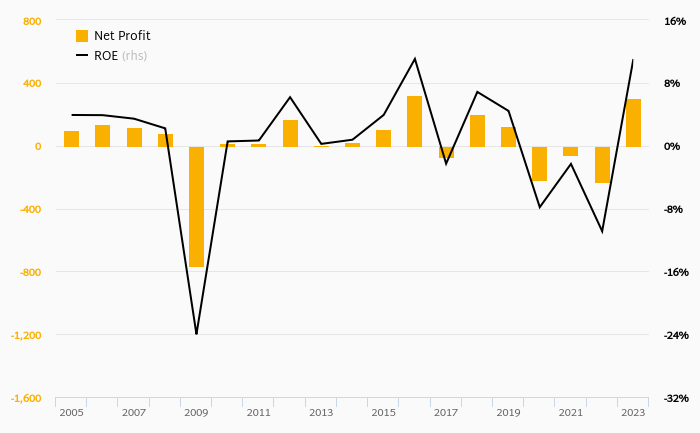
The company netted RON -676 mil in 2015 implying ROE of -2.57% and ROCE of -1.79%. Again, the average figures were 12.3% and 8.42%, respectively when looking at the previous 5 years.
OMV Petrom’s net debt amounted to RON 9,688 mil at the end of 2015, or 0.377 of equity. When compared to EBITDA, net debt was 1.55x, up when compared to average of 1.07x seen in the last 5 years.
OMV Petrom stock traded at RON 0.290 per share at the end of 2015 resulting in a market capitalization of USD 4,434 mil. Over the previous five years, stock price fell by 13.4% or -2.84% a year on average. The closing price put stock at a 12-month trailing EV/EBITDA of 3.93x and price to earnings (PE) of -24.3x as of 2015.
 Helgi Library