By Helgi Library - April 2, 2020
Provident Financial's total assets reached GBP 2,921 mil at the end of 2018, down 1.51% compared to the previous year. ...
| Profit Statement |
| Balance Sheet |
| Ratios |
| Valuation |
Get all company financials in excel:
Get all company financials in excel:


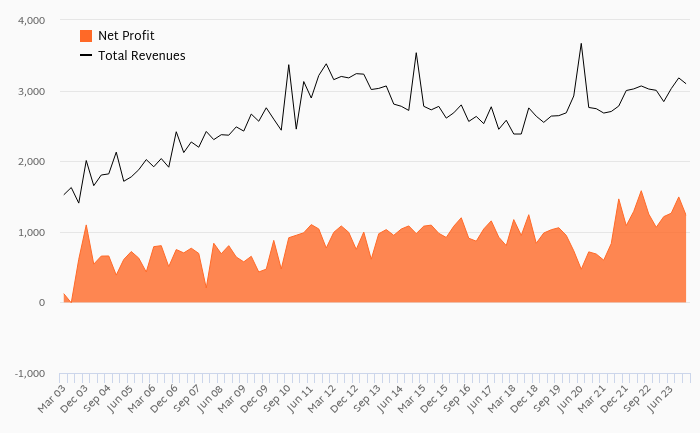

Provident Financial has been growing its sales by a year on average in the last 5 years. EBITDA has fallen on average by 5.64% a year during that time to total of GBP 212 mil in 2018, or 18.8% of sales. That’s compared to 26.7% average margin seen in last five years.
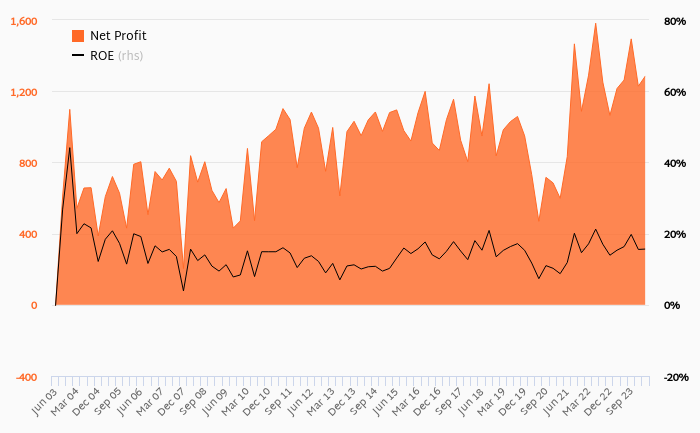
The company netted GBP 60.3 mil in 2018 implying ROE of 9.80% and ROCE of 12.0%. Again, the average figures were 18.4% and 43.9%, respectively when looking at the previous 5 years.
Provident Financial’s net debt amounted to GBP 1,620 mil at the end of 2018, or 2.33 of equity. When compared to EBITDA, net debt was 7.65x, up when compared to average of 5.86x seen in the last 5 years.
Provident Financial stock traded at GBP 6.06 per share at the end of 2018 resulting in a market capitalization of USD 1,849 mil. Over the previous five years, stock price fell by 49.6% or -12.8% a year on average. The closing price put stock at a 12-month trailing EV/EBITDA of 14.1x and price to earnings (PE) of 24.2x as of 2018.
 Helgi Library