By Helgi Library - December 5, 2020
Q-PAP made a net profit of CZK 0.929 mil with revenues of CZK 28.7 mil in 2019, down by 35.3% and down by 7.71%, re...
By Helgi Library - December 5, 2020
Q-PAP made a net profit of CZK 0.929 mil with revenues of CZK 28.7 mil in 2019, down by 35.3% and down by 7.71%, respectivel...
By Helgi Library - December 5, 2020
Q-PAP's net debt stood at CZK 1.65 mil and accounted for 31.3% of equity at the end of 2019. The ratio is down 5.52 pp ...
| Profit Statement | 2017 | 2018 | 2019 | |
| Sales | CZK mil | 33.3 | 31.1 | 28.7 |
| Gross Profit | CZK mil | 9.61 | 9.91 | 9.42 |
| EBITDA | CZK mil | 2.52 | 2.72 | 2.14 |
| EBIT | CZK mil | 1.93 | 2.18 | 1.46 |
| Financing Cost | CZK mil | 0.559 | 0.256 | 0.259 |
| Pre-Tax Profit | CZK mil | 1.27 | 1.78 | 1.15 |
| Net Profit | CZK mil | 0.952 | 1.44 | 0.929 |
| Balance Sheet | 2017 | 2018 | 2019 | |
| Total Assets | CZK mil | 13.5 | 15.1 | 13.7 |
| Non-Current Assets | CZK mil | 4.01 | 4.22 | 4.33 |
| Current Assets | CZK mil | 9.51 | 10.9 | 9.34 |
| Working Capital | CZK mil | 2.67 | 2.46 | 3.11 |
| Shareholders' Equity | CZK mil | 2.89 | 4.33 | 5.25 |
| Liabilities | CZK mil | 10.6 | 10.8 | 8.45 |
| Total Debt | CZK mil | 1.23 | 5.97 | 4.86 |
| Net Debt | CZK mil | -1.86 | 1.59 | 1.65 |
| Ratios | 2017 | 2018 | 2019 | |
| ROE | % | 39.4 | 39.8 | 19.4 |
| ROCE | % | 17.0 | 21.5 | 13.2 |
| Gross Margin | % | 28.9 | 31.9 | 32.9 |
| EBITDA Margin | % | 7.58 | 8.77 | 7.45 |
| EBIT Margin | % | 5.81 | 7.02 | 5.07 |
| Net Margin | % | 2.86 | 4.62 | 3.24 |
| Net Debt/EBITDA | -0.737 | 0.585 | 0.770 | |
| Net Debt/Equity | % | -64.3 | 36.8 | 31.3 |
| Cost of Financing | % | 78.1 | 7.11 | 4.78 |
| Cash Flow | 2017 | 2018 | 2019 | |
| Total Cash From Operations | CZK mil | -1.30 | -3.78 | -0.625 |
| Total Cash From Investing | CZK mil | -0.336 | 0.325 | 0.573 |
| Total Cash From Financing | CZK mil | 1.03 | 4.74 | -1.11 |
| Net Change In Cash | CZK mil | -0.610 | 1.29 | -1.16 |
| Cash Conversion Cycle | days | 30.4 | 31.0 | 48.9 |
| Cash Earnings | CZK mil | 1.54 | 1.98 | 1.61 |
| Free Cash Flow | CZK mil | -1.64 | -3.45 | -0.052 |
Get all company financials in excel:
| overview | Unit | 2008 | 2009 | 2010 | 2011 | 2012 | 2013 | 2014 | 2015 | 2016 | 2017 | 2018 | 2019 |
| income statement | |||||||||||||
| Sales | CZK mil | 36.8 | 34.0 | 34.3 | 34.1 | 33.3 | |||||||
| Gross Profit | CZK mil | 9.28 | 8.71 | 8.94 | 8.68 | 9.61 | |||||||
| EBIT | CZK mil | 1.79 | 1.35 | 1.19 | 0.768 | 1.93 | |||||||
| Net Profit | CZK mil | 0.322 | 0.299 | 0.282 | 0.517 | 0.952 | |||||||
| ROE | % | 14.2 | 11.6 | 9.87 | 21.0 | 39.4 | |||||||
| EBIT Margin | % | 4.85 | 3.98 | 3.48 | 2.25 | 5.81 | |||||||
| Net Margin | % | 0.875 | 0.880 | 0.822 | 1.51 | 2.86 | |||||||
| balance sheet | |||||||||||||
| Total Assets | CZK mil | 17.1 | 16.2 | 14.8 | 14.0 | 13.5 | |||||||
| Non-Current Assets | CZK mil | 5.09 | 4.56 | 3.77 | 3.08 | 4.01 | |||||||
| Current Assets | CZK mil | 12.0 | 11.7 | 10.3 | 10.9 | 9.51 | |||||||
| Shareholders' Equity | CZK mil | 2.43 | 2.73 | 2.99 | 1.94 | 2.89 | |||||||
| Liabilities | CZK mil | 14.7 | 13.5 | 11.8 | 12.1 | 10.6 | |||||||
| Non-Current Liabilities | CZK mil | ... | ... | 0 | 0 | 0 | 0 | 0 | |||||
| Current Liabilities | CZK mil | 12.7 | 11.7 | 11.2 | 12.1 | 10.5 | |||||||
| Net Debt/EBITDA | 1.91 | 1.64 | 1.30 | -2.33 | -0.737 | ||||||||
| Net Debt/Equity | % | 174 | 121 | 79.7 | -180 | -64.3 | |||||||
| Cost of Financing | % | ... | 12.9 | 13.5 | 13.1 | 1.32 | 78.1 | ||||||
| cash flow | |||||||||||||
| Total Cash From Operations | CZK mil | ... | 0.120 | -0.267 | -0.488 | 6.03 | -1.30 | ||||||
| Total Cash From Investing | CZK mil | ... | 0.801 | 1.18 | 1.43 | 1.42 | -0.336 | ||||||
| Total Cash From Financing | CZK mil | ... | -0.840 | -1.11 | -0.737 | -7.06 | 1.03 | ||||||
| Net Change In Cash | CZK mil | ... | 0.081 | -0.195 | 0.206 | 0.387 | -0.610 |
| income statement | Unit | 2008 | 2009 | 2010 | 2011 | 2012 | 2013 | 2014 | 2015 | 2016 | 2017 | 2018 | 2019 |
| income statement | |||||||||||||
| Sales | CZK mil | 36.8 | 34.0 | 34.3 | 34.1 | 33.3 | |||||||
| Cost of Goods & Services | CZK mil | 27.5 | 25.3 | 25.4 | 25.5 | 23.7 | |||||||
| Gross Profit | CZK mil | 9.28 | 8.71 | 8.94 | 8.68 | 9.61 | |||||||
| Staff Cost | CZK mil | 5.33 | 4.94 | 5.17 | 5.64 | 5.73 | |||||||
| Other Operating Cost (Income) | CZK mil | 1.74 | 1.76 | 1.94 | 1.54 | 1.35 | |||||||
| EBITDA | CZK mil | 2.21 | 2.01 | 1.83 | 1.50 | 2.52 | |||||||
| Depreciation | CZK mil | 0.425 | 0.659 | 0.637 | 0.733 | 0.589 | |||||||
| EBIT | CZK mil | 1.79 | 1.35 | 1.19 | 0.768 | 1.93 | |||||||
| Net Financing Cost | CZK mil | 1.39 | 0.990 | 0.840 | 0.085 | 0.664 | |||||||
| Financing Cost | CZK mil | 1.03 | 0.944 | 0.796 | 0.039 | 0.559 | |||||||
| Extraordinary Cost | CZK mil | -0.020 | -0.014 | 0 | 0 | 0 | |||||||
| Pre-Tax Profit | CZK mil | 0.421 | 0.377 | 0.353 | 0.683 | 1.27 | |||||||
| Tax | CZK mil | 0.099 | 0.078 | 0.071 | 0.166 | 0.318 | |||||||
| Net Profit | CZK mil | 0.322 | 0.299 | 0.282 | 0.517 | 0.952 | |||||||
| Net Profit Avail. to Common | CZK mil | 0.322 | 0.299 | 0.282 | 0.517 | 0.952 | |||||||
| growth rates | |||||||||||||
| Total Revenue Growth | % | ... | -2.25 | -7.71 | 0.960 | -0.478 | -2.47 | ||||||
| Staff Cost Growth | % | ... | -19.1 | -7.23 | 4.55 | 9.17 | 1.58 | ||||||
| EBITDA Growth | % | ... | 270 | -9.04 | -9.05 | -18.0 | 68.1 | ||||||
| EBIT Growth | % | ... | 452 | -24.3 | -11.8 | -35.6 | 152 | ||||||
| Pre-Tax Profit Growth | % | ... | 139 | -10.5 | -6.37 | 93.5 | 85.9 | ||||||
| Net Profit Growth | % | ... | 133 | -7.14 | -5.69 | 83.3 | 84.1 | ||||||
| ratios | |||||||||||||
| ROE | % | 14.2 | 11.6 | 9.87 | 21.0 | 39.4 | |||||||
| ROA | % | 1.90 | 1.79 | 1.81 | 3.59 | 6.92 | |||||||
| ROCE | % | ... | 3.90 | 3.40 | 3.91 | 9.90 | 17.0 | ||||||
| Gross Margin | % | 25.2 | 25.6 | 26.1 | 25.4 | 28.9 | |||||||
| EBITDA Margin | % | 6.01 | 5.92 | 5.34 | 4.40 | 7.58 | |||||||
| EBIT Margin | % | 4.85 | 3.98 | 3.48 | 2.25 | 5.81 | |||||||
| Net Margin | % | 0.875 | 0.880 | 0.822 | 1.51 | 2.86 | |||||||
| Cost of Financing | % | ... | 12.9 | 13.5 | 13.1 | 1.32 | 78.1 | ||||||
| Net Debt/EBITDA | 1.91 | 1.64 | 1.30 | -2.33 | -0.737 |
| balance sheet | Unit | 2008 | 2009 | 2010 | 2011 | 2012 | 2013 | 2014 | 2015 | 2016 | 2017 | 2018 | 2019 |
| balance sheet | |||||||||||||
| Cash & Cash Equivalents | CZK mil | 3.30 | 3.11 | 3.31 | 3.70 | 3.09 | |||||||
| Receivables | CZK mil | 5.24 | 4.16 | 3.23 | 3.24 | 2.43 | |||||||
| Inventories | CZK mil | 3.45 | 4.42 | 3.79 | 3.98 | 3.91 | |||||||
| Other ST Assets | CZK mil | 0 | 0 | 0 | 0 | 0.079 | |||||||
| Current Assets | CZK mil | 12.0 | 11.7 | 10.3 | 10.9 | 9.51 | |||||||
| Property, Plant & Equipment | CZK mil | 5.09 | 4.56 | 3.77 | 3.08 | 4.01 | |||||||
| LT Investments & Receivables | CZK mil | 0 | 0 | 0 | 0 | 0 | |||||||
| Intangible Assets | CZK mil | 0 | 0 | 0 | 0 | 0 | |||||||
| Goodwill | CZK mil | 0 | 0 | 0 | 0 | 0 | |||||||
| Non-Current Assets | CZK mil | 5.09 | 4.56 | 3.77 | 3.08 | 4.01 | |||||||
| Total Assets | CZK mil | 17.1 | 16.2 | 14.8 | 14.0 | 13.5 | |||||||
| Trade Payables | CZK mil | 4.65 | 4.66 | 4.84 | 5.79 | 3.66 | |||||||
| Short-Term Debt | CZK mil | 7.52 | 6.41 | 5.69 | 0.202 | 1.23 | |||||||
| Other ST Liabilities | CZK mil | 0.559 | 0.579 | 0.621 | 6.09 | 5.63 | |||||||
| Current Liabilities | CZK mil | 12.7 | 11.7 | 11.2 | 12.1 | 10.5 | |||||||
| Long-Term Debt | CZK mil | 0 | 0 | 0 | 0 | 0 | |||||||
| Other LT Liabilities | CZK mil | 0 | 0 | 0 | 0 | 0 | |||||||
| Non-Current Liabilities | CZK mil | ... | ... | 0 | 0 | 0 | 0 | 0 | |||||
| Liabilities | CZK mil | 14.7 | 13.5 | 11.8 | 12.1 | 10.6 | |||||||
| Equity Before Minority Interest | CZK mil | 2.43 | 2.73 | 2.99 | 1.94 | 2.89 | |||||||
| Minority Interest | CZK mil | 0 | 0 | 0 | 0 | 0 | |||||||
| Equity | CZK mil | 2.43 | 2.73 | 2.99 | 1.94 | 2.89 | |||||||
| growth rates | |||||||||||||
| Total Asset Growth | % | ... | 1.67 | -5.06 | -8.71 | -5.56 | -3.41 | ||||||
| Shareholders' Equity Growth | % | ... | 15.3 | 12.3 | 9.72 | -35.2 | 49.0 | ||||||
| Net Debt Growth | % | ... | -17.9 | -21.7 | -28.0 | -247 | -46.8 | ||||||
| Total Debt Growth | % | ... | -10.0 | -14.8 | -11.2 | -96.5 | 508 | ||||||
| ratios | |||||||||||||
| Total Debt | CZK mil | 7.52 | 6.41 | 5.69 | 0.202 | 1.23 | |||||||
| Net Debt | CZK mil | 4.22 | 3.31 | 2.38 | -3.50 | -1.86 | |||||||
| Working Capital | CZK mil | 4.04 | 3.92 | 2.17 | 1.43 | 2.67 | |||||||
| Capital Employed | CZK mil | 9.12 | 8.48 | 5.94 | 4.51 | 6.68 | |||||||
| Net Debt/Equity | % | 174 | 121 | 79.7 | -180 | -64.3 | |||||||
| Current Ratio | 0.941 | 1.00 | 0.925 | 0.903 | 0.903 | ||||||||
| Quick Ratio | 0.670 | 0.624 | 0.586 | 0.574 | 0.525 |
| cash flow | Unit | 2008 | 2009 | 2010 | 2011 | 2012 | 2013 | 2014 | 2015 | 2016 | 2017 | 2018 | 2019 |
| cash flow | |||||||||||||
| Net Profit | CZK mil | 0.322 | 0.299 | 0.282 | 0.517 | 0.952 | |||||||
| Depreciation | CZK mil | 0.425 | 0.659 | 0.637 | 0.733 | 0.589 | |||||||
| Non-Cash Items | CZK mil | ... | 1.50 | -1.34 | -3.16 | 4.03 | -1.59 | ||||||
| Change in Working Capital | CZK mil | ... | -2.12 | 0.116 | 1.75 | 0.744 | -1.25 | ||||||
| Total Cash From Operations | CZK mil | ... | 0.120 | -0.267 | -0.488 | 6.03 | -1.30 | ||||||
| Capital Expenditures | CZK mil | ... | 0.801 | 1.18 | 1.43 | 1.42 | -0.336 | ||||||
| Other Investing Activities | CZK mil | ... | 0 | 0 | 0 | 0 | 0 | ||||||
| Total Cash From Investing | CZK mil | ... | 0.801 | 1.18 | 1.43 | 1.42 | -0.336 | ||||||
| Dividends Paid | CZK mil | ... | 0 | 0 | -0.017 | -1.57 | -0.001 | ||||||
| Issuance Of Debt | CZK mil | ... | -0.840 | -1.11 | -0.720 | -5.49 | 1.03 | ||||||
| Other Financing Activities | CZK mil | ... | -0.801 | -1.18 | -1.43 | -1.42 | 0.336 | ||||||
| Total Cash From Financing | CZK mil | ... | -0.840 | -1.11 | -0.737 | -7.06 | 1.03 | ||||||
| Net Change In Cash | CZK mil | ... | 0.081 | -0.195 | 0.206 | 0.387 | -0.610 | ||||||
| ratios | |||||||||||||
| Days Sales Outstanding | days | 52.0 | 44.7 | 34.3 | 34.7 | 26.7 | |||||||
| Days Sales Of Inventory | days | 45.7 | 63.8 | 54.5 | 57.0 | 60.2 | |||||||
| Days Payable Outstanding | days | 61.7 | 67.3 | 69.7 | 83.1 | 56.5 | |||||||
| Cash Conversion Cycle | days | 36.0 | 41.2 | 19.1 | 8.64 | 30.4 | |||||||
| Cash Earnings | CZK mil | 0.747 | 0.958 | 0.919 | 1.25 | 1.54 | |||||||
| Free Cash Flow | CZK mil | ... | 0.921 | 0.915 | 0.943 | 7.45 | -1.64 | ||||||
| Capital Expenditures (As % of Sales) | % | ... | -2.18 | -3.48 | -4.17 | -4.16 | 1.01 |
| other ratios | Unit | 2008 | 2009 | 2010 | 2011 | 2012 | 2013 | 2014 | 2015 | 2016 | 2017 | 2018 | 2019 |
| Material & Energy (As % of Sales) | % | 69.8 | 69.6 | 68.6 | 69.7 | 66.9 | |||||||
| Services (As % of Sales) | % | 5.02 | 4.72 | 5.29 | 4.92 | 4.26 | |||||||
| Staff Cost (As % of Sales) | % | 14.5 | 14.5 | 15.1 | 16.5 | 17.2 | |||||||
| Effective Tax Rate | % | 23.5 | 20.7 | 20.1 | 24.3 | 25.0 | |||||||
| Total Revenue Growth (5-year average) | % | ... | ... | ... | ... | ... | -6.76 | -7.40 | -4.65 | -3.50 | -2.43 | ||
| Total Revenue Growth (10-year average) | % | ... | ... | ... | ... | ... | ... | ... | ... | ... | ... |
Get all company financials in excel:


By Helgi Library - December 5, 2020
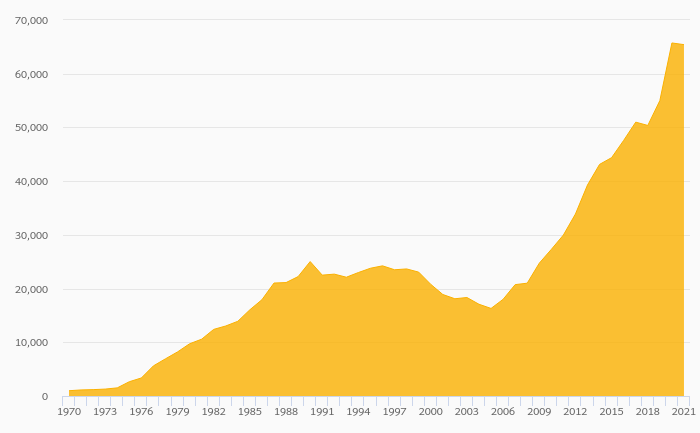
Q-PAP made a net profit of CZK 0.929 mil in 2019, down 35.3% compared to the previous year. Historically, between 2008 and 2019, the company's net profit reached a high of CZK 1.61 mil in 2008 and a low of CZK 0.138 mil in 2012. The result implies a retur...
By Helgi Library - December 5, 2020
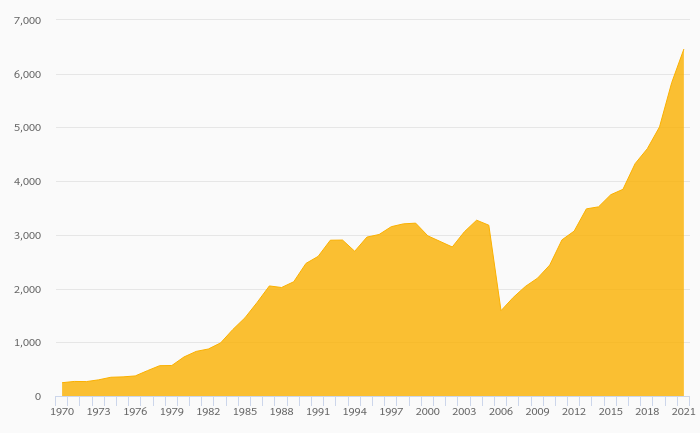
Q-PAP invested a total of CZK -0.573 mil in 2019, down 76.3% compared to the previous year. Historically, between 2009 - 2019, the company's investments stood at a high of CZK 3.20 mil in 2012 and a low of CZK -1.90 mil in 2009. As a ...
Q-PAP is a Czech-based Companyl located in Zizice - Lunikov. The Company is involved in production of personal care and sanitary paper products.

Q-PAP has been growing its sales by -3.33% a year on average in the last 5 years. EBITDA has grown on average by 1.19% a year during that time to total of CZK 2.14 mil in 2019, or 7.45% of sales. That’s compared to 6.70% average margin seen in last five years.
The company netted CZK 0.929 mil in 2019 implying ROE of 19.4% and ROCE of 13.2%. Again, the average figures were 25.9% and 13.1%, respectively when looking at the previous 5 years.
Q-PAP’s net debt amounted to CZK 1.65 mil at the end of 2019, or 31.3% of equity. When compared to EBITDA, net debt was 0.770x, up when compared to average of -0.082x seen in the last 5 years.
 Helgi Library