By Helgi Library - February 20, 2020
RCBC made a net profit of PHP 1,867 mil under revenues of PHP 10,901 mil in the third quarter of 2019, up 83.9% and 64.9% ...
By Helgi Library - February 20, 2020
RCBC's customer deposits reached PHP 332,961 mil in 2016-09-30, up 4.11% compared to the previous year. Filipino banking sector...
By Helgi Library - March 4, 2020
RCBC generated total banking revenues of PHP 10,901 mil in the third quarter of 2019, up 64.9% when compared to the same period o...
| Profit Statement | 2016 | 2017 | 2018 | |
| Net Interest Income | PHP mil | 16,156 | 18,255 | 20,678 |
| Net Fee Income | PHP mil | 3,458 | 3,417 | 3,601 |
| Other Income | PHP mil | 3,076 | 3,357 | 2,202 |
| Total Revenues | PHP mil | 22,690 | 25,029 | 26,481 |
| Staff Cost | PHP mil | 5,408 | 5,991 | 6,562 |
| Operating Profit | PHP mil | 5,600 | 6,752 | 7,004 |
| Provisions | PHP mil | 1,770 | 2,155 | 1,899 |
| Net Profit | PHP mil | 4,054 | 3,985 | 4,268 |
| Balance Sheet | 2016 | 2017 | 2018 | |
| Interbank Loans | PHP mil | 33,182 | 29,649 | 30,374 |
| Customer Loans | PHP mil | 286,131 | 329,306 | 353,717 |
| Total Assets | PHP mil | 521,193 | 553,988 | 644,595 |
| Shareholders' Equity | PHP mil | 62,133 | 67,027 | 81,170 |
| Interbank Borrowing | PHP mil | 16,002 | 34,246 | 50,601 |
| Customer Deposits | PHP mil | 353,077 | 388,412 | 423,399 |
| Issued Debt Securities | PHP mil | 74,010 | 48,154 | 69,356 |
| Ratios | 2016 | 2017 | 2018 | |
| ROE | % | 6.74 | 6.17 | 5.76 |
| ROA | % | 0.782 | 0.741 | 0.712 |
| Costs (As % Of Assets) | % | 3.30 | 3.40 | 3.25 |
| Costs (As % Of Income) | % | 75.3 | 73.0 | 73.6 |
| Capital Adequacy Ratio | % | 16.2 | 15.5 | 16.1 |
| Net Interest Margin | % | 3.12 | 3.40 | 3.45 |
| Loans (As % Of Deposits) | % | 81.0 | 84.8 | 83.5 |
| NPLs (As % Of Loans) | % | 1.04 | 1.33 | 1.19 |
| Provisions (As % Of NPLs) | % | 242 | 178 | 238 |
| Valuation | 2016 | 2017 | 2018 | |
| Price/Earnings (P/E) | 11.6 | 19.4 | 11.0 | |
| Price/Book Value (P/BV) | 0.756 | 1.16 | 0.578 | |
| Dividend Yield | % | 0 | 0.997 | 2.16 |
| Earnings Per Share (EPS) | PHP | 2.70 | 2.65 | 2.59 |
| Book Value Per Share | PHP | 41.4 | 44.6 | 49.3 |
| Dividend Per Share | PHP | 0 | 0.514 | 0.616 |
Get all company financials in excel:
| summary | Unit | 1990 | 1991 | 1992 | 1993 | 1994 | 1995 | 1996 | 1997 | 1998 | 1999 | 2000 | 2001 | 2002 | 2003 | 2004 | 2005 | 2006 | 2007 | 2008 | 2009 | 2010 | 2011 | 2012 | 2013 | 2014 | 2015 | 2016 | 2017 | 2018 |
| income statement | ||||||||||||||||||||||||||||||
| Net Interest Income | PHP mil | 11,399 | 13,311 | 14,967 | 15,814 | 16,156 | ||||||||||||||||||||||||
| Total Revenues | PHP mil | 22,467 | 22,878 | 22,069 | 22,139 | 22,690 | ||||||||||||||||||||||||
| Operating Profit | PHP mil | 9,101 | 8,404 | 7,833 | 7,044 | 5,600 | ||||||||||||||||||||||||
| Net Profit | PHP mil | 6,220 | 5,321 | 4,411 | 5,105 | 4,054 | ||||||||||||||||||||||||
| balance sheet | ||||||||||||||||||||||||||||||
| Interbank Loans | PHP mil | 5,879 | 7,537 | 16,600 | 19,701 | 33,182 | ||||||||||||||||||||||||
| Customer Loans | PHP mil | 202,734 | 245,922 | 261,574 | 299,119 | 286,131 | ||||||||||||||||||||||||
| Debt Securities | PHP mil | 101,975 | 97,279 | 106,145 | 114,571 | 78,851 | ||||||||||||||||||||||||
| Total Assets | PHP mil | 364,095 | 421,869 | 457,905 | 516,061 | 521,193 | ||||||||||||||||||||||||
| Shareholders' Equity | PHP mil | 42,973 | 44,808 | 53,131 | 58,129 | 62,133 | ||||||||||||||||||||||||
| Interbank Borrowing | PHP mil | ... | ... | ... | ... | 38,345 | ... | ... | 16,002 | |||||||||||||||||||||
| Customer Deposits | PHP mil | 246,757 | 297,853 | 315,761 | 342,362 | 353,077 | ||||||||||||||||||||||||
| Issued Debt Securities | PHP mil | 58,927 | 24,867 | 73,206 | 98,704 | 74,010 | ||||||||||||||||||||||||
| ratios | ||||||||||||||||||||||||||||||
| ROE | % | ... | 15.4 | 12.1 | 9.01 | 9.18 | 6.74 | |||||||||||||||||||||||
| ROA | % | ... | 1.75 | 1.35 | 1.00 | 1.05 | 0.782 | |||||||||||||||||||||||
| Costs (As % Of Assets) | % | ... | 3.77 | 3.68 | 3.24 | 3.10 | 3.30 | |||||||||||||||||||||||
| Costs (As % Of Income) | % | 59.5 | 63.3 | 64.5 | 68.2 | 75.3 | ||||||||||||||||||||||||
| Capital Adequacy Ratio | % | ... | ... | ... | ... | ... | ... | ... | ... | ... | ... | ... | ... | ... | 17.6 | 16.5 | 15.4 | 15.7 | 16.2 | |||||||||||
| Net Interest Margin | % | ... | 3.21 | 3.39 | 3.40 | 3.25 | 3.12 | |||||||||||||||||||||||
| Interest Income (As % Of Revenues) | % | 50.7 | 58.2 | 67.8 | 71.4 | 71.2 | ||||||||||||||||||||||||
| Fee Income (As % Of Revenues) | % | ... | ... | 10.6 | 11.8 | 11.8 | 17.0 | 15.2 | ||||||||||||||||||||||
| Staff Cost (As % Of Total Cost) | % | 27.4 | 25.5 | 43.7 | 31.3 | 31.6 | ||||||||||||||||||||||||
| Equity (As % Of Assets) | % | 11.8 | 10.6 | 11.6 | 11.3 | 11.9 | ||||||||||||||||||||||||
| Loans (As % Of Deposits) | % | 82.2 | 82.6 | 82.8 | 87.4 | 81.0 | ||||||||||||||||||||||||
| Loans (As % Assets) | % | 55.7 | 58.3 | 57.1 | 58.0 | 54.9 | ||||||||||||||||||||||||
| NPLs (As % Of Loans) | % | ... | ... | ... | ... | ... | ... | ... | ... | ... | ... | ... | ... | ... | 1.61 | 0.986 | 0.983 | 0.753 | 1.04 | |||||||||||
| Provisions (As % Of NPLs) | % | ... | ... | ... | ... | ... | ... | ... | ... | ... | ... | ... | ... | ... | 410 | 303 | 245 | 305 | 242 | |||||||||||
| valuation | ||||||||||||||||||||||||||||||
| Market Capitalisation (End Of Period) | USD mil | 1,667 | 1,222 | 1,369 | 986 | 947 | ||||||||||||||||||||||||
| Number Of Shares (Average) | mil | ... | ... | ... | ... | 1,224 | 1,331 | 1,369 | 1,462 | 1,502 | ||||||||||||||||||||
| Share Price (End Of Period) | PHP | 55.9 | 39.6 | 44.7 | 30.8 | 31.3 | ||||||||||||||||||||||||
| Earnings Per Share (EPS) | PHP | ... | ... | ... | ... | 4.74 | 3.68 | 2.90 | 3.49 | 2.70 | ||||||||||||||||||||
| Book Value Per Share | PHP | ... | ... | ... | ... | 35.1 | 33.7 | 38.8 | 39.8 | 41.4 | ||||||||||||||||||||
| Dividend Per Share | PHP | 0.839 | 0.932 | 0.559 | 0.671 | 0 | ||||||||||||||||||||||||
| Price/Earnings (P/E) | ... | ... | ... | ... | 11.8 | 10.8 | 15.4 | 8.81 | 11.6 | |||||||||||||||||||||
| Price/Book Value (P/BV) | ... | ... | ... | ... | 1.59 | 1.18 | 1.15 | 0.773 | 0.756 | |||||||||||||||||||||
| Dividend Yield | % | 1.50 | 2.35 | 1.25 | 2.18 | 0 | ||||||||||||||||||||||||
| Earnings Per Share Growth | % | ... | ... | ... | ... | ... | ... | ... | 14.4 | -22.4 | -21.3 | 20.5 | -22.7 | |||||||||||||||||
| Book Value Per Share Growth | % | ... | 2.80 | -4.05 | 15.2 | 2.50 | 3.99 |
| income statement | Unit | 1990 | 1991 | 1992 | 1993 | 1994 | 1995 | 1996 | 1997 | 1998 | 1999 | 2000 | 2001 | 2002 | 2003 | 2004 | 2005 | 2006 | 2007 | 2008 | 2009 | 2010 | 2011 | 2012 | 2013 | 2014 | 2015 | 2016 | 2017 | 2018 |
| income statement | ||||||||||||||||||||||||||||||
| Interest Income | PHP mil | 18,755 | 18,824 | 20,200 | 21,757 | 23,586 | ||||||||||||||||||||||||
| Interest Cost | PHP mil | 7,356 | 5,513 | 5,233 | 5,943 | 7,430 | ||||||||||||||||||||||||
| Net Interest Income | PHP mil | 11,399 | 13,311 | 14,967 | 15,814 | 16,156 | ||||||||||||||||||||||||
| Net Fee Income | PHP mil | ... | ... | 2,373 | 2,702 | 2,594 | 3,759 | 3,458 | ||||||||||||||||||||||
| Other Income | PHP mil | ... | ... | 8,695 | 6,865 | 4,508 | 2,566 | 3,076 | ||||||||||||||||||||||
| Total Revenues | PHP mil | 22,467 | 22,878 | 22,069 | 22,139 | 22,690 | ||||||||||||||||||||||||
| Staff Cost | PHP mil | 3,660 | 3,693 | 6,225 | 4,731 | 5,408 | ||||||||||||||||||||||||
| Depreciation | PHP mil | ... | ... | ... | ... | ... | ... | ... | ... | ... | ... | ... | ... | ... | ... | ... | ... | ... | ... | ... | ... | ... | ... | ... | ... | ... | 1,202 | 1,261 | ||
| Other Cost | PHP mil | ... | ... | ... | ... | ... | ... | ... | ... | ... | ... | ... | ... | ... | ... | ... | ... | ... | ... | ... | ... | ... | ... | ... | ... | ... | 9,162 | 10,421 | ||
| Operating Cost | PHP mil | 13,366 | 14,474 | 14,236 | 15,095 | 17,090 | ||||||||||||||||||||||||
| Operating Profit | PHP mil | 9,101 | 8,404 | 7,833 | 7,044 | 5,600 | ||||||||||||||||||||||||
| Provisions | PHP mil | 2,486 | 2,054 | 2,509 | 2,350 | 1,770 | ||||||||||||||||||||||||
| Extra and Other Cost | PHP mil | -357 | -243 | 0 | -93.0 | -131 | ||||||||||||||||||||||||
| Pre-Tax Profit | PHP mil | 6,972 | 6,593 | 5,324 | 4,787 | 3,961 | ||||||||||||||||||||||||
| Tax | PHP mil | 745 | 1,259 | 914 | -317 | -94.5 | ||||||||||||||||||||||||
| Minorities | PHP mil | 7.00 | 13.0 | -1.00 | -1.00 | 2.00 | ||||||||||||||||||||||||
| Net Profit | PHP mil | 6,220 | 5,321 | 4,411 | 5,105 | 4,054 | ||||||||||||||||||||||||
| Dividends | PHP mil | 1,027 | 1,276 | 765 | 1,008 | 0 | ||||||||||||||||||||||||
| growth rates | ||||||||||||||||||||||||||||||
| Net Interest Income Growth | % | ... | 5.22 | 16.8 | 12.4 | 5.66 | 2.16 | |||||||||||||||||||||||
| Net Fee Income Growth | % | ... | ... | ... | ... | 9.86 | 13.9 | -4.00 | 44.9 | -8.01 | ||||||||||||||||||||
| Total Revenue Growth | % | ... | 8.21 | 1.83 | -3.54 | 0.317 | 2.49 | |||||||||||||||||||||||
| Operating Cost Growth | % | ... | 7.32 | 8.29 | -1.64 | 6.03 | 13.2 | |||||||||||||||||||||||
| Operating Profit Growth | % | ... | 9.55 | -7.66 | -6.79 | -10.1 | -20.5 | |||||||||||||||||||||||
| Pre-Tax Profit Growth | % | ... | 16.8 | -5.44 | -19.2 | -10.1 | -17.3 | |||||||||||||||||||||||
| Net Profit Growth | % | ... | 23.7 | -14.5 | -17.1 | 15.7 | -20.6 | |||||||||||||||||||||||
| market share | ||||||||||||||||||||||||||||||
| Market Share in Revenues | % | ... | ... | ... | ... | ... | ... | ... | ... | ... | ... | ... | 6.57 | 5.78 | 5.38 | 5.22 | 4.67 | ... | ||||||||||||
| Market Share in Net Profit | % | ... | ... | ... | ... | ... | ... | ... | ... | ... | ... | ... | 6.14 | 4.44 | 3.78 | 4.44 | 3.20 | ... | ||||||||||||
| Market Share in Branches | % | ... | ... | ... | ... | ... | ... | ... | ... | ... | ... | ... | ... | ... | ... | ... | ... | ... | ... | ... | 4.58 | ... | ... | ... | ... | ... | ... |
| balance sheet | Unit | 1990 | 1991 | 1992 | 1993 | 1994 | 1995 | 1996 | 1997 | 1998 | 1999 | 2000 | 2001 | 2002 | 2003 | 2004 | 2005 | 2006 | 2007 | 2008 | 2009 | 2010 | 2011 | 2012 | 2013 | 2014 | 2015 | 2016 | 2017 | 2018 |
| balance sheet | ||||||||||||||||||||||||||||||
| Cash | PHP mil | 46,000 | 62,317 | 59,184 | 64,687 | 81,696 | ||||||||||||||||||||||||
| Interbank Loans | PHP mil | 5,879 | 7,537 | 16,600 | 19,701 | 33,182 | ||||||||||||||||||||||||
| Customer Loans | PHP mil | 202,734 | 245,922 | 261,574 | 299,119 | 286,131 | ||||||||||||||||||||||||
| Retail Loans | PHP mil | ... | ... | ... | ... | ... | ... | ... | ... | ... | ... | ... | ... | ... | ... | ... | ... | ... | ... | ... | ... | 12,924 | 43,851 | 57,784 | 76,052 | 293,542 | ||||
| Mortgage Loans | PHP mil | ... | ... | ... | ... | ... | ... | ... | ... | ... | ... | ... | ... | ... | ... | ... | ... | ... | ... | ... | ... | ... | ... | 31,802 | 57,784 | 76,052 | ... | ... | ... | |
| Consumer Loans | PHP mil | ... | ... | ... | ... | ... | ... | ... | ... | ... | ... | ... | ... | ... | ... | ... | ... | ... | ... | ... | ... | ... | ... | 12,049 | 0 | 0 | ... | ... | ... | |
| Debt Securities | PHP mil | 101,975 | 97,279 | 106,145 | 114,571 | 78,851 | ||||||||||||||||||||||||
| Fixed Assets | PHP mil | 7,507 | 8,814 | 7,031 | 7,602 | 8,876 | ||||||||||||||||||||||||
| Intangible Assets | PHP mil | ... | ... | ... | ... | ... | ... | ... | 1,341 | 1,408 | 426 | 426 | 2,233 | |||||||||||||||||
| Goodwill | PHP mil | ... | ... | ... | ... | ... | ... | ... | ... | ... | ... | ... | ... | ... | 426 | 426 | 426 | 426 | 268 | |||||||||||
| Total Assets | PHP mil | 364,095 | 421,869 | 457,905 | 516,061 | 521,193 | ||||||||||||||||||||||||
| Shareholders' Equity | PHP mil | 42,973 | 44,808 | 53,131 | 58,129 | 62,133 | ||||||||||||||||||||||||
| Of Which Minority Interest | PHP mil | 30.0 | 23.0 | 22.0 | 24.0 | 26.0 | ||||||||||||||||||||||||
| Liabilities | PHP mil | 321,122 | 377,061 | 404,774 | 457,932 | 459,060 | ||||||||||||||||||||||||
| Interbank Borrowing | PHP mil | ... | ... | ... | ... | 38,345 | ... | ... | 16,002 | |||||||||||||||||||||
| Customer Deposits | PHP mil | 246,757 | 297,853 | 315,761 | 342,362 | 353,077 | ||||||||||||||||||||||||
| Sight Deposits | PHP mil | 10,568 | 28,448 | 32,197 | 44,311 | 42,053 | ||||||||||||||||||||||||
| Term Deposits | PHP mil | 236,189 | 269,405 | 283,564 | 298,051 | 311,024 | ||||||||||||||||||||||||
| Issued Debt Securities | PHP mil | 58,927 | 24,867 | 73,206 | 98,704 | 74,010 | ||||||||||||||||||||||||
| Subordinated Debt | PHP mil | ... | ... | ... | ... | ... | ... | ... | ... | ... | ... | ... | ... | ... | 10,987 | 0 | 9,921 | 9,936 | 9,952 | |||||||||||
| Other Liabilities | PHP mil | ... | ... | ... | ... | 15,996 | ... | ... | 15,971 | |||||||||||||||||||||
| asset quality | ||||||||||||||||||||||||||||||
| Non-Performing Loans | PHP mil | ... | ... | ... | ... | ... | ... | ... | ... | ... | ... | ... | ... | ... | 3,491 | 2,499 | 2,636 | 2,305 | 3,065 | |||||||||||
| Gross Loans | PHP mil | ... | 217,058 | 253,497 | 268,031 | 306,159 | 293,542 | |||||||||||||||||||||||
| Total Provisions | PHP mil | ... | 14,324 | 7,575 | 6,457 | 7,040 | 7,411 | |||||||||||||||||||||||
| growth rates | ||||||||||||||||||||||||||||||
| Customer Loan Growth | % | ... | 3.13 | 21.3 | 6.36 | 14.4 | -4.34 | |||||||||||||||||||||||
| Retail Loan Growth | % | ... | ... | ... | ... | ... | ... | ... | ... | ... | ... | ... | ... | ... | ... | ... | ... | ... | ... | ... | ... | ... | 26.8 | 239 | 31.8 | 31.6 | 286 | |||
| Mortgage Loan Growth | % | ... | ... | ... | ... | ... | ... | ... | ... | ... | ... | ... | ... | ... | ... | ... | ... | ... | ... | ... | ... | ... | ... | ... | ... | 81.7 | 31.6 | ... | ... | ... |
| Consumer Loan Growth | % | ... | ... | ... | ... | ... | ... | ... | ... | ... | ... | ... | ... | ... | ... | ... | ... | ... | ... | ... | ... | ... | ... | ... | ... | -100 | ... | ... | ... | ... |
| Total Asset Growth | % | ... | 5.45 | 15.9 | 8.54 | 12.7 | 0.994 | |||||||||||||||||||||||
| Shareholders' Equity Growth | % | ... | 13.5 | 4.27 | 18.6 | 9.41 | 6.89 | |||||||||||||||||||||||
| Customer Deposit Growth | % | ... | -3.34 | 20.7 | 6.01 | 8.42 | 3.13 | |||||||||||||||||||||||
| market share | ||||||||||||||||||||||||||||||
| Market Share in Customer Loans | % | ... | ... | ... | ... | ... | ... | ... | ... | ... | ... | ... | ... | ... | ... | 5.90 | 6.02 | 5.12 | 5.17 | 4.23 | ... | |||||||||
| Market Share in Consumer Loans | % | ... | ... | ... | ... | ... | ... | ... | ... | ... | ... | ... | ... | ... | ... | ... | ... | ... | ... | ... | ... | ... | ... | ... | 15.7 | ... | ... | ... | ... | ... |
| Market Share in Mortgage Loans | % | ... | ... | ... | ... | ... | ... | ... | ... | ... | ... | ... | ... | ... | ... | ... | ... | ... | ... | ... | ... | ... | ... | 10.5 | 15.2 | 17.9 | ... | ... | ... | |
| Market Share in Total Assets | % | ... | ... | ... | ... | ... | ... | ... | ... | ... | ... | ... | 5.37 | 4.91 | 4.68 | 4.80 | 4.27 | ... | ||||||||||||
| Market Share in Customer Deposits | % | ... | ... | ... | ... | ... | ... | ... | ... | ... | ... | ... | 5.31 | 4.92 | 4.64 | 4.58 | 4.02 | ... |
| ratios | Unit | 1990 | 1991 | 1992 | 1993 | 1994 | 1995 | 1996 | 1997 | 1998 | 1999 | 2000 | 2001 | 2002 | 2003 | 2004 | 2005 | 2006 | 2007 | 2008 | 2009 | 2010 | 2011 | 2012 | 2013 | 2014 | 2015 | 2016 | 2017 | 2018 |
| ratios | ||||||||||||||||||||||||||||||
| ROE | % | ... | 15.4 | 12.1 | 9.01 | 9.18 | 6.74 | |||||||||||||||||||||||
| ROA | % | ... | 1.75 | 1.35 | 1.00 | 1.05 | 0.782 | |||||||||||||||||||||||
| Costs (As % Of Assets) | % | ... | 3.77 | 3.68 | 3.24 | 3.10 | 3.30 | |||||||||||||||||||||||
| Costs (As % Of Income) | % | 59.5 | 63.3 | 64.5 | 68.2 | 75.3 | ||||||||||||||||||||||||
| Capital Adequacy Ratio | % | ... | ... | ... | ... | ... | ... | ... | ... | ... | ... | ... | ... | ... | 17.6 | 16.5 | 15.4 | 15.7 | 16.2 | |||||||||||
| Tier 1 Ratio | % | ... | ... | ... | ... | ... | ... | ... | ... | ... | ... | ... | ... | ... | ... | ... | ... | 13.2 | 16.0 | 11.8 | 12.6 | 12.9 | ||||||||
| Net Interest Margin | % | ... | 3.21 | 3.39 | 3.40 | 3.25 | 3.12 | |||||||||||||||||||||||
| Interest Spread | % | ... | 2.95 | 3.21 | 3.25 | 3.09 | 2.93 | |||||||||||||||||||||||
| Asset Yield | % | ... | 5.29 | 4.79 | 4.59 | 4.47 | 4.55 | |||||||||||||||||||||||
| Cost Of Liabilities | % | ... | 2.34 | 1.58 | 1.34 | 1.38 | 1.62 | |||||||||||||||||||||||
| Payout Ratio | % | 16.5 | 24.0 | 17.4 | 19.7 | 0 | ||||||||||||||||||||||||
| Interest Income (As % Of Revenues) | % | 50.7 | 58.2 | 67.8 | 71.4 | 71.2 | ||||||||||||||||||||||||
| Fee Income (As % Of Revenues) | % | ... | ... | 10.6 | 11.8 | 11.8 | 17.0 | 15.2 | ||||||||||||||||||||||
| Other Income (As % Of Revenues) | % | ... | ... | 38.7 | 30.0 | 20.4 | 11.6 | 13.6 | ||||||||||||||||||||||
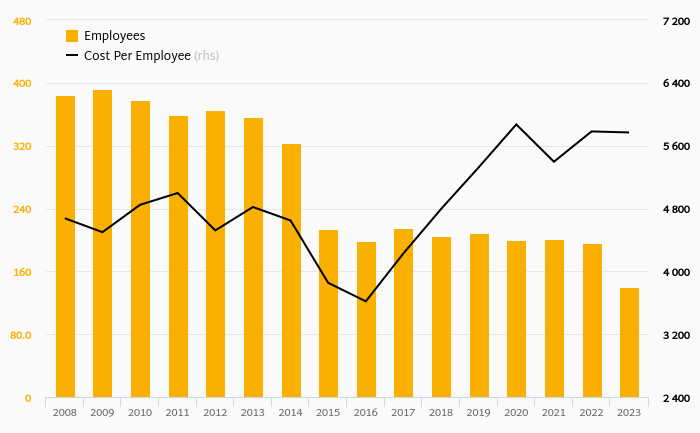
| Cost Per Employee | USD per month | ... | ... | ... | ... | ... | ... | ... | ... | 2,004 | 1,977 | 3,053 | 2,120 | 2,193 | ... | |||||||||||||||
| Cost Per Employee (Local Currency) | PHP per month | ... | ... | ... | ... | ... | ... | ... | ... | 84,581 | 83,924 | 136,048 | 97,394 | 106,314 | ... | |||||||||||||||
| Staff Cost (As % Of Total Cost) | % | 27.4 | 25.5 | 43.7 | 31.3 | 31.6 | ||||||||||||||||||||||||
| Equity (As % Of Assets) | % | 11.8 | 10.6 | 11.6 | 11.3 | 11.9 | ||||||||||||||||||||||||
| Loans (As % Of Deposits) | % | 82.2 | 82.6 | 82.8 | 87.4 | 81.0 | ||||||||||||||||||||||||
| Loans (As % Assets) | % | 55.7 | 58.3 | 57.1 | 58.0 | 54.9 | ||||||||||||||||||||||||
| NPLs (As % Of Loans) | % | ... | ... | ... | ... | ... | ... | ... | ... | ... | ... | ... | ... | ... | 1.61 | 0.986 | 0.983 | 0.753 | 1.04 | |||||||||||
| Provisions (As % Of NPLs) | % | ... | ... | ... | ... | ... | ... | ... | ... | ... | ... | ... | ... | ... | 410 | 303 | 245 | 305 | 242 | |||||||||||
| Provisions (As % Of Loans) | % | ... | 7.07 | 3.08 | 2.47 | 2.35 | 2.59 | |||||||||||||||||||||||
| Cost of Provisions (As % Of Loans) | % | ... | 1.25 | 0.916 | 0.989 | 0.838 | 0.605 |
| other data | Unit | 1990 | 1991 | 1992 | 1993 | 1994 | 1995 | 1996 | 1997 | 1998 | 1999 | 2000 | 2001 | 2002 | 2003 | 2004 | 2005 | 2006 | 2007 | 2008 | 2009 | 2010 | 2011 | 2012 | 2013 | 2014 | 2015 | 2016 | 2017 | 2018 |
| other data | ||||||||||||||||||||||||||||||
| Branches | ... | ... | ... | ... | ... | ... | ... | ... | ... | ... | ... | ... | ... | ... | ... | ... | ... | ... | 399 | 407 | 449 | 456 | 481 | |||||||
| Employees | ... | ... | ... | ... | ... | ... | ... | ... | 3,606 | 3,667 | 3,813 | 4,048 | 4,239 | ... | ||||||||||||||||
| ATMs | ... | ... | ... | ... | ... | ... | ... | ... | ... | ... | ... | ... | ... | ... | ... | ... | ... | ... | ... | ... | ... | ... | ... | ... | ... | 1,342 | 1,488 | |||
| Sight (As % Of Customer Deposits) | % | 4.28 | 9.55 | 10.2 | 12.9 | 11.9 | ||||||||||||||||||||||||
| Risk-Weighted Assets | PHP mil | ... | ... | ... | ... | ... | ... | ... | ... | ... | ... | ... | ... | ... | ... | ... | ... | 281,622 | 305,920 | 338,949 | 388,804 | 386,663 | ||||||||
| Return on Loans | % | 3.12 | 2.37 | 1.74 | 1.82 | 1.39 | ||||||||||||||||||||||||
| Operating Profit (As % of Loans) | % | ... | 4.56 | 3.75 | 3.09 | 2.51 | 1.91 | |||||||||||||||||||||||
| Costs (As % Of Loans) | % | ... | 6.69 | 6.45 | 5.61 | 5.38 | 5.84 | |||||||||||||||||||||||
| Equity (As % Of Loans) | % | 21.2 | 18.2 | 20.3 | 19.4 | 21.7 |
Get all company financials in excel:


By Helgi Library - February 21, 2020
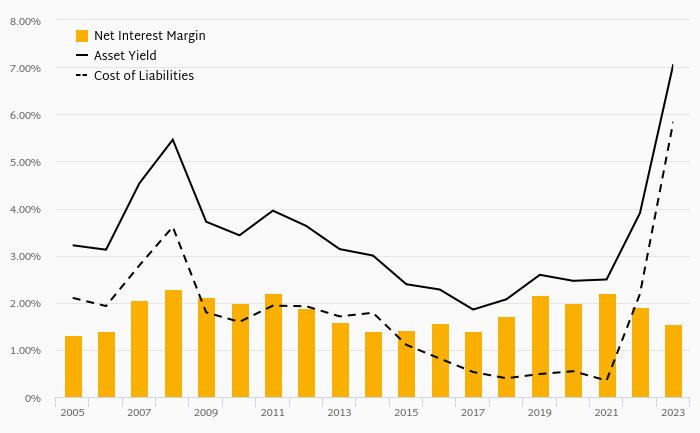
RCBC's net interest margin amounted to 3.47% in the third quarter of 2019, up from 3.32% when compared to the previous quarter. Historically, the bank’s net interest margin reached an all time high of 5.57% in 4Q2005 and an all time low of 1.38% in 3Q20...
By Helgi Library - February 20, 2020
RCBC stock traded at PHP 26.5 per share at the end third quarter of 2019 implying a market capitalization of USD 1,151 mil. Since the end of 3Q2014, the stock has depreciated by -47.5 % implying an annual average growth of -12.1 %. In absolute terms, the value of the ...
By Helgi Library - February 20, 2020
RCBC stock traded at PHP 26.5 per share at the end of third quarter of 2019 implying a market capitalization of USD 1,151 mil. Over the last five years, the stock has depreciated by 47.5 implying an annual average growth of -12.1% In absolute terms, the v...
By Helgi Library - February 20, 2020
RCBC's customer loan growth reached 9.47% in 2019-09-30, down from 10.0% compared to the previous year. Historically, the bank’s loans growth reached an all time high of 43.9% in 2013-12-31 and an all time low of -13.1% in 2012-12-31. In the last decade, ...
By Helgi Library - February 20, 2020
RCBC's Equity reached 12.6% of total assets in the 3Q2019, down from 13.6% for the previous year. As a share of net customer loans, the ratio amounted to 22.3% at the end of the third quarter of 2019. ...
By Helgi Library - February 20, 2020
RCBC's capital adequacy ratio reached 16.1% at the end of second quarter of 2019, up from when compared to the previous quarter. Historically, the bank’s capital ratio hit an all time high of 22.6% in 1Q2014 and an all time low of 13.8% in 2Q2014. The Tier 1...
By Helgi Library - March 4, 2020
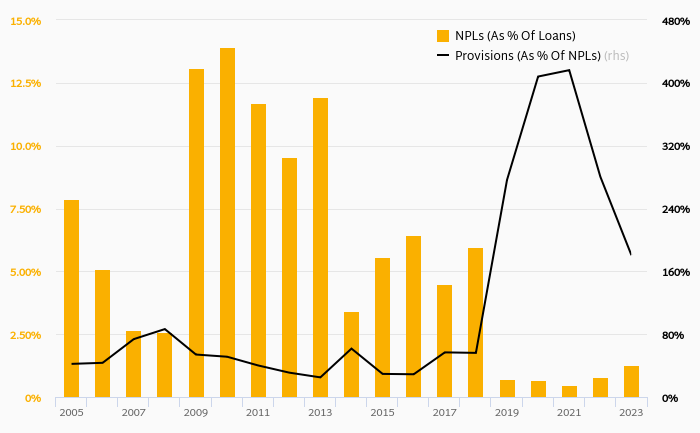
RCBC's non-performing loans reached 1.19% of total loans at the end of 2018-12-31, down from 1.33% compared to the previous year. Historically, the NPL ratio hit an all time high of 23.3% in 2004-12-31 and an all time low of 0.753% in 2015-12-31. Provision ...
By Helgi Library - February 20, 2020
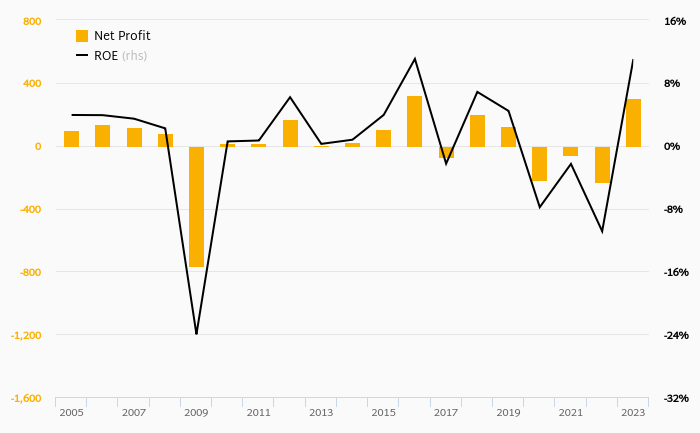
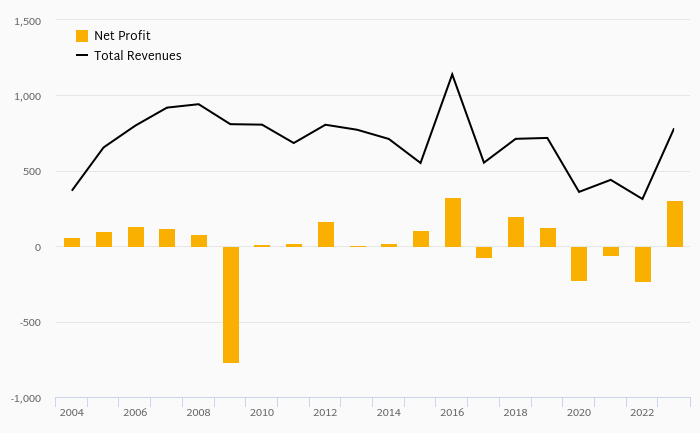
RCBC made a net profit of PHP 4,268 mil under revenues of PHP 26,481 mil in 2018, up 7.12% and 5.80% respectively compared to the previous year. Historically, the bank’s net profit reached an all time high of PHP 6,220 mil in 2012 and an all time low of PHP 261 mil i...
By Helgi Library - February 20, 2020
RCBC generated total banking revenues of PHP 26,481 mil in 2018, up 5.8% compared to the previous year. Historically, the bank’s revenues containing of interest, fee and other non-interest income reached an all time high of PHP 26,481 mil in 2018 and an all tim...
By Helgi Library - February 20, 2020
RCBC's non-performing loans reached 1.19% of total loans at the end of 2018, down from 1.33% compared to the previous year. Historically, the NPL ratio hit an all time high of 23.9% in 2003 and an all time low of 0.753% in 2015. Provision coverage amounted ...

 Helgi Library