By Helgi Library - September 26, 2020
Subaru Corporation made a net profit of JPY 40.9 bil with revenues of JPY 860 bil in 1Q2020, up by 38.2% and up by 9.76%,...
By Helgi Library - September 26, 2020
Subaru Corporation generated sales of JPY 860 bil in 1Q2020, up 9.76% compared to the previous year. Historically, between ...
By Helgi Library - October 12, 2020
Subaru Corporation's total assets reached JPY 3,294 bil at the end of 1Q2020, up 10.4% compared to the previous year. ...
| Profit Statement |
| Balance Sheet |
| Ratios |
| Valuation |
Get all company financials in excel:
Get all company financials in excel:


By Helgi Library - September 26, 2020
Subaru Corporation's operating cash flow stood at JPY 80.9 bil in 1Q2020, up 31.2% when compared to the previous year. Historically, between 2Q1999 - 1Q2020, the firm’s operating cash flow reached a high of JPY 180 bil in 1Q2016 and a low of JPY -57.5 ...
By Helgi Library - September 26, 2020
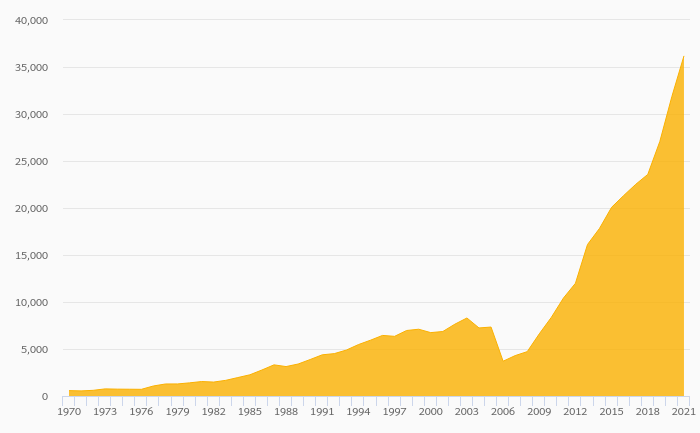
Subaru Corporation employed 35,034 employees in 2019, up 2.44% compared to the previous year. Historically, between 1999 and 2019, the firm's workforce hit a high of 35,034 employees in 2019 and a low of 25,598 employees in 2006. Average personnel co...
By Helgi Library - September 26, 2020
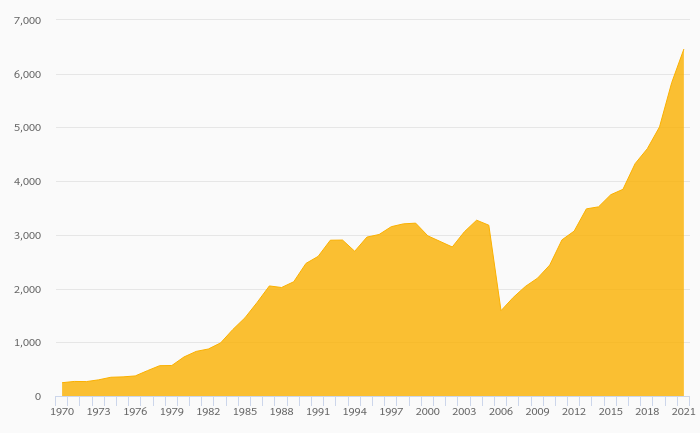
Subaru Corporation made a net profit of JPY 141 bil with revenues of JPY 3,268 bil in 2019, down by 23.9% and up by 2.55%, respectively, compared to the previous year. This translates into a net margin of 4.32%. On the operating level, EBITDA reached JPY ...
By Helgi Library - September 26, 2020
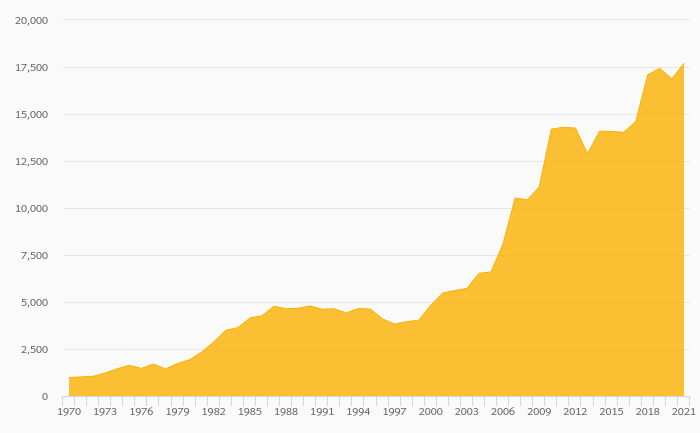
Subaru Corporation stock traded at JPY 2,434 per share at the end 2019 translating into a market capitalization of USD 17,461 mil. Since the end of 2014, stock has appreciated by 7.52% representing an annual average growth of 1.46%. In absolute terms, t...
By Helgi Library - September 26, 2020
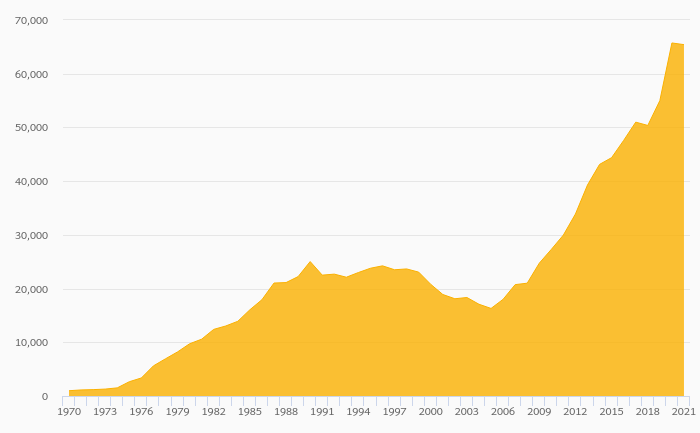
Subaru Corporation invested a total of JPY 191 bil in 2019, up 4.81% compared to the previous year. Historically, between 2009 - 2019, the company's investments stood at a high of JPY 191 bil in 2019 and a low of JPY 0 bil in 2015. As...
By Helgi Library - September 26, 2020
Subaru Corporation's net debt stood at JPY -541 bil and accounted for -32.0% of equity at the end of 2019. The ratio is up 19.9 pp compared to the previous year. Historically, the firm’s net debt to equity reached a high of 221% in 1994 and a low...
By Helgi Library - September 26, 2020
Subaru Corporation's total assets reached JPY 3,167 bil at the end of 2019, up 10.3% compared to the previous year. Current assets amounted to JPY 1,856 bil, or 58.6% of total assets while cash stood at JPY 756 bil at the end of 2019. ...
By Helgi Library - September 26, 2020
Subaru Corporation stock traded at JPY 2,434 per share at the end 2019 implying a market capitalization of USD 17,461 mil. Since the end of 2014, stock has appreciated by 7.52% implying an annual average growth of 1.46% In absolute terms, the value of the compan...
By Helgi Library - September 26, 2020
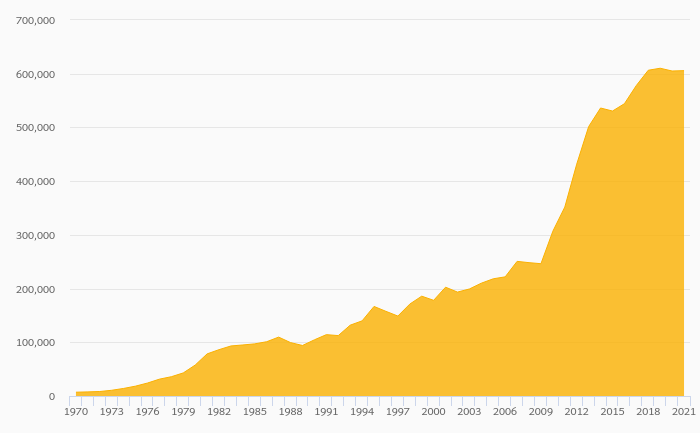
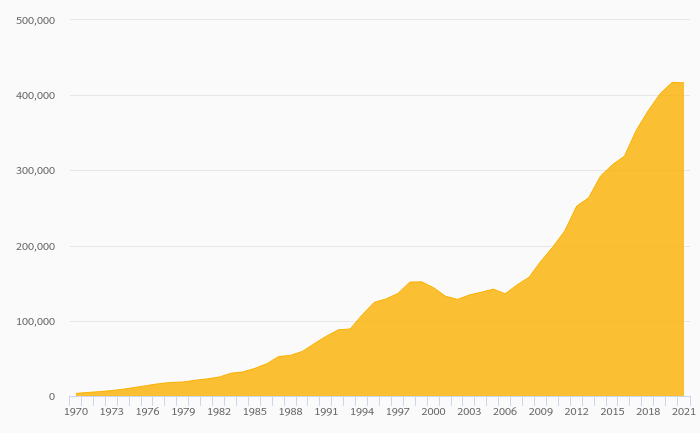
Subaru Corporation made a net profit of JPY 141 bil in 2019, down 23.9% compared to the previous year. Historically, between 1992 and 2019, the company's net profit reached a high of JPY 409 bil in 2015 and a low of JPY -70.3 bil in 2009. The result impli...
By Helgi Library - September 26, 2020
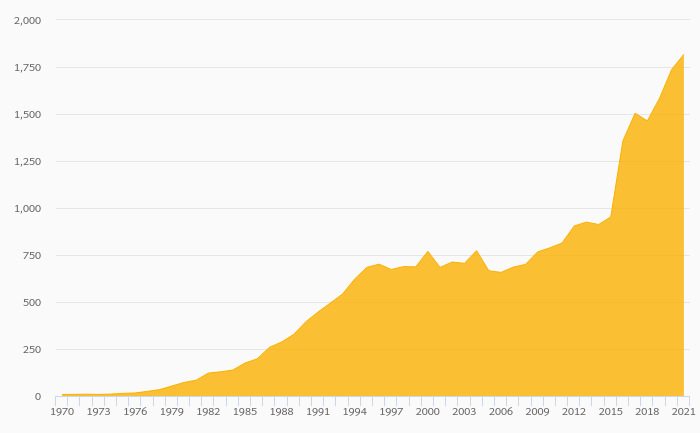
Subaru Corporation's operating cash flow stood at JPY 191 bil in 2019, down 32.6% when compared to the previous year. Historically, between 2000 - 2019, the firm’s operating cash flow reached a high of JPY 569 bil in 2015 and a low of JPY 18.0 bil ...
Subaru Corporation (formerly known as Fuji Heavy Industries) is a Japanese multinational corporation and conglomerate primarily involved in aerospace and ground transportation manufacturing, known for its line of Subaru automobiles. Company's aerospace division serves as a defense contractor to the Japanese government, manufacturing Boeing and Lockheed Martin helicopters and airplanes under license along with being a global development and manufacturing partner to both companies. It traces its roots to the Nakajima Aircraft Company, a leading supplier of airplanes to the Japanese government during World War II. Currently, Subaru Corporation employs more than 15,000 people worldwide, operates nine manufacturing plants and sells products in 100 countries. Subaru is 16.5% owned by Toyota. In 2003, the company adopted the logo of its Subaru division as its worldwide corporate symbol

Subaru Corporation has been growing its sales by 3.43% a year on average in the last 5 years. EBITDA has fallen on average by 5.07% a year during that time to total of JPY 362 bil in 2019, or 11.1% of sales. That’s compared to 14.8% average margin seen in last five years.
The company netted JPY 141 bil in 2019 implying ROE of 8.64% and ROCE of 9.79%. Again, the average figures were 19.1% and 26.5%, respectively when looking at the previous 5 years.
Subaru Corporation’s net debt amounted to JPY -541 bil at the end of 2019, or -32.0% of equity. When compared to EBITDA, net debt was -1.49x, up when compared to average of -1.58x seen in the last 5 years.
Subaru Corporation stock traded at JPY 2,434 per share at the end of 2019 resulting in a market capitalization of USD 17,461 mil. Over the previous five years, stock price grew by 7.52% or 1.46% a year on average. The closing price put stock at a 12-month trailing EV/EBITDA of 5.30x and price to earnings (PE) of 12.6x as of 2019.
 Helgi Library