By Helgi Library - December 19, 2021
Tyman made a net profit of GBP 37.2 mil with revenues of GBP 573 mil in 2020, up by 110% and down by 6.66%, respect...
By Helgi Library - December 19, 2021
Tyman stock traded at GBP 3.51 per share at the end 2020 translating into a market capitalization of USD 27.7 mil. Since the end ...
By Helgi Library - December 19, 2021
Tyman stock traded at GBP 3.51 per share at the end 2020 implying a market capitalization of USD 27.7 mil. Since the end of 2015,...
| Profit Statement | 2023 | 2024 | 2025 | |
| Sales | GBP mil | 658 | 662 | 674 |
| Gross Profit | GBP mil | 228 | 237 | 241 |
| EBITDA | GBP mil | 120 | 132 | 136 |
| EBIT | GBP mil | 99.4 | 104 | 108 |
| Financing Cost | GBP mil | 12.1 | 13.8 | 12.1 |
| Pre-Tax Profit | GBP mil | 87.3 | 90.6 | 95.4 |
| Net Profit | GBP mil | 58.3 | 68.1 | 62.5 |
| Dividends | GBP mil | ... | ... | ... |
| Balance Sheet | 2023 | 2024 | 2025 | |
| Total Assets | GBP mil | ... | ... | ... |
| Non-Current Assets | GBP mil | ... | ... | ... |
| Current Assets | GBP mil | ... | ... | ... |
| Working Capital | GBP mil | ... | ... | ... |
| Shareholders' Equity | GBP mil | ... | ... | ... |
| Liabilities | GBP mil | ... | ... | ... |
| Total Debt | GBP mil | ... | ... | ... |
| Net Debt | GBP mil | 49.8 | 38.7 | 2.15 |
| Ratios | 2023 | 2024 | 2025 | |
| ROE | % | ... | ... | ... |
| ROCE | % | ... | ... | ... |
| Gross Margin | % | 34.6 | 35.9 | 35.9 |
| EBITDA Margin | % | 18.2 | 19.9 | 20.2 |
| EBIT Margin | % | 15.1 | 15.8 | 16.0 |
| Net Margin | % | 8.85 | 10.3 | 9.28 |
| Net Debt/EBITDA | 0.415 | 0.293 | 0.016 | |
| Net Debt/Equity | % | ... | ... | ... |
| Cost of Financing | % | ... | ... | ... |
| Valuation | 2023 | 2024 | 2025 | |
| Market Capitalisation | USD mil | 1,031 | 1,031 | 1,031 |
| Enterprise Value (EV) | USD mil | 1,096 | 1,082 | 1,034 |
| Number Of Shares | mil | 196 | 196 | 196 |
| Share Price | GBP | 4.02 | 4.02 | 4.02 |
| EV/EBITDA | 6.99 | 6.27 | 5.82 | |
| EV/Sales | 1.27 | 1.25 | 1.17 | |
| Price/Earnings (P/E) | 13.5 | 11.6 | 12.6 | |
| Price/Book Value (P/BV) | ... | ... | ... | |
| Dividend Yield | % | ... | ... | ... |
Get all company financials in excel:
| overview | Unit | 1999 | 2000 | 2001 | 2002 | 2003 | 2004 | 2005 | 2006 | 2007 | 2008 | 2009 | 2010 | 2011 | 2012 | 2013 | 2014 | 2015 | 2016 | 2017 | 2018 | 2019 | 2020 | 2021 | 2022 | 2023 | 2024 | 2025 |
| income statement | ||||||||||||||||||||||||||||
| Sales | GBP mil | ... | 523 | 592 | 614 | 573 | 626 | |||||||||||||||||||||
| Gross Profit | GBP mil | ... | 191 | 208 | 206 | 192 | 213 | |||||||||||||||||||||
| EBIT | GBP mil | ... | 45.4 | 50.3 | 40.5 | 59.7 | 88.9 | |||||||||||||||||||||
| Net Profit | GBP mil | ... | 31.2 | 26.3 | 17.7 | 37.2 | 45.9 | |||||||||||||||||||||
| ROE | % | ... | 8.41 | 6.60 | 4.16 | 8.66 | ... | ... | ... | ... | ... | |||||||||||||||||
| EBIT Margin | % | ... | 8.68 | 8.50 | 6.60 | 10.4 | 14.2 | |||||||||||||||||||||
| Net Margin | % | ... | 5.97 | 4.45 | 2.88 | 6.49 | 7.32 | |||||||||||||||||||||
| Employees | ... | 3,964 | 4,303 | 4,303 | ... | ... | ... | ... | ... | ... | ||||||||||||||||||
| balance sheet | ||||||||||||||||||||||||||||
| Total Assets | GBP mil | ... | 698 | 857 | 833 | 802 | ... | ... | ... | ... | ... | |||||||||||||||||
| Non-Current Assets | GBP mil | ... | 510 | 612 | 619 | 576 | ... | ... | ... | ... | ... | |||||||||||||||||
| Current Assets | GBP mil | ... | 188 | 245 | 214 | 227 | ... | ... | ... | ... | ... | |||||||||||||||||
| Shareholders' Equity | GBP mil | ... | 365 | 434 | 416 | 443 | ... | ... | ... | ... | ... | |||||||||||||||||
| Liabilities | GBP mil | ... | 333 | 423 | 416 | 359 | ... | ... | ... | ... | ... | |||||||||||||||||
| Non-Current Liabilities | GBP mil | ... | 251 | 321 | 316 | 221 | ... | ... | ... | ... | ... | |||||||||||||||||
| Current Liabilities | GBP mil | ... | 82.0 | 103 | 101 | 138 | ... | ... | ... | ... | ... | |||||||||||||||||
| Net Debt/EBITDA | ... | 2.01 | 2.32 | 2.04 | 1.53 | 1.17 | ||||||||||||||||||||||
| Net Debt/Equity | % | ... | 44.7 | 48.1 | 42.3 | 34.6 | ... | ... | ... | ... | ... | |||||||||||||||||
| Cost of Financing | % | ... | ... | 4.08 | 5.01 | 6.47 | 5.40 | ... | ... | ... | ... | ... | ||||||||||||||||
| cash flow | ||||||||||||||||||||||||||||
| Total Cash From Operations | GBP mil | ... | 44.3 | 63.5 | 82.1 | 70.6 | ... | ... | ... | ... | ... | |||||||||||||||||
| Total Cash From Investing | GBP mil | ... | -18.9 | -118 | -11.6 | -12.0 | ... | ... | ... | ... | ... | |||||||||||||||||
| Total Cash From Financing | GBP mil | ... | -23.3 | 66.0 | -71.4 | -50.8 | ... | ... | ... | ... | ... | |||||||||||||||||
| Net Change In Cash | GBP mil | ... | 1.65 | 9.31 | -2.90 | 28.5 | ... | ... | ... | ... | ... | |||||||||||||||||
| valuation | ||||||||||||||||||||||||||||
| Market Capitalisation | USD mil | 875 | 588 | 707 | 27.7 | 1,031 | ||||||||||||||||||||||
| Enterprise Value (EV) | USD mil | ... | 1,095 | 854 | 940 | 237 | 1,198 | |||||||||||||||||||||
| Number Of Shares | mil | 178 | 193 | 196 | 196 | 196 | ||||||||||||||||||||||
| Share Price | GBP | 3.27 | 2.19 | 2.66 | 3.51 | 4.02 | ||||||||||||||||||||||
| Price/Earnings (P/E) | 18.7 | 16.1 | 29.4 | 51.1 | 17.2 | |||||||||||||||||||||||
| Price/Cash Earnings (P/CE) | ... | 13.6 | 10.9 | 13.6 | 11.9 | 11.9 | ||||||||||||||||||||||
| EV/EBITDA | ... | 10.5 | 7.25 | 8.46 | 1.76 | 8.24 | ||||||||||||||||||||||
| Price/Book Value (P/BV) | ... | 1.60 | 0.975 | 1.25 | 1.55 | ... | ... | ... | ... | ... | ||||||||||||||||||
| Dividend Yield | % | 3.37 | 5.24 | 4.54 | 1.73 | ... | ... | ... | ... | ... |
| income statement | Unit | 1999 | 2000 | 2001 | 2002 | 2003 | 2004 | 2005 | 2006 | 2007 | 2008 | 2009 | 2010 | 2011 | 2012 | 2013 | 2014 | 2015 | 2016 | 2017 | 2018 | 2019 | 2020 | 2021 | 2022 | 2023 | 2024 | 2025 |
| income statement | ||||||||||||||||||||||||||||
| Sales | GBP mil | ... | 523 | 592 | 614 | 573 | 626 | |||||||||||||||||||||
| Cost of Goods & Services | GBP mil | ... | 332 | 383 | 408 | 381 | 413 | |||||||||||||||||||||
| Gross Profit | GBP mil | ... | 191 | 208 | 206 | 192 | 213 | |||||||||||||||||||||
| Selling, General & Admin | GBP mil | ... | ... | ... | ... | ... | ... | ... | ... | ... | ... | 112 | 118 | 145 | 99.4 | ... | ... | ... | ... | ... | ||||||||
| Research & Development | GBP mil | ... | ... | ... | ... | ... | ... | ... | ... | ... | ... | 0 | 0 | 0 | 0 | ... | ... | ... | ... | ... | ||||||||
| Other Operating Expense | GBP mil | ... | ... | ... | ... | ... | ... | ... | ... | ... | ... | -1.46 | 0.193 | 0 | 0 | ... | ... | ... | ... | ... | ||||||||
| Staff Cost | GBP mil | ... | ... | 143 | 142 | ... | ... | ... | ... | ... | ... | ... | ||||||||||||||||
| Other Operating Cost (Income) | GBP mil | ... | ... | ... | ... | ... | 0 | 0 | 0 | 0 | ... | ... | ... | ... | ... | |||||||||||||
| EBITDA | GBP mil | ... | 81.2 | 90.0 | 86.1 | 100 | 109 | |||||||||||||||||||||
| Depreciation | GBP mil | ... | 11.6 | 12.5 | 20.6 | 20.4 | 20.2 | |||||||||||||||||||||
| EBIT | GBP mil | ... | 45.4 | 50.3 | 40.5 | 59.7 | 88.9 | |||||||||||||||||||||
| Net Financing Cost | GBP mil | ... | 8.38 | 11.3 | 15.7 | 12.1 | 12.9 | |||||||||||||||||||||
| Financing Cost | GBP mil | ... | 8.60 | 11.7 | 15.7 | 12.1 | 12.9 | |||||||||||||||||||||
| Financing Income | GBP mil | ... | 0.224 | 0.377 | ... | ... | ... | ... | ... | ... | ... | |||||||||||||||||
| FX (Gain) Loss | GBP mil | ... | ... | 1.46 | -0.193 | ... | ... | ... | ... | ... | ... | ... | ||||||||||||||||
| (Income) / Loss from Affiliates | GBP mil | ... | ... | ... | 0 | ... | ... | ... | ... | ... | ... | ... | ... | |||||||||||||||
| Extraordinary Cost | GBP mil | ... | 0 | 0 | 0 | 0 | ... | ... | ... | ... | ... | |||||||||||||||||
| Pre-Tax Profit | GBP mil | ... | 34.5 | 38.9 | 24.8 | 47.6 | 76.0 | |||||||||||||||||||||
| Tax | GBP mil | ... | 3.33 | 12.5 | 7.10 | 10.4 | ... | ... | ... | ... | ... | |||||||||||||||||
| Minorities | GBP mil | ... | 0 | 0 | 0 | 0 | ... | ... | ... | ... | ... | |||||||||||||||||
| Net Profit | GBP mil | ... | 31.2 | 26.3 | 17.7 | 37.2 | 45.9 | |||||||||||||||||||||
| Net Profit Avail. to Common | GBP mil | ... | 31.2 | 26.3 | 17.7 | 37.2 | 45.9 | |||||||||||||||||||||
| Dividends | GBP mil | ... | 19.9 | 23.4 | 23.9 | 7.85 | ... | ... | ... | ... | ... | |||||||||||||||||
| growth rates | ||||||||||||||||||||||||||||
| Total Revenue Growth | % | ... | ... | 14.2 | 13.2 | 3.75 | -6.66 | 9.35 | ||||||||||||||||||||
| Operating Cost Growth | % | ... | ... | 11.9 | 8.60 | 4.48 | -19.8 | ... | ... | ... | ... | ... | ||||||||||||||||
| Staff Cost Growth | % | ... | ... | ... | ... | 12.1 | -0.659 | ... | ... | ... | ... | ... | ... | ... | ||||||||||||||
| EBITDA Growth | % | ... | ... | 15.1 | 10.8 | -4.31 | 16.6 | 8.40 | ||||||||||||||||||||
| EBIT Growth | % | ... | ... | 21.9 | 10.8 | -19.4 | 47.4 | 48.8 | ||||||||||||||||||||
| Pre-Tax Profit Growth | % | ... | ... | 17.6 | 12.5 | -36.2 | 91.9 | 59.6 | ||||||||||||||||||||
| Net Profit Growth | % | ... | ... | 50.5 | -15.6 | -32.8 | 110 | 23.3 | ||||||||||||||||||||
| ratios | ||||||||||||||||||||||||||||
| ROE | % | ... | 8.41 | 6.60 | 4.16 | 8.66 | ... | ... | ... | ... | ... | |||||||||||||||||
| ROA | % | ... | 4.33 | 3.39 | 2.09 | 4.55 | ... | ... | ... | ... | ... | |||||||||||||||||
| ROCE | % | ... | 4.95 | 3.91 | 2.63 | 6.41 | ... | ... | ... | ... | ... | |||||||||||||||||
| Gross Margin | % | ... | 36.5 | 35.2 | 33.5 | 33.5 | 34.0 | |||||||||||||||||||||
| EBITDA Margin | % | ... | 15.5 | 15.2 | 14.0 | 17.5 | 17.4 | |||||||||||||||||||||
| EBIT Margin | % | ... | 8.68 | 8.50 | 6.60 | 10.4 | 14.2 | |||||||||||||||||||||
| Net Margin | % | ... | 5.97 | 4.45 | 2.88 | 6.49 | 7.32 | |||||||||||||||||||||
| Payout Ratio | % | ... | 63.9 | 88.7 | 135 | 21.1 | ... | ... | ... | ... | ... | |||||||||||||||||
| Cost of Financing | % | ... | ... | 4.08 | 5.01 | 6.47 | 5.40 | ... | ... | ... | ... | ... | ||||||||||||||||
| Net Debt/EBITDA | ... | 2.01 | 2.32 | 2.04 | 1.53 | 1.17 |
| balance sheet | Unit | 1999 | 2000 | 2001 | 2002 | 2003 | 2004 | 2005 | 2006 | 2007 | 2008 | 2009 | 2010 | 2011 | 2012 | 2013 | 2014 | 2015 | 2016 | 2017 | 2018 | 2019 | 2020 | 2021 | 2022 | 2023 | 2024 | 2025 |
| balance sheet | ||||||||||||||||||||||||||||
| Cash & Cash Equivalents | GBP mil | ... | 42.6 | 51.9 | 49.0 | 69.7 | ... | ... | ... | ... | ... | |||||||||||||||||
| Receivables | GBP mil | ... | 57.1 | 71.6 | 76.3 | 72.8 | ... | ... | ... | ... | ... | |||||||||||||||||
| Inventories | GBP mil | ... | 75.3 | 105 | 0 | 0 | ... | ... | ... | ... | ... | |||||||||||||||||
| Other ST Assets | GBP mil | ... | 13.1 | 16.1 | 88.6 | 84.0 | ... | ... | ... | ... | ... | |||||||||||||||||
| Current Assets | GBP mil | ... | 188 | 245 | 214 | 227 | ... | ... | ... | ... | ... | |||||||||||||||||
| Property, Plant & Equipment | GBP mil | ... | 68.4 | 77.0 | 125 | 113 | ... | ... | ... | ... | ... | |||||||||||||||||
| LT Investments & Receivables | GBP mil | ... | 1.11 | 1.18 | 1.10 | 1.10 | ... | ... | ... | ... | ... | |||||||||||||||||
| Intangible Assets | GBP mil | ... | 427 | 517 | 475 | 446 | ... | ... | ... | ... | ... | |||||||||||||||||
| Goodwill | GBP mil | ... | 324 | 382 | 371 | 362 | ... | ... | ... | ... | ... | |||||||||||||||||
| Non-Current Assets | GBP mil | ... | 510 | 612 | 619 | 576 | ... | ... | ... | ... | ... | |||||||||||||||||
| Total Assets | GBP mil | ... | 698 | 857 | 833 | 802 | ... | ... | ... | ... | ... | |||||||||||||||||
| Trade Payables | GBP mil | ... | 34.8 | 48.6 | 91.4 | 91.2 | ... | ... | ... | ... | ... | |||||||||||||||||
| Short-Term Debt | GBP mil | ... | 1.11 | 1.52 | 6.30 | 45.7 | ... | ... | ... | ... | ... | |||||||||||||||||
| Other ST Liabilities | GBP mil | ... | 13.8 | 9.89 | 3.20 | 1.50 | ... | ... | ... | ... | ... | |||||||||||||||||
| Current Liabilities | GBP mil | ... | 82.0 | 103 | 101 | 138 | ... | ... | ... | ... | ... | |||||||||||||||||
| Long-Term Debt | GBP mil | ... | 204 | 259 | 219 | 177 | ... | ... | ... | ... | ... | |||||||||||||||||
| Other LT Liabilities | GBP mil | ... | 47.0 | 61.3 | 96.9 | 43.7 | ... | ... | ... | ... | ... | |||||||||||||||||
| Non-Current Liabilities | GBP mil | ... | 251 | 321 | 316 | 221 | ... | ... | ... | ... | ... | |||||||||||||||||
| Liabilities | GBP mil | ... | 333 | 423 | 416 | 359 | ... | ... | ... | ... | ... | |||||||||||||||||
| Preferred Equity and Hybrid Capital | GBP mil | ... | 0 | 0 | 0 | 0 | ... | ... | ... | ... | ... | |||||||||||||||||
| Share Capital | GBP mil | ... | 90.3 | 142 | 9.80 | 9.80 | ... | ... | ... | ... | ... | |||||||||||||||||
| Treasury Stock | GBP mil | ... | ... | ... | ... | ... | ... | ... | 2.78 | 4.89 | 4.30 | 3.40 | ... | ... | ... | ... | ... | |||||||||||
| Equity Before Minority Interest | GBP mil | ... | 365 | 434 | 416 | 443 | ... | ... | ... | ... | ... | |||||||||||||||||
| Minority Interest | GBP mil | ... | 0 | 0 | 0 | 0 | ... | ... | ... | ... | ... | |||||||||||||||||
| Equity | GBP mil | ... | 365 | 434 | 416 | 443 | ... | ... | ... | ... | ... | |||||||||||||||||
| growth rates | ||||||||||||||||||||||||||||
| Total Asset Growth | % | ... | ... | -6.03 | 22.8 | -2.87 | -3.64 | ... | ... | ... | ... | ... | ||||||||||||||||
| Shareholders' Equity Growth | % | ... | ... | -3.34 | 19.0 | -4.04 | 6.44 | ... | ... | ... | ... | ... | ||||||||||||||||
| Net Debt Growth | % | ... | ... | -7.23 | 28.2 | -15.8 | -12.9 | -16.7 | ||||||||||||||||||||
| Total Debt Growth | % | ... | ... | ... | ... | -5.11 | 26.9 | -13.7 | -0.889 | ... | ... | ... | ... | ... | ||||||||||||||
| ratios | ||||||||||||||||||||||||||||
| Total Debt | GBP mil | ... | 205 | 261 | 225 | 223 | ... | ... | ... | ... | ... | |||||||||||||||||
| Net Debt | GBP mil | ... | 163 | 209 | 176 | 153 | 128 | |||||||||||||||||||||
| Working Capital | GBP mil | ... | 97.6 | 128 | -15.1 | -18.4 | ... | ... | ... | ... | ... | |||||||||||||||||
| Capital Employed | GBP mil | ... | 607 | 741 | 604 | 558 | ... | ... | ... | ... | ... | |||||||||||||||||
| Net Debt/Equity | % | ... | 44.7 | 48.1 | 42.3 | 34.6 | ... | ... | ... | ... | ... | |||||||||||||||||
| Current Ratio | ... | 2.29 | 2.38 | 2.12 | 1.64 | ... | ... | ... | ... | ... | ||||||||||||||||||
| Quick Ratio | ... | 1.21 | 1.20 | 1.24 | 1.03 | ... | ... | ... | ... | ... |
| cash flow | Unit | 1999 | 2000 | 2001 | 2002 | 2003 | 2004 | 2005 | 2006 | 2007 | 2008 | 2009 | 2010 | 2011 | 2012 | 2013 | 2014 | 2015 | 2016 | 2017 | 2018 | 2019 | 2020 | 2021 | 2022 | 2023 | 2024 | 2025 |
| cash flow | ||||||||||||||||||||||||||||
| Net Profit | GBP mil | ... | 31.2 | 26.3 | 17.7 | 37.2 | 45.9 | |||||||||||||||||||||
| Depreciation | GBP mil | ... | 11.6 | 12.5 | 20.6 | 20.4 | 20.2 | |||||||||||||||||||||
| Non-Cash Items | GBP mil | ... | -8.06 | 1.40 | -3.30 | -15.6 | ... | ... | ... | ... | ... | |||||||||||||||||
| Change in Working Capital | GBP mil | ... | -14.7 | -3.93 | 22.1 | 8.30 | ... | ... | ... | ... | ... | |||||||||||||||||
| Total Cash From Operations | GBP mil | ... | 44.3 | 63.5 | 82.1 | 70.6 | ... | ... | ... | ... | ... | |||||||||||||||||
| Capital Expenditures | GBP mil | ... | ... | ... | ... | ... | ... | ... | ... | ... | ... | -12.6 | -12.0 | -10.7 | -10.5 | ... | ... | ... | ... | ... | ||||||||
| Net Change in LT Investment | GBP mil | ... | 0 | 0 | 0 | 0 | ... | ... | ... | ... | ... | |||||||||||||||||
| Net Cash From Acquisitions | GBP mil | ... | ... | ... | ... | ... | ... | ... | ... | ... | ... | -5.14 | -106 | -0.900 | -1.50 | ... | ... | ... | ... | ... | ||||||||
| Other Investing Activities | GBP mil | ... | -1.16 | 0 | 0 | 0 | ... | ... | ... | ... | ... | |||||||||||||||||
| Total Cash From Investing | GBP mil | ... | -18.9 | -118 | -11.6 | -12.0 | ... | ... | ... | ... | ... | |||||||||||||||||
| Dividends Paid | GBP mil | ... | -19.5 | -22.4 | -23.6 | 0 | ... | ... | ... | ... | ... | |||||||||||||||||
| Issuance Of Shares | GBP mil | ... | -0.847 | 47.2 | -2.00 | -0.300 | ... | ... | ... | ... | ... | |||||||||||||||||
| Issuance Of Debt | GBP mil | ... | -2.91 | 43.2 | -45.5 | -50.5 | ... | ... | ... | ... | ... | |||||||||||||||||
| Other Financing Activities | GBP mil | ... | 0 | -2.01 | -0.300 | 0 | ... | ... | ... | ... | ... | |||||||||||||||||
| Total Cash From Financing | GBP mil | ... | -23.3 | 66.0 | -71.4 | -50.8 | ... | ... | ... | ... | ... | |||||||||||||||||
| Effect of FX Rates | GBP mil | ... | ... | ... | ... | ... | ... | ... | ... | ... | ... | -0.507 | -1.79 | -2.00 | 20.7 | ... | ... | ... | ... | ... | ||||||||
| Net Change In Cash | GBP mil | ... | 1.65 | 9.31 | -2.90 | 28.5 | ... | ... | ... | ... | ... | |||||||||||||||||
| ratios | ||||||||||||||||||||||||||||
| Days Sales Outstanding | days | ... | 39.9 | 44.2 | 45.4 | 46.4 | ... | ... | ... | ... | ... | |||||||||||||||||
| Days Sales Of Inventory | days | ... | 82.9 | 100 | 0 | 0 | ... | ... | ... | ... | ... | |||||||||||||||||
| Days Payable Outstanding | days | ... | 38.3 | 46.2 | 81.7 | 87.4 | ... | ... | ... | ... | ... | |||||||||||||||||
| Cash Conversion Cycle | days | ... | 84.5 | 98.2 | -36.4 | -41.0 | ... | ... | ... | ... | ... | |||||||||||||||||
| Cash Earnings | GBP mil | ... | 42.8 | 38.8 | 38.3 | 57.6 | 66.1 | |||||||||||||||||||||
| Free Cash Flow | GBP mil | ... | 25.4 | -54.9 | 70.5 | 58.6 | ... | ... | ... | ... | ... | |||||||||||||||||
| Capital Expenditures (As % of Sales) | % | ... | ... | ... | ... | ... | ... | ... | ... | ... | ... | 2.42 | 2.03 | 1.74 | 1.83 | ... | ... | ... | ... | ... |
| other ratios | Unit | 1999 | 2000 | 2001 | 2002 | 2003 | 2004 | 2005 | 2006 | 2007 | 2008 | 2009 | 2010 | 2011 | 2012 | 2013 | 2014 | 2015 | 2016 | 2017 | 2018 | 2019 | 2020 | 2021 | 2022 | 2023 | 2024 | 2025 |
| Employees | ... | 3,964 | 4,303 | 4,303 | ... | ... | ... | ... | ... | ... | ||||||||||||||||||
| Cost Per Employee | USD per month | ... | ... | 3,875 | 3,605 | ... | ... | ... | ... | ... | ... | ... | ||||||||||||||||
| Cost Per Employee (Local Currency) | GBP per month | ... | ... | 3,009 | 2,754 | ... | ... | ... | ... | ... | ... | ... | ||||||||||||||||
| Operating Cost (As % of Sales) | % | ... | 27.8 | 26.7 | 26.9 | 23.1 | ... | ... | ... | ... | ... | |||||||||||||||||
| Research & Development (As % of Sales) | % | ... | ... | ... | ... | ... | ... | ... | ... | ... | ... | 0 | 0 | 0 | 0 | ... | ... | ... | ... | ... | ||||||||
| Staff Cost (As % of Sales) | % | ... | ... | 27.4 | 24.0 | ... | ... | ... | ... | ... | ... | ... | ||||||||||||||||
| Effective Tax Rate | % | ... | 9.65 | 32.2 | 28.6 | 21.8 | ... | ... | ... | ... | ... | |||||||||||||||||
| Total Revenue Growth (5-year average) | % | ... | ... | ... | ... | ... | ... | 18.0 | 14.7 | 11.8 | 10.1 | 6.48 | ||||||||||||||||
| Total Revenue Growth (10-year average) | % | ... | ... | ... | ... | ... | ... | ... | ... | ... | ... | ... | 9.20 | 8.30 | 9.77 | 8.54 | 11.2 |
| valuation | Unit | 1999 | 2000 | 2001 | 2002 | 2003 | 2004 | 2005 | 2006 | 2007 | 2008 | 2009 | 2010 | 2011 | 2012 | 2013 | 2014 | 2015 | 2016 | 2017 | 2018 | 2019 | 2020 | 2021 | 2022 | 2023 | 2024 | 2025 |
| Market Capitalisation | USD mil | 875 | 588 | 707 | 27.7 | 1,031 | ||||||||||||||||||||||
| Enterprise Value (EV) | USD mil | ... | 1,095 | 854 | 940 | 237 | 1,198 | |||||||||||||||||||||
| Number Of Shares | mil | 178 | 193 | 196 | 196 | 196 | ||||||||||||||||||||||
| Share Price | GBP | 3.27 | 2.19 | 2.66 | 3.51 | 4.02 | ||||||||||||||||||||||
| EV/EBITDA | ... | 10.5 | 7.25 | 8.46 | 1.76 | 8.24 | ||||||||||||||||||||||
| Price/Earnings (P/E) | 18.7 | 16.1 | 29.4 | 51.1 | 17.2 | |||||||||||||||||||||||
| Price/Cash Earnings (P/CE) | ... | 13.6 | 10.9 | 13.6 | 11.9 | 11.9 | ||||||||||||||||||||||
| P/FCF | ... | 23.0 | -7.71 | 7.39 | 11.7 | ... | ... | ... | ... | ... | ||||||||||||||||||
| Price/Book Value (P/BV) | ... | 1.60 | 0.975 | 1.25 | 1.55 | ... | ... | ... | ... | ... | ||||||||||||||||||
| Dividend Yield | % | 3.37 | 5.24 | 4.54 | 1.73 | ... | ... | ... | ... | ... | ||||||||||||||||||
| Free Cash Flow Yield | % | ... | 3.74 | -12.2 | 12.9 | 283 | ... | ... | ... | ... | ... | |||||||||||||||||
| Earnings Per Share (EPS) | GBP | 0.175 | 0.137 | 0.091 | 0.069 | 0.234 | ||||||||||||||||||||||
| Cash Earnings Per Share | GBP | ... | 0.240 | 0.201 | 0.196 | 0.293 | 0.337 | |||||||||||||||||||||
| Free Cash Flow Per Share | GBP | ... | 0.142 | -0.284 | 0.360 | 0.299 | ... | ... | ... | ... | ... | |||||||||||||||||
| Book Value Per Share | GBP | ... | 2.04 | 2.25 | 2.13 | 2.26 | ... | ... | ... | ... | ... | |||||||||||||||||
| Dividend Per Share | GBP | 0.110 | 0.115 | 0.121 | 0.061 | ... | ... | ... | ... | ... | ||||||||||||||||||
| EV/Sales | ... | 1.63 | 1.10 | 1.19 | 0.309 | 1.43 | ||||||||||||||||||||||
| EV/EBIT | ... | 18.7 | 13.0 | 18.0 | 2.97 | 10.1 | ||||||||||||||||||||||
| EV/Free Cash Flow | ... | 33.5 | -11.9 | 10.3 | 3.02 | ... | ... | ... | ... | ... | ||||||||||||||||||
| EV/Capital Employed | ... | 1.33 | 0.904 | 1.17 | 0.311 | ... | ... | ... | ... | ... | ||||||||||||||||||
| Earnings Per Share Growth | % | ... | 46.6 | -21.9 | -33.7 | -24.2 | 241 | |||||||||||||||||||||
| Cash Earnings Per Share Growth | % | ... | ... | 32.6 | -16.1 | -2.72 | 49.9 | 14.7 | ||||||||||||||||||||
| Book Value Per Share Growth | % | ... | ... | -5.87 | 10.1 | -5.43 | 6.12 | ... | ... | ... | ... | ... |
Get all company financials in excel:


By Helgi Library - December 19, 2021
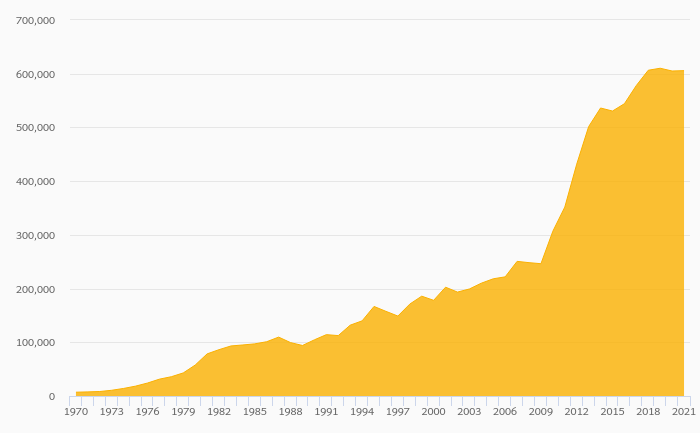
Tyman made a net profit of GBP 37.2 mil with revenues of GBP 573 mil in 2020, up by 110% and down by 6.66%, respectively, compared to the previous year. This translates into a net margin of 6.49%. Historically, between 2000 and 2020, the firm’s ne...
By Helgi Library - December 19, 2021
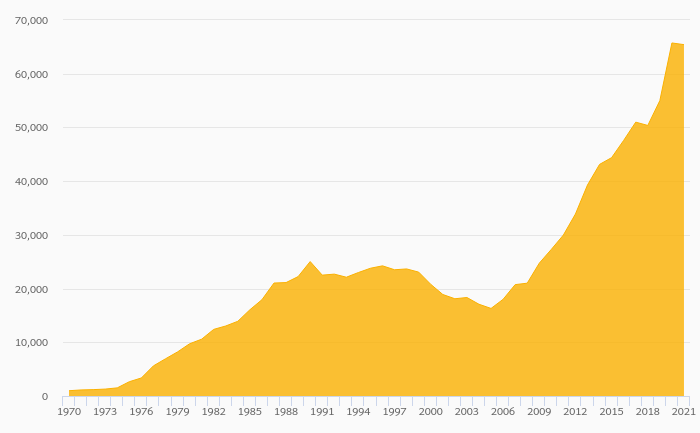
Tyman invested a total of GBP 10.5 mil in 2020, down 1.87% compared to the previous year. Historically, between 2009 - 2020, the company's investments stood at a high of GBP 15.3 mil in 2016 and a low of GBP 2.24 mil in 2009. As a per...
By Helgi Library - December 19, 2021
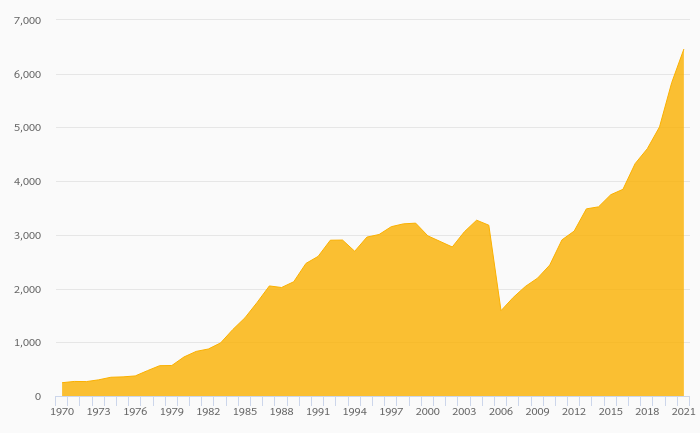
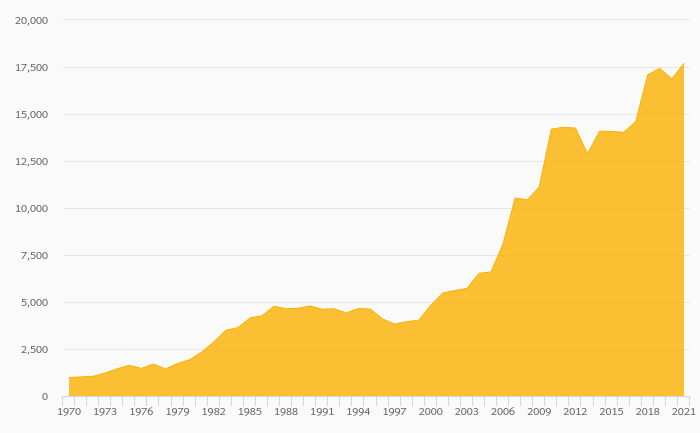
Tyman made a net profit of GBP 37.2 mil in 2020, up 110% compared to the previous year. Historically, between 2000 and 2020, the company's net profit reached a high of GBP 37.2 mil in 2020 and a low of GBP -5.59 mil in 2004. The result implies a return on...
By Helgi Library - December 19, 2021
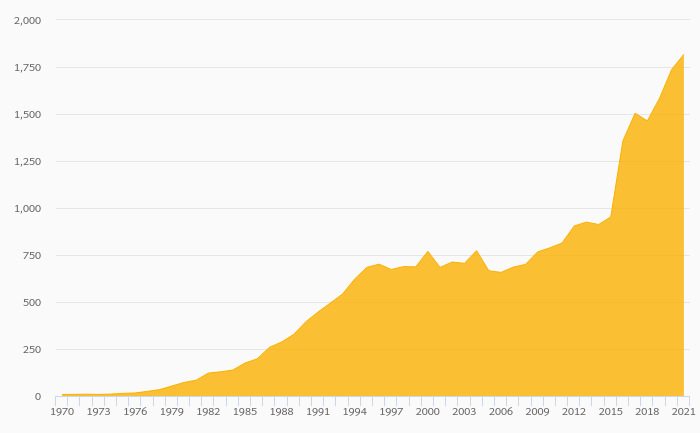
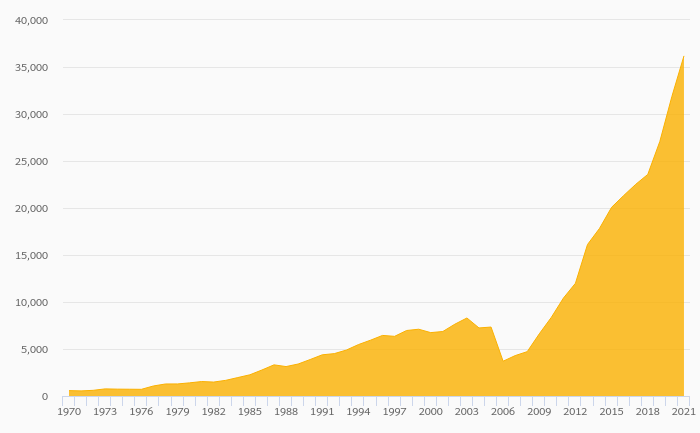
Tyman's net debt stood at GBP 153 mil and accounted for 34.6% of equity at the end of 2020. The ratio is down 7.68 pp compared to the previous year. Historically, the firm’s net debt to equity reached a high of 61.2% in 2008 and a low of -18....
By Helgi Library - December 19, 2021
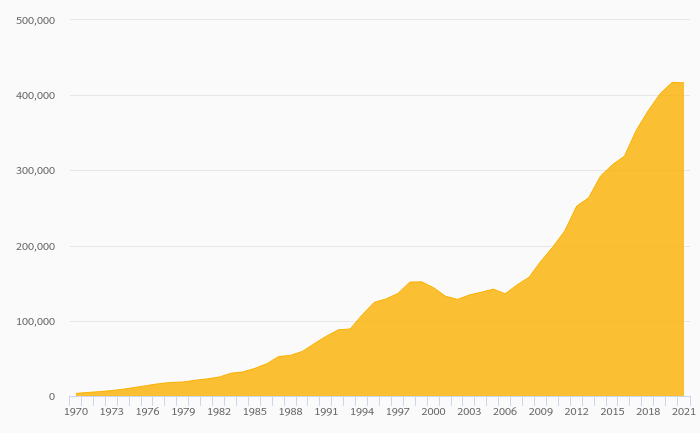
Tyman stock traded at GBP 3.51 per share at the end 2020 translating into a market capitalization of USD 27.7 mil. Since the end of 2015, the stock has appreciated by 37.6% representing an annual average growth of 6.60%. At the end of 2020, the firm trad...
By Helgi Library - December 19, 2021
Tyman employed 4,303 employees in 2019, up 0% compared to the previous year. Historically, between 2000 and 2019, the firm's workforce hit a high of 4,303 employees in 2019 and a low of 28.0 employees in 2003. Average personnel cost stood at per emp...
Tyman has been growing its sales by 3.29% a year on average in the last 5 years. EBITDA has grown on average by 6.26% a year during that time to total of GBP 136 mil in 2025, or 20.2% of sales. That’s compared to 18.7% average margin seen in last five years.
The company netted GBP 62.5 mil in 2025 implying ROE of and ROCE of . Again, the average figures were % and %, respectively when looking at the previous 5 years.
Tyman’s net debt amounted to GBP 2.15 mil at the end of 2025, or of equity. When compared to EBITDA, net debt was 0.016x, down when compared to average of 0.534x seen in the last 5 years.
Tyman stock traded at GBP 4.02 per share at the end of 2025 resulting in a market capitalization of USD 1,031 mil. Over the previous five years, stock price grew by 14.7% or 2.78% a year on average. The closing price put stock at a 12-month trailing EV/EBITDA of 5.82x and price to earnings (PE) of 12.6x as of 2025.
 Helgi Library