By Helgi Library - December 19, 2021
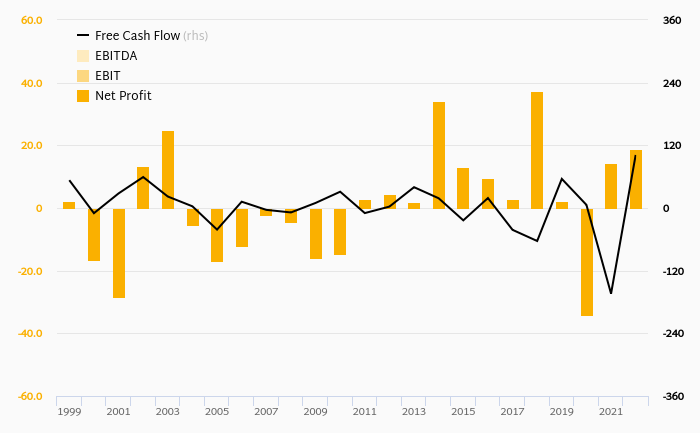
VEKA made a net profit of EUR 32.9 mil in 2019, up 23.2% compared to the previous year. Total sales reached EUR 1,129 mil, which...
By Helgi Library - December 19, 2021
VEKA made a net profit of EUR 32.9 mil in 2019, up 23.2% compared to the previous year. Historically, between 2009 and 2019,...
| Profit Statement | 2017 | 2018 | 2019 | |
| Sales | EUR mil | 1,043 | 1,094 | 1,129 |
| Gross Profit | EUR mil | 484 | 505 | 542 |
| EBIT | EUR mil | 54.4 | 50.7 | 57.5 |
| Financing Cost | EUR mil | 4.08 | 4.73 | 5.37 |
| Pre-Tax Profit | EUR mil | 50.3 | 46.0 | 52.1 |
| Net Profit | EUR mil | 32.2 | 26.7 | 32.9 |
| Balance Sheet | 2017 | 2018 | 2019 | |
| Total Assets | EUR mil | 642 | 686 | 705 |
| Non-Current Assets | EUR mil | 325 | 338 | 348 |
| Current Assets | EUR mil | 317 | 348 | 357 |
| Working Capital | EUR mil | 212 | 239 | 237 |
| Shareholders' Equity | EUR mil | 417 | 430 | 475 |
| Liabilities | EUR mil | 225 | 256 | 231 |
| Total Debt | EUR mil | 114 | 136 | ... |
| Net Debt | EUR mil | 67.7 | 88.5 | ... |
| Ratios | 2017 | 2018 | 2019 | |
| ROE | % | 7.89 | 6.31 | 7.27 |
| ROCE | % | 6.07 | 4.79 | 5.66 |
| Gross Margin | % | 46.4 | 46.1 | 48.0 |
| EBIT Margin | % | 5.22 | 4.64 | 5.09 |
| Net Margin | % | 3.09 | 2.44 | 2.91 |
| Net Debt/Equity | % | 16.2 | 20.6 | ... |
| Cost of Financing | % | 3.43 | 3.79 | ... |
| Cash Flow | 2017 | 2018 | 2019 | |
| Cash Conversion Cycle | days | 116 | 125 | 125 |
Get all company financials in excel:
| overview | Unit | 2009 | 2010 | 2011 | 2012 | 2013 | 2014 | 2015 | 2016 | 2017 | 2018 | 2019 |
| income statement | ||||||||||||
| Sales | EUR mil | 792 | 899 | ... | 1,002 | 1,043 | ||||||
| Gross Profit | EUR mil | 361 | 411 | ... | 478 | 484 | ||||||
| EBIT | EUR mil | 38.4 | 26.2 | ... | 61.7 | 54.4 | ||||||
| Net Profit | EUR mil | 14.3 | 7.62 | ... | 36.0 | 32.2 | ||||||
| ROE | % | 4.09 | 2.21 | ... | ... | 7.89 | ||||||
| EBIT Margin | % | 4.85 | 2.91 | ... | 6.16 | 5.22 | ||||||
| Net Margin | % | 1.81 | 0.847 | ... | 3.60 | 3.09 | ||||||
| Employees | ... | ... | ... | ... | ... | ... | ... | ... | ||||
| balance sheet | ||||||||||||
| Total Assets | EUR mil | 517 | 653 | ... | 648 | 642 | ||||||
| Non-Current Assets | EUR mil | 260 | 338 | ... | 314 | 325 | ||||||
| Current Assets | EUR mil | 258 | 315 | ... | 334 | 317 | ||||||
| Shareholders' Equity | EUR mil | 352 | 337 | ... | 400 | 417 | ||||||
| Liabilities | EUR mil | 166 | 316 | ... | 248 | 225 | ||||||
| Non-Current Liabilities | EUR mil | 73.8 | 204 | 0 | 140 | 122 | ||||||
| Current Liabilities | EUR mil | 91.9 | 112 | ... | 108 | 104 | ||||||
| Net Debt/Equity | % | 12.9 | 29.4 | ... | 13.5 | 16.2 | ... | |||||
| Cost of Financing | % | ... | 6.48 | 5.24 | ... | ... | 3.43 | ... |
| income statement | Unit | 2009 | 2010 | 2011 | 2012 | 2013 | 2014 | 2015 | 2016 | 2017 | 2018 | 2019 |
| income statement | ||||||||||||
| Sales | EUR mil | 792 | 899 | ... | 1,002 | 1,043 | ||||||
| Cost of Goods & Services | EUR mil | 431 | 488 | ... | 524 | 559 | ||||||
| Gross Profit | EUR mil | 361 | 411 | ... | 478 | 484 | ||||||
| EBIT | EUR mil | 38.4 | 26.2 | ... | 61.7 | 54.4 | ||||||
| Financing Cost | EUR mil | 5.05 | 6.04 | ... | 5.95 | 4.08 | ||||||
| Pre-Tax Profit | EUR mil | 33.4 | 20.2 | ... | 55.8 | 50.3 | ||||||
| Tax | EUR mil | 15.2 | 7.71 | ... | 15.3 | 13.4 | ||||||
| Net Profit | EUR mil | 14.3 | 7.62 | ... | 36.0 | 32.2 | ||||||
| Net Profit Avail. to Common | EUR mil | 14.3 | 7.62 | ... | 36.0 | 32.2 | ||||||
| growth rates | ||||||||||||
| Total Revenue Growth | % | ... | -0.067 | 13.6 | ... | ... | 4.03 | |||||
| EBIT Growth | % | ... | 24.5 | -31.8 | ... | ... | -11.8 | |||||
| Pre-Tax Profit Growth | % | ... | 33.7 | -39.5 | ... | ... | -9.74 | |||||
| Net Profit Growth | % | ... | 22.8 | -46.9 | ... | ... | -10.7 | |||||
| ratios | ||||||||||||
| ROE | % | 4.09 | 2.21 | ... | ... | 7.89 | ||||||
| ROA | % | 2.76 | 1.30 | ... | ... | 4.99 | ||||||
| ROCE | % | ... | 3.31 | 1.59 | ... | ... | 6.07 | |||||
| Gross Margin | % | 45.5 | 45.7 | ... | 47.7 | 46.4 | ||||||
| EBIT Margin | % | 4.85 | 2.91 | ... | 6.16 | 5.22 | ||||||
| Net Margin | % | 1.81 | 0.847 | ... | 3.60 | 3.09 | ||||||
| Cost of Financing | % | ... | 6.48 | 5.24 | ... | ... | 3.43 | ... |
| balance sheet | Unit | 2009 | 2010 | 2011 | 2012 | 2013 | 2014 | 2015 | 2016 | 2017 | 2018 | 2019 |
| balance sheet | ||||||||||||
| Cash & Cash Equivalents | EUR mil | 44.8 | 73.4 | ... | 88.2 | 63.1 | ||||||
| Receivables | EUR mil | 59.5 | 75.5 | ... | 75.2 | 76.3 | ||||||
| Inventories | EUR mil | 153 | 166 | ... | 170 | 177 | ||||||
| Current Assets | EUR mil | 258 | 315 | ... | 334 | 317 | ||||||
| Property, Plant & Equipment | EUR mil | 232 | 300 | ... | 279 | 280 | ||||||
| LT Investments & Receivables | EUR mil | 1.77 | 1.45 | ... | 1.08 | 9.36 | ||||||
| Intangible Assets | EUR mil | 2.00 | 23.2 | ... | 17.8 | 19.3 | ||||||
| Goodwill | EUR mil | ... | ... | 18.8 | ... | 13.2 | 11.4 | |||||
| Non-Current Assets | EUR mil | 260 | 338 | ... | 314 | 325 | ||||||
| Total Assets | EUR mil | 517 | 653 | ... | 648 | 642 | ||||||
| Trade Payables | EUR mil | 39.9 | 51.5 | ... | 36.5 | 41.2 | ||||||
| Short-Term Debt | EUR mil | 25.3 | 23.9 | ... | 27.9 | 28.7 | ||||||
| Other ST Liabilities | EUR mil | 26.7 | 37.1 | ... | 43.5 | 33.9 | ||||||
| Current Liabilities | EUR mil | 91.9 | 112 | ... | 108 | 104 | ||||||
| Long-Term Debt | EUR mil | 49.8 | 132 | ... | 95.6 | 85.6 | ... | |||||
| Other LT Liabilities | EUR mil | 24.0 | 72.4 | ... | 44.6 | 36.0 | ||||||
| Non-Current Liabilities | EUR mil | 73.8 | 204 | 0 | 140 | 122 | ||||||
| Liabilities | EUR mil | 166 | 316 | ... | 248 | 225 | ||||||
| Share Capital | EUR mil | 80.0 | 80.0 | ... | 80.0 | 80.0 | ||||||
| Equity Before Minority Interest | EUR mil | 349 | 334 | ... | 397 | 414 | ||||||
| Minority Interest | EUR mil | 2.32 | 3.00 | ... | 2.90 | 2.71 | ... | |||||
| Equity | EUR mil | 352 | 337 | ... | 400 | 417 | ||||||
| growth rates | ||||||||||||
| Total Asset Growth | % | ... | -0.833 | 26.3 | ... | ... | -0.881 | |||||
| Shareholders' Equity Growth | % | ... | 0.702 | -4.21 | ... | ... | 4.28 | |||||
| Net Debt Growth | % | ... | -9.75 | 119 | ... | ... | 25.5 | ... | ||||
| Total Debt Growth | % | ... | -7.14 | 107 | ... | ... | -7.48 | ... | ||||
| ratios | ||||||||||||
| Total Debt | EUR mil | 75.1 | 155 | ... | 124 | 114 | ... | |||||
| Net Debt | EUR mil | 45.2 | 99.1 | ... | 54.0 | 67.7 | ... | |||||
| Working Capital | EUR mil | 173 | 190 | ... | 209 | 212 | ||||||
| Capital Employed | EUR mil | 433 | 528 | ... | 523 | 538 | ||||||
| Net Debt/Equity | % | 12.9 | 29.4 | ... | 13.5 | 16.2 | ... | |||||
| Current Ratio | 2.81 | 2.80 | ... | 3.09 | 3.05 | |||||||
| Quick Ratio | 1.14 | 1.32 | ... | 1.51 | 1.34 |
| cash flow | Unit | 2009 | 2010 | 2011 | 2012 | 2013 | 2014 | 2015 | 2016 | 2017 | 2018 | 2019 |
| cash flow | ||||||||||||
| Net Profit | EUR mil | 14.3 | 7.62 | ... | 36.0 | 32.2 | ||||||
| ratios | ||||||||||||
| Days Sales Outstanding | days | 27.5 | 30.7 | ... | 27.4 | 26.7 | ||||||
| Days Sales Of Inventory | days | 130 | 124 | ... | 119 | 116 | ||||||
| Days Payable Outstanding | days | 33.8 | 38.5 | ... | 25.4 | 26.9 | ||||||
| Cash Conversion Cycle | days | 124 | 116 | ... | 121 | 116 |
| other ratios | Unit | 2009 | 2010 | 2011 | 2012 | 2013 | 2014 | 2015 | 2016 | 2017 | 2018 | 2019 |
| Employees | ... | ... | ... | ... | ... | ... | ... | ... | ||||
| Effective Tax Rate | % | 45.6 | 38.2 | ... | 27.5 | 26.6 | ||||||
| Total Revenue Growth (5-year average) | % | ... | ... | ... | ... | ... | 9.11 | ... | 6.37 | 5.65 | ||
| Total Revenue Growth (10-year average) | % | ... | ... | ... | ... | ... | ... | ... | ... | ... | ... |
Get all company financials in excel:
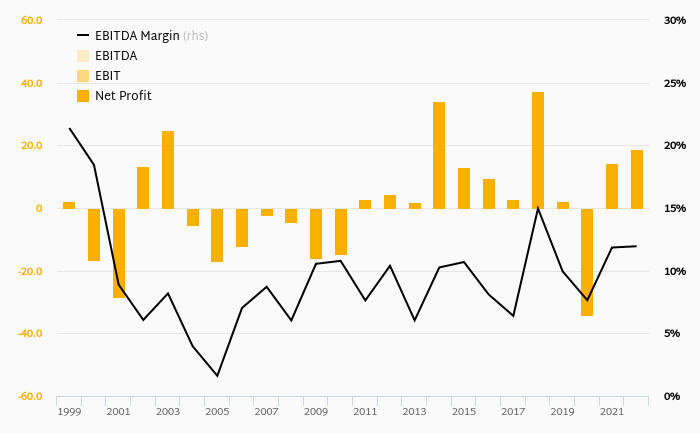


VEKA has been growing its sales by 4.66% a year on average in the last 5 years. EBITDA has grown by 0% during that time to total of in 2019, or of sales. That’s compared to % average margin seen in last five years.
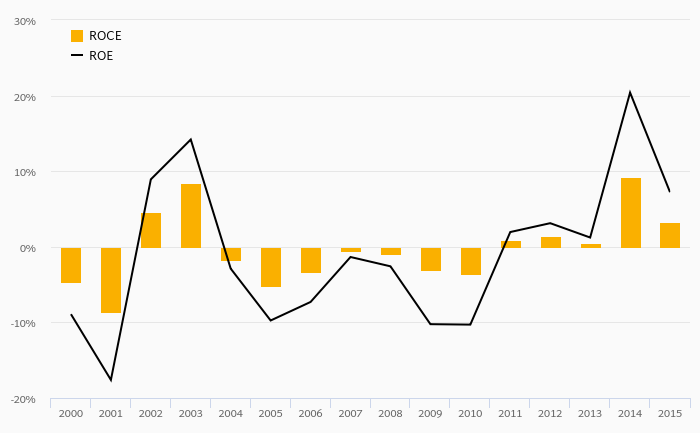
The company netted EUR 32.9 mil in 2019 implying ROE of 7.27% and ROCE of 5.66%. Again, the average figures were 7.16% and 5.51%, respectively when looking at the previous 5 years.
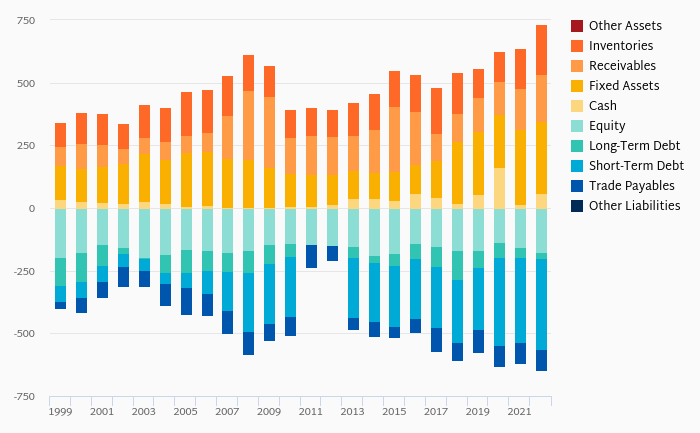
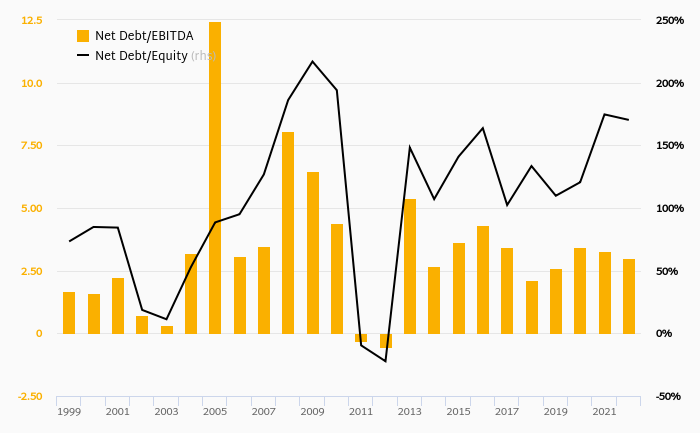
VEKA’s net debt amounted to at the end of 2019, or of equity. When compared to EBITDA, net debt was x, up when compared to average of x seen in the last 5 years.
 Helgi Library