
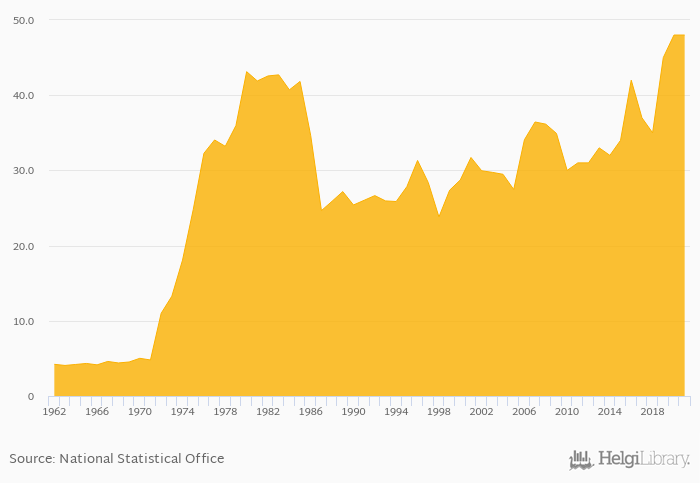
Total spice consumption rose 0% to 48.0 kt in Philippines in 2021, according to Faostat.
Historically, total spice consumption in Philippines reached an all time high of 48.0 kt in 2021 and an all time low of 4.06 kt in 1963.
Philippines has been ranked 33rd within the group of 147 countries we follow in terms of total spice consumption, 3 places above the position seen 10 years ago.
| Spice Consumption (Total) | Unit | 2001 | 2002 | 2003 | 2004 | 2005 | 2006 | 2007 | 2008 | 2009 | 2010 | 2011 | 2012 | 2013 | 2014 | 2015 | 2016 | 2017 | 2018 | 2019 | 2020 | 2021 |
| Australia | kt | 20.0 | 25.0 | 20.0 | 18.0 | 18.0 | ||||||||||||||||
| Cambodia | kt | 14.0 | 15.0 | 11.0 | 12.0 | 12.0 | ||||||||||||||||
| China | kt | 438 | 333 | 379 | 389 | 491 | ||||||||||||||||
| Hong Kong | kt | ... | ... | ... | ... | ... | ... | ... | ... | |||||||||||||
| India | kt | 2,957 | 3,587 | 4,278 | 4,675 | 4,911 | ||||||||||||||||
| Indonesia | kt | 392 | 394 | 427 | 448 | 495 | ||||||||||||||||
| Japan | kt | 160 | 157 | 153 | 144 | 147 | ||||||||||||||||
| Laos | kt | 17.0 | 16.0 | 16.0 | 16.0 | 14.0 | ||||||||||||||||
| Malaysia | kt | 142 | 152 | 151 | 158 | 170 | ||||||||||||||||
| Philippines | kt | 34.0 | 42.0 | 37.0 | 35.0 | 45.0 | ||||||||||||||||
| Russia | kt | 29.0 | 55.0 | 31.0 | 31.0 | 38.0 | ||||||||||||||||
| Singapore | kt | ... | ... | ... | ... | ... | ... | ... | ... | ... | ... | ... | ... | ... | ... | ... | ... | ... | ... | ... | ... | ... |
| Taiwan | kt | ... | ... | ... | ... | ... | ... | ... | ... | |||||||||||||
| Thailand | kt | 542 | 550 | 494 | 482 | 470 | ||||||||||||||||
| USA | kt | 308 | 310 | 313 | 318 | 347 | ||||||||||||||||
| Vietnam | kt | 122 | 118 | 142 | 177 | 101 |
 Helgi Library


