By Helgi Library - December 22, 2019
Barclays stock traded at 1.51 per share at the end third quarter of 2019 implying a market capitalization of USD 31,949 mil. Since the ...
By Helgi Library - December 22, 2019
Barclays's capital adequacy ratio reached 21.1% at the end of third quarter of 2019, down from 21.4% when compared to the previou...
By Helgi Library - December 22, 2019
Barclays stock traded at 1.51 per share at the end of third quarter of 2019 implying a market capitalization of USD 31,949 mil. ...
| Profit Statement | 2016 | 2017 | 2018 | |
| Net Interest Income | GBP mil | 10,545 | 9,893 | 9,153 |
| Net Fee Income | GBP mil | 6,768 | 6,814 | 6,809 |
| Other Income | GBP mil | 5,360 | 6,306 | 7,258 |
| Total Revenues | GBP mil | 22,673 | 23,013 | 23,220 |
| Operating Profit | GBP mil | 7,772 | 8,334 | 9,337 |
| Provisions | GBP mil | 2,352 | 2,333 | 1,465 |
| Net Profit | GBP mil | 2,080 | -1,283 | 2,146 |
| Balance Sheet | 2016 | 2017 | 2018 | |
| Interbank Loans | GBP mil | 56,705 | 48,209 | 2,308 |
| Customer Loans | GBP mil | 392,784 | 365,552 | 326,406 |
| Total Assets | GBP mil | 1,213,130 | 1,133,250 | 1,133,280 |
| Shareholders' Equity | GBP mil | 71,365 | 66,016 | 63,779 |
| Interbank Borrowing | GBP mil | 102,661 | 115,412 | 123,982 |
| Customer Deposits | GBP mil | 423,178 | 429,121 | 394,838 |
| Issued Debt Securities | GBP mil | 99,315 | 97,140 | 102,845 |
| Ratios | 2016 | 2017 | 2018 | |
| ROE | % | 3.03 | -1.87 | 3.31 |
| ROA | % | 0.178 | -0.109 | 0.189 |
| Costs (As % Of Assets) | % | 1.28 | 1.25 | 1.23 |
| Costs (As % Of Income) | % | 65.7 | 63.8 | 59.8 |
| Net Interest Margin | % | 0.904 | 0.843 | 0.808 |
| Loans (As % Of Deposits) | % | 92.8 | 85.2 | 82.7 |
| NPLs (As % Of Loans) | % | 1.63 | 1.62 | 2.55 |
| Provisions (As % Of NPLs) | % | 71.2 | 77.6 | 79.6 |
| Valuation | 2016 | 2017 | 2018 | |
| Price/Earnings (P/E) | 18.2 | ... | 12.0 | |
| Price/Book Value (P/BV) | 0.531 | 0.525 | 0.404 | |
| Dividend Yield | % | 1.34 | 1.47 | 4.32 |
| Earnings Per Share (EPS) | 0.122 | -0.074 | 0.123 | |
| Book Value Per Share | 4.19 | 3.82 | 3.67 | |
| Dividend Per Share | 0.030 | 0.029 | 0.064 | |
Get all company financials in excel:
| summary | Unit | 1988 | 1989 | 1990 | 1991 | 1992 | 1993 | 1994 | 1995 | 1996 | 1997 | 1998 | 1999 | 2000 | 2001 | 2002 | 2003 | 2004 | 2005 | 2006 | 2007 | 2008 | 2009 | 2010 | 2011 | 2012 | 2013 | 2014 | 2015 | 2016 | 2017 | 2018 |
| income statement | ||||||||||||||||||||||||||||||||
| Net Interest Income | GBP mil | 11,813 | 11,932 | 12,555 | 10,616 | 10,545 | ||||||||||||||||||||||||||
| Total Revenues | GBP mil | 31,038 | 29,903 | 26,916 | 22,725 | 22,673 | ||||||||||||||||||||||||||
| Operating Profit | GBP mil | 12,493 | 11,809 | 10,633 | 8,384 | 7,772 | ||||||||||||||||||||||||||
| Net Profit | GBP mil | -624 | 540 | 76.0 | -49.0 | 2,080 | ||||||||||||||||||||||||||
| balance sheet | ||||||||||||||||||||||||||||||||
| Interbank Loans | GBP mil | 216,984 | 226,201 | 173,864 | 69,536 | 56,705 | ||||||||||||||||||||||||||
| Customer Loans | GBP mil | 423,906 | 434,237 | 427,767 | 399,217 | 392,784 | ||||||||||||||||||||||||||
| Debt Securities | GBP mil | 268,090 | 263,793 | 239,083 | 244,445 | 222,165 | ||||||||||||||||||||||||||
| Total Assets | GBP mil | 1,488,340 | 1,343,630 | 1,357,910 | 1,120,010 | 1,213,130 | ||||||||||||||||||||||||||
| Shareholders' Equity | GBP mil | 59,986 | 63,949 | 65,958 | 65,864 | 71,365 | ||||||||||||||||||||||||||
| Interbank Borrowing | GBP mil | 338,984 | 305,827 | 227,993 | 106,082 | 102,661 | ||||||||||||||||||||||||||
| Customer Deposits | GBP mil | 385,411 | 431,998 | 427,704 | 418,242 | 423,178 | ||||||||||||||||||||||||||
| Issued Debt Securities | GBP mil | 143,543 | 108,388 | 107,252 | 90,617 | 99,315 | ||||||||||||||||||||||||||
| ratios | ||||||||||||||||||||||||||||||||
| ROE | % | -1.01 | 0.871 | 0.117 | -0.074 | 3.03 | ||||||||||||||||||||||||||
| ROA | % | -0.041 | 0.038 | 0.006 | -0.004 | 0.178 | ||||||||||||||||||||||||||
| Costs (As % Of Assets) | % | 1.22 | 1.28 | 1.21 | 1.16 | 1.28 | ||||||||||||||||||||||||||
| Costs (As % Of Income) | % | 59.7 | 60.5 | 60.5 | 63.1 | 65.7 | ||||||||||||||||||||||||||
| Net Interest Margin | % | 0.775 | 0.843 | 0.929 | 0.857 | 0.904 | ||||||||||||||||||||||||||
| Interest Income (As % Of Revenues) | % | 38.1 | 39.9 | 46.6 | 46.7 | 46.5 | ||||||||||||||||||||||||||
| Fee Income (As % Of Revenues) | % | 27.5 | 29.2 | 30.4 | 30.2 | 29.9 | ||||||||||||||||||||||||||
| Equity (As % Of Assets) | % | 4.03 | 4.76 | 4.86 | 5.88 | 5.88 | ||||||||||||||||||||||||||
| Loans (As % Of Deposits) | % | 110 | 101 | 100 | 95.5 | 92.8 | ||||||||||||||||||||||||||
| Loans (As % Assets) | % | 28.5 | 32.3 | 31.5 | 35.6 | 32.4 | ||||||||||||||||||||||||||
| NPLs (As % Of Loans) | % | 4.28 | 3.01 | 2.16 | 1.93 | 1.63 | ||||||||||||||||||||||||||
| Provisions (As % Of NPLs) | % | 51.9 | 54.5 | 58.4 | 63.0 | 71.2 | ||||||||||||||||||||||||||
| valuation | ||||||||||||||||||||||||||||||||
| Market Capitalisation (End Of Period) | USD mil | 52,186 | 72,597 | 62,603 | 54,513 | 46,629 | ||||||||||||||||||||||||||
| Number Of Shares (Average) | mil | 13,655 | 14,668 | 16,625 | 17,054 | 17,044 | ||||||||||||||||||||||||||
| Share Price (End Of Period) | 2.35 | 2.99 | 2.42 | 2.16 | 2.22 | |||||||||||||||||||||||||||
| Earnings Per Share (EPS) | -0.046 | 0.037 | 0.005 | -0.003 | 0.122 | |||||||||||||||||||||||||||
| Book Value Per Share | 4.39 | 4.36 | 3.97 | 3.86 | 4.19 | |||||||||||||||||||||||||||
| Dividend Per Share | 0.058 | 0.071 | 0.064 | 0.063 | 0.030 | |||||||||||||||||||||||||||
| Price/Earnings (P/E) | ... | ... | 81.1 | 529 | ... | 18.2 | ... | |||||||||||||||||||||||||
| Price/Book Value (P/BV) | 0.536 | 0.685 | 0.609 | 0.559 | 0.531 | |||||||||||||||||||||||||||
| Dividend Yield | % | 2.47 | 2.39 | 2.63 | 2.94 | 1.34 | ||||||||||||||||||||||||||
| Earnings Per Share Growth | % | ... | -121 | -181 | -87.6 | -163 | -4,347 | |||||||||||||||||||||||||
| Book Value Per Share Growth | % | ... | -6.87 | -0.754 | -9.00 | -2.65 | 8.42 |
| income statement | Unit | 1988 | 1989 | 1990 | 1991 | 1992 | 1993 | 1994 | 1995 | 1996 | 1997 | 1998 | 1999 | 2000 | 2001 | 2002 | 2003 | 2004 | 2005 | 2006 | 2007 | 2008 | 2009 | 2010 | 2011 | 2012 | 2013 | 2014 | 2015 | 2016 | 2017 | 2018 |
| income statement | ||||||||||||||||||||||||||||||||
| Interest Income | GBP mil | 19,370 | 18,647 | 17,838 | 13,961 | 14,549 | ||||||||||||||||||||||||||
| Interest Cost | GBP mil | 7,557 | 6,715 | 5,283 | 3,345 | 4,004 | ||||||||||||||||||||||||||
| Net Interest Income | GBP mil | 11,813 | 11,932 | 12,555 | 10,616 | 10,545 | ||||||||||||||||||||||||||
| Net Fee Income | GBP mil | 8,536 | 8,731 | 8,174 | 6,859 | 6,768 | ||||||||||||||||||||||||||
| Other Income | GBP mil | 10,689 | 9,240 | 6,187 | 5,250 | 5,360 | ||||||||||||||||||||||||||
| Total Revenues | GBP mil | 31,038 | 29,903 | 26,916 | 22,725 | 22,673 | ||||||||||||||||||||||||||
| Operating Cost | GBP mil | 18,545 | 18,094 | 16,283 | 14,341 | 14,901 | ||||||||||||||||||||||||||
| Operating Profit | GBP mil | 12,493 | 11,809 | 10,633 | 8,384 | 7,772 | ||||||||||||||||||||||||||
| Provisions | GBP mil | 3,340 | 3,071 | 2,168 | 1,744 | 2,352 | ||||||||||||||||||||||||||
| Extra and Other Cost | GBP mil | 8,356 | 5,870 | 6,209 | 5,494 | 2,190 | ||||||||||||||||||||||||||
| Pre-Tax Profit | GBP mil | 797 | 2,868 | 2,256 | 1,146 | 3,230 | ||||||||||||||||||||||||||
| Tax | GBP mil | 616 | 1,571 | 1,411 | 1,149 | 993 | ||||||||||||||||||||||||||
| Minorities | GBP mil | 805 | 757 | 769 | 672 | 748 | ||||||||||||||||||||||||||
| Net Profit | GBP mil | -624 | 540 | 76.0 | -49.0 | 2,080 | ||||||||||||||||||||||||||
| Dividends | GBP mil | 793 | 1,047 | 1,057 | 1,081 | 509 | ||||||||||||||||||||||||||
| growth rates | ||||||||||||||||||||||||||||||||
| Net Interest Income Growth | % | ... | -6.05 | 1.01 | 5.22 | -15.4 | -0.669 | |||||||||||||||||||||||||
| Net Fee Income Growth | % | ... | -0.997 | 2.28 | -6.38 | -16.1 | -1.33 | |||||||||||||||||||||||||
| Total Revenue Growth | % | ... | 3.32 | -3.66 | -9.99 | -15.6 | -0.229 | |||||||||||||||||||||||||
| Operating Cost Growth | % | ... | -1.72 | -2.43 | -10.0 | -11.9 | 3.90 | |||||||||||||||||||||||||
| Operating Profit Growth | % | ... | 11.8 | -5.48 | -9.96 | -21.2 | -7.30 | |||||||||||||||||||||||||
| Pre-Tax Profit Growth | % | ... | -86.2 | 260 | -21.3 | -49.2 | 182 | |||||||||||||||||||||||||
| Net Profit Growth | % | ... | -121 | -187 | -85.9 | -164 | -4,345 | |||||||||||||||||||||||||
| market share | ||||||||||||||||||||||||||||||||
| Market Share in Revenues | % | ... | ... | ... | ... | ... | ... | ... | ... | ... | ... | ... | ... | ... | ... | ... | ... | ... | ... | ... | ... | ... | ... | ... | ... | ... | ... | ... | ... | ... | ||
| Market Share in Net Profit | % | ... | ... | ... | ... | ... | ... | ... | ... | ... | ... | ... | ... | ... | ... | ... | ... | ... | ... | ... | ... | ... | ... | ... | ... | ... | ... | ... | ... | ... | ||
| Market Share in Employees | % | ... | ... | ... | ... | ... | ... | ... | ... | ... | ... | ... | ... | ... | ... | ... | ... | ... | ... | ... | ... | ... | ... | ... | ... | ... | ... | ... | ... | ... |
| balance sheet | Unit | 1988 | 1989 | 1990 | 1991 | 1992 | 1993 | 1994 | 1995 | 1996 | 1997 | 1998 | 1999 | 2000 | 2001 | 2002 | 2003 | 2004 | 2005 | 2006 | 2007 | 2008 | 2009 | 2010 | 2011 | 2012 | 2013 | 2014 | 2015 | 2016 | 2017 | 2018 |
| balance sheet | ||||||||||||||||||||||||||||||||
| Cash | GBP mil | 87,664 | 46,969 | 40,905 | 50,722 | 103,820 | ||||||||||||||||||||||||||
| Interbank Loans | GBP mil | 216,984 | 226,201 | 173,864 | 69,536 | 56,705 | ||||||||||||||||||||||||||
| Customer Loans | GBP mil | 423,906 | 434,237 | 427,767 | 399,217 | 392,784 | ||||||||||||||||||||||||||
| Mortgage Loans | GBP mil | ... | ... | ... | ... | ... | ... | ... | ... | ... | ... | ... | ... | ... | ... | ... | ... | ... | ... | ... | ... | ... | 171,993 | 179,527 | 166,974 | 155,863 | 144,765 | |||||
| Corporate Loans | GBP mil | 170,102 | 177,849 | 182,124 | 163,846 | 170,538 | ||||||||||||||||||||||||||
| Debt Securities | GBP mil | 268,090 | 263,793 | 239,083 | 244,445 | 222,165 | ||||||||||||||||||||||||||
| Fixed Assets | GBP mil | 13,669 | 11,901 | 11,966 | 11,690 | 10,551 | ||||||||||||||||||||||||||
| Total Assets | GBP mil | 1,488,340 | 1,343,630 | 1,357,910 | 1,120,010 | 1,213,130 | ||||||||||||||||||||||||||
| Shareholders' Equity | GBP mil | 59,986 | 63,949 | 65,958 | 65,864 | 71,365 | ||||||||||||||||||||||||||
| Of Which Minority Interest | GBP mil | 9,371 | 8,564 | 6,391 | 6,054 | 6,492 | ||||||||||||||||||||||||||
| Liabilities | GBP mil | 1,428,350 | 1,279,680 | 1,291,950 | 1,054,150 | 1,141,760 | ||||||||||||||||||||||||||
| Interbank Borrowing | GBP mil | 338,984 | 305,827 | 227,993 | 106,082 | 102,661 | ||||||||||||||||||||||||||
| Customer Deposits | GBP mil | 385,411 | 431,998 | 427,704 | 418,242 | 423,178 | ||||||||||||||||||||||||||
| Sight Deposits | GBP mil | 127,786 | 134,849 | 143,057 | 147,122 | 138,204 | ||||||||||||||||||||||||||
| Term Deposits | GBP mil | 257,625 | 297,149 | 284,647 | 271,120 | 284,974 | ||||||||||||||||||||||||||
| Issued Debt Securities | GBP mil | 143,543 | 108,388 | 107,252 | 90,617 | 99,315 | ||||||||||||||||||||||||||
| Other Liabilities | GBP mil | 560,411 | 433,466 | 528,999 | 439,207 | 516,607 | ||||||||||||||||||||||||||
| asset quality | ||||||||||||||||||||||||||||||||
| Non-Performing Loans | GBP mil | 18,565 | 13,298 | 9,338 | 7,817 | 6,491 | ||||||||||||||||||||||||||
| Gross Loans | GBP mil | 433,541 | 441,485 | 433,222 | 404,138 | 397,404 | ||||||||||||||||||||||||||
| Provisions | GBP mil | 3,340 | 3,071 | 2,168 | 1,744 | 2,352 | ||||||||||||||||||||||||||
| growth rates | ||||||||||||||||||||||||||||||||
| Customer Loan Growth | % | ... | -1.86 | 2.44 | -1.49 | -6.67 | -1.61 | |||||||||||||||||||||||||
| Retail Loan Growth | % | ... | 2.85 | 2.02 | -2.74 | -4.37 | -6.73 | |||||||||||||||||||||||||
| Mortgage Loan Growth | % | ... | ... | ... | ... | ... | ... | ... | ... | ... | ... | ... | ... | ... | ... | ... | ... | ... | ... | ... | ... | ... | ... | 0.421 | 4.38 | -6.99 | -6.65 | -7.12 | ||||
| Corporate Loan Growth | % | ... | -6.12 | 4.55 | 2.40 | -10.0 | 4.08 | |||||||||||||||||||||||||
| Total Asset Growth | % | ... | -4.72 | -9.72 | 1.06 | -17.5 | 8.31 | |||||||||||||||||||||||||
| Shareholders' Equity Growth | % | ... | -6.21 | 6.61 | 3.14 | -0.143 | 8.35 | |||||||||||||||||||||||||
| Customer Deposit Growth | % | ... | 5.29 | 12.1 | -0.994 | -2.21 | 1.18 | |||||||||||||||||||||||||
| market share | ||||||||||||||||||||||||||||||||
| Market Share in Customer Loans | % | ... | ... | ... | ... | ... | ... | ... | ... | ... | ... | ... | ... | ... | ... | ... | ... | ... | ... | ... | ... | ... | ... | ... | ... | ... | ... | ... | ... | ... | ||
| Market Share in Corporate Loans | % | ... | ... | ... | ... | ... | ... | ... | ... | ... | ... | ... | ... | ... | ... | ... | ... | ... | ... | ... | ... | ... | ... | ... | ... | ... | ... | ... | ... | ... | ||
| Market Share in Consumer Loans | % | ... | ... | ... | ... | ... | ... | ... | ... | ... | ... | ... | ... | ... | ... | ... | ... | ... | ... | ... | ... | ... | ... | ... | ... | ... | ... | ... | ... | ... | ||
| Market Share in Total Assets | % | ... | ... | ... | ... | ... | ... | ... | ... | ... | ... | ... | ... | ... | ... | ... | ... | ... | ... | ... | ... | ... | ... | ... | ... | ... | ... | ... | ... | ... | ||
| Market Share in Customer Deposits | % | ... | ... | ... | ... | ... | ... | ... | ... | ... | ... | ... | ... | ... | ... | ... | ... | ... | ... | ... | ... | ... | ... | ... | ... | ... | ... | ... | ... | ... |
| ratios | Unit | 1988 | 1989 | 1990 | 1991 | 1992 | 1993 | 1994 | 1995 | 1996 | 1997 | 1998 | 1999 | 2000 | 2001 | 2002 | 2003 | 2004 | 2005 | 2006 | 2007 | 2008 | 2009 | 2010 | 2011 | 2012 | 2013 | 2014 | 2015 | 2016 | 2017 | 2018 |
| ratios | ||||||||||||||||||||||||||||||||
| ROE | % | -1.01 | 0.871 | 0.117 | -0.074 | 3.03 | ||||||||||||||||||||||||||
| ROA | % | -0.041 | 0.038 | 0.006 | -0.004 | 0.178 | ||||||||||||||||||||||||||
| Costs (As % Of Assets) | % | 1.22 | 1.28 | 1.21 | 1.16 | 1.28 | ||||||||||||||||||||||||||
| Costs (As % Of Income) | % | 59.7 | 60.5 | 60.5 | 63.1 | 65.7 | ||||||||||||||||||||||||||
| Net Interest Margin | % | 0.775 | 0.843 | 0.929 | 0.857 | 0.904 | ||||||||||||||||||||||||||
| Interest Spread | % | ... | 0.754 | 0.821 | 0.910 | 0.842 | 0.882 | |||||||||||||||||||||||||
| Asset Yield | % | 1.27 | 1.32 | 1.32 | 1.13 | 1.25 | ||||||||||||||||||||||||||
| Cost Of Liabilities | % | ... | 0.516 | 0.496 | 0.411 | 0.285 | 0.365 | |||||||||||||||||||||||||
| Payout Ratio | % | 76.3 | 86.6 | 76.6 | 75.7 | 75.4 | ||||||||||||||||||||||||||
| Interest Income (As % Of Revenues) | % | 38.1 | 39.9 | 46.6 | 46.7 | 46.5 | ||||||||||||||||||||||||||
| Fee Income (As % Of Revenues) | % | 27.5 | 29.2 | 30.4 | 30.2 | 29.9 | ||||||||||||||||||||||||||
| Other Income (As % Of Revenues) | % | 34.4 | 30.9 | 23.0 | 23.1 | 23.6 | ||||||||||||||||||||||||||
| Equity (As % Of Assets) | % | 4.03 | 4.76 | 4.86 | 5.88 | 5.88 | ||||||||||||||||||||||||||
| Loans (As % Of Deposits) | % | 110 | 101 | 100 | 95.5 | 92.8 | ||||||||||||||||||||||||||
| Loans (As % Assets) | % | 28.5 | 32.3 | 31.5 | 35.6 | 32.4 | ||||||||||||||||||||||||||
| NPLs (As % Of Loans) | % | 4.28 | 3.01 | 2.16 | 1.93 | 1.63 | ||||||||||||||||||||||||||
| Provisions (As % Of NPLs) | % | 51.9 | 54.5 | 58.4 | 63.0 | 71.2 | ||||||||||||||||||||||||||
| Provisions (As % Of Loans) | % | 2.27 | 1.67 | 1.28 | 1.23 | 1.18 | ||||||||||||||||||||||||||
| Cost of Provisions (As % Of Loans) | % | 0.781 | 0.716 | 0.503 | 0.422 | 0.594 |
| other data | Unit | 1988 | 1989 | 1990 | 1991 | 1992 | 1993 | 1994 | 1995 | 1996 | 1997 | 1998 | 1999 | 2000 | 2001 | 2002 | 2003 | 2004 | 2005 | 2006 | 2007 | 2008 | 2009 | 2010 | 2011 | 2012 | 2013 | 2014 | 2015 | 2016 | 2017 | 2018 |
| other data | ||||||||||||||||||||||||||||||||
| Employees | 143,700 | 139,600 | 132,300 | 129,400 | 119,300 | |||||||||||||||||||||||||||
| Sight (As % Of Customer Deposits) | % | 33.2 | 31.2 | 33.4 | 35.2 | 32.7 |
Get all company financials in excel:


By Helgi Library - December 22, 2019
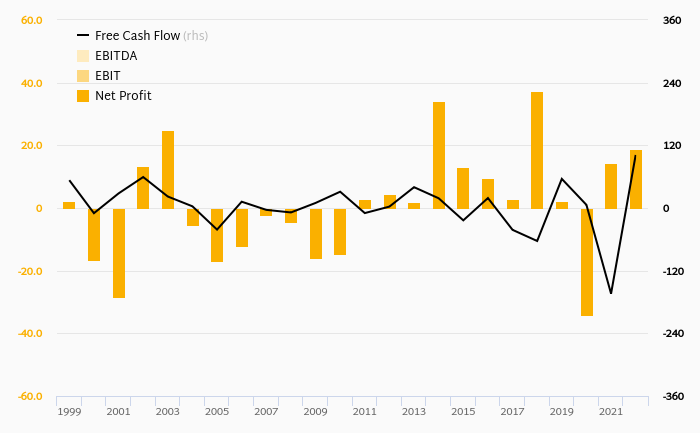
Barclays made a net profit of GBP -27.0 mil under revenues of GBP 5,541 mil in the third quarter of 2019, down 102% and up 8.03% respectively when compared to the same period last year. Historically, the bank’s net profit reached an all time high of G...
By Helgi Library - December 22, 2019
Barclays stock traded at 1.51 per share at the end of third quarter of 2019 implying a market capitalization of USD 31,949 mil. Over the last five years, the stock has depreciated by -33.7 % implying an annual average growth of -7.89 %. In absolute terms, the value of...
By Helgi Library - December 22, 2019
Barclays's non-performing loans reached 2.40% of total loans at the end of 2019-09-30, down from 2.55% compared to the previous year. Historically, the NPL ratio hit an all time high of 5.52% in 2010-12-31 and an all time low of 1.51% in 2017-03-31. Provisi...
By Helgi Library - December 22, 2019
Barclays's customer loan growth reached 4.94% in 2019-09-30, up from -14.3% compared to the previous year. Historically, the bank’s loans growth reached an all time high of 5.72% in 2019-06-30 and an all time low of -21.3% in 2018-03-31. In the last decad...
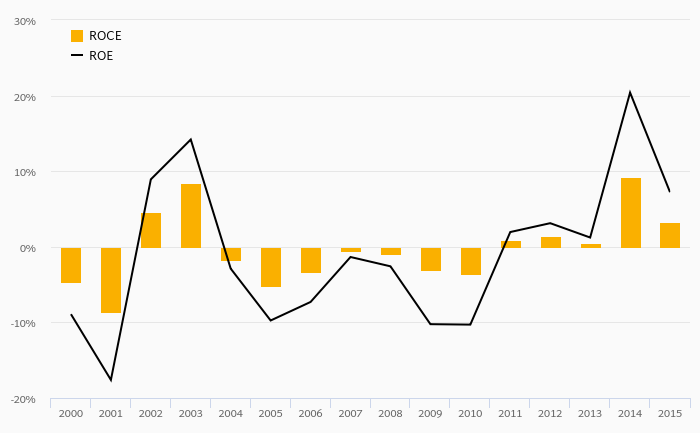
By Helgi Library - December 22, 2019
Barclays's Equity reached 5.79% of total assets in the 3Q2019, up from 5.49% for the previous year. As a share of net customer loans, the ratio amounted to 16.7% at the end of the third quarter of 2019. ...
By Helgi Library - December 22, 2019
Barclays's net interest margin amounted to 0.808% in 2018, down from 0.843% compared to the previous year. Historically, the bank’s net interest margin reached an all time high of 2.94% in 1989 and an all time low of 0.690% in 2009. The average margin i...
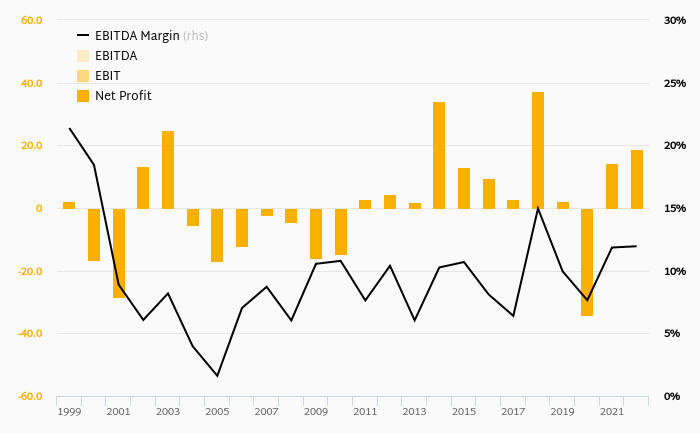
By Helgi Library - December 22, 2019
Barclays made a net profit of GBP 2,146 mil under revenues of GBP 23,220 mil in 2018, up 267% and 0.899% respectively compared to the previous year. Historically, the bank’s net profit reached an all time high of GBP 9,393 mil in 2009 and an all time low of GBP -1,28...
By Helgi Library - December 22, 2019
Barclays's non-performing loans reached 2.55% of total loans at the end of 2018, up from 1.62% compared to the previous year. Historically, the NPL ratio hit an all time high of 7.29% in 1993 and an all time low of 1.34% in 2004. Provision coverage amounted...
By Helgi Library - December 22, 2019
Barclays stock traded at 1.48 per share at the end 2018 implying a market capitalization of USD 32,740 mil. Since the end of 2013, the stock has depreciated by -50.3 % implying an annual average growth of -13.1 %. In absolute terms, the value of the company fell ...
By Helgi Library - December 22, 2019
Barclays stock traded at 1.48 per share at the end of 2018 implying a market capitalization of USD 32,740 mil. Since the end of 2013, the stock has depreciated by -50.3 % implying an annual average growth of -13.1 %. In absolute terms, the value of the company fe...
 Helgi Library