By Helgi Library - September 26, 2019
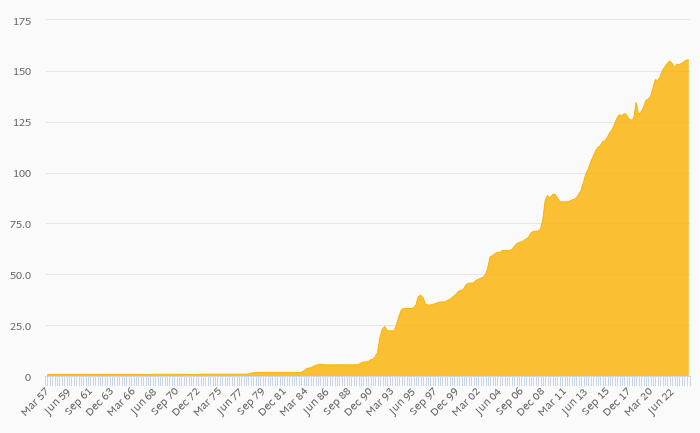
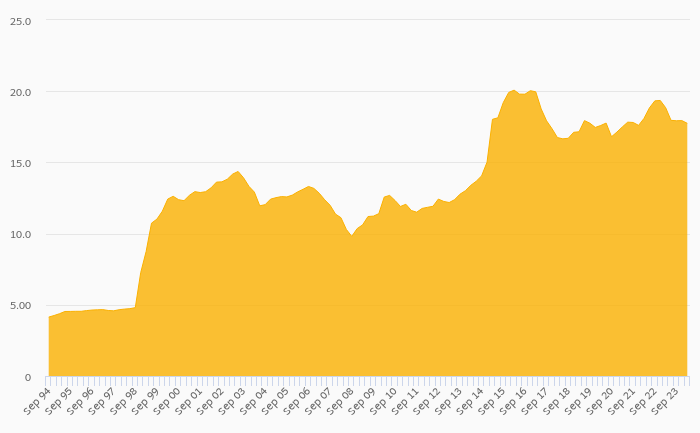
Clipan Finance Indonesia generated total banking revenues of IDR 1,360 bil in 2018, up 33.7% compared to the previous year. ...
By Helgi Library - September 26, 2019
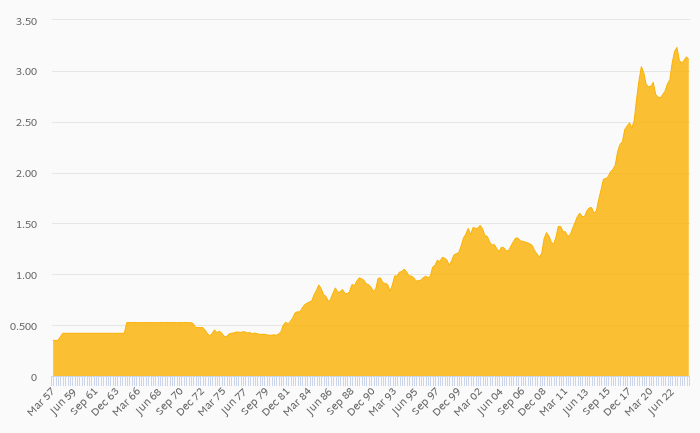
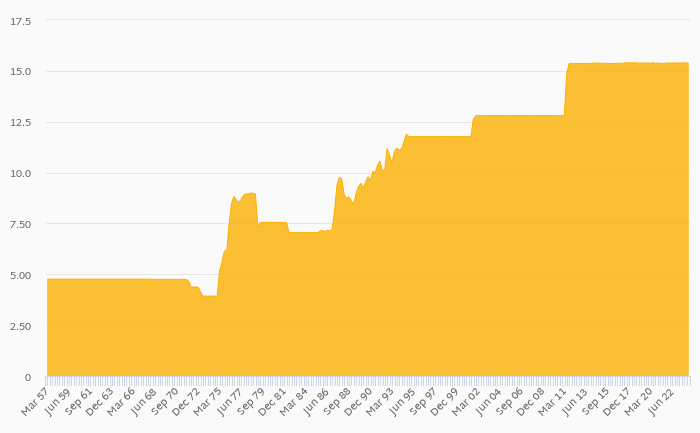
Clipan Finance Indonesia's net interest margin amounted to 9.07% in 2018, up from 7.65% compared to the previous year. His...
By Helgi Library - September 26, 2019
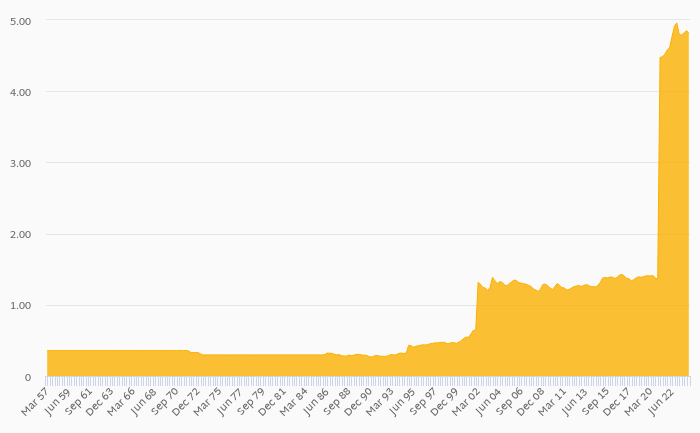
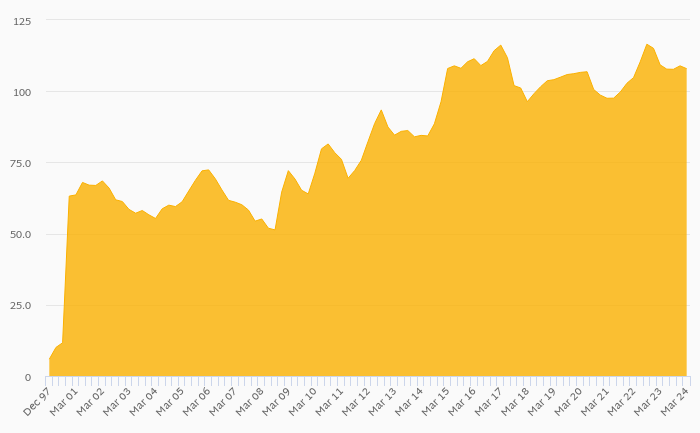
Clipan Finance Indonesia stock traded at RUB 314 per share at the end 2018 implying a market capitalization of USD 92.4 mil. Since the ...
| Profit Statement | 2016 | 2017 | 2018 | |
| Net Interest Income | IDR bil | 453 | 636 | 951 |
| Net Fee Income | IDR bil | 106 | 114 | 56.3 |
| Other Income | IDR bil | 158 | 267 | 353 |
| Total Revenues | IDR bil | 717 | 1,017 | 1,360 |
| Staff Cost | IDR bil | 122 | 217 | 288 |
| Operating Profit | IDR bil | 518 | 673 | 878 |
| Provisions | IDR bil | 235 | 330 | 453 |
| Net Profit | IDR bil | 205 | 236 | 305 |
| Balance Sheet | 2016 | 2017 | 2018 | |
| Interbank Loans | IDR bil | 0 | 10.9 | 10.4 |
| Customer Loans | IDR bil | 6,174 | 8,429 | 9,533 |
| Total Assets | IDR bil | 6,744 | 9,891 | 11,077 |
| Shareholders' Equity | IDR bil | 3,799 | 4,030 | 4,347 |
| Interbank Borrowing | IDR bil | 2,044 | 3,624 | 2,047 |
| Customer Deposits | IDR bil | 0 | 0 | 0 |
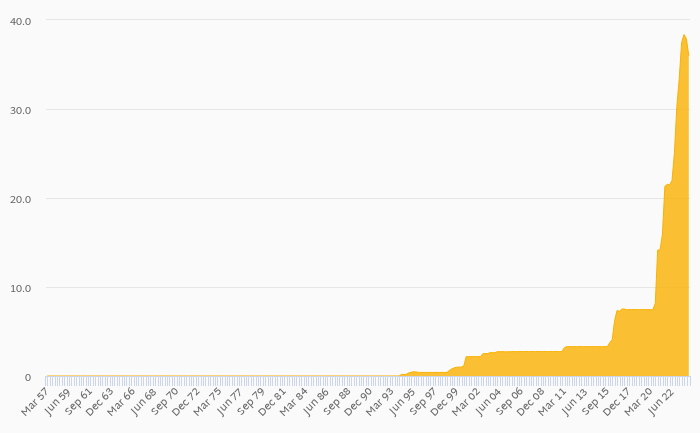
| Issued Debt Securities | IDR bil | 698 | 1,853 | 4,252 |
| Ratios | 2016 | 2017 | 2018 | |
| ROE | % | 5.55 | 6.04 | 7.29 |
| ROA | % | 3.07 | 2.84 | 2.91 |
| Costs (As % Of Assets) | % | 2.97 | 4.14 | 4.59 |
| Costs (As % Of Income) | % | 27.7 | 33.8 | 35.4 |
| Net Interest Margin | % | 6.77 | 7.65 | 9.07 |
| NPLs (As % Of Loans) | % | 1.98 | 1.59 | 1.28 |
| Provisions (As % Of NPLs) | % | 118 | 114 | 155 |
| Valuation | 2016 | 2017 | 2018 | |
| Price/Earnings (P/E) | 4.66 | 4.72 | 4.10 | |
| Price/Book Value (P/BV) | 0.252 | 0.277 | 0.288 | |
| Dividend Yield | % | 0 | 0 | 0 |
| Earnings Per Share (EPS) | IDR | 51.5 | 59.3 | 76.6 |
| Book Value Per Share | IDR | 953 | 1,011 | 1,091 |
| Dividend Per Share | 0 | 0 | 0 | |
Get all company financials in excel:
| summary | Unit | 2009 | 2010 | 2011 | 2012 | 2013 | 2014 | 2015 | 2016 | 2017 | 2018 |
| income statement | |||||||||||
| Net Interest Income | IDR bil | ... | 504 | 583 | 614 | 617 | 453 | ||||
| Total Revenues | IDR bil | ... | 604 | 707 | 727 | 752 | 717 | ||||
| Operating Profit | IDR bil | ... | 497 | 572 | 582 | 577 | 518 | ||||
| Net Profit | IDR bil | ... | 333 | 383 | 398 | 286 | 205 | ||||
| balance sheet | |||||||||||
| Interbank Loans | IDR bil | 0 | 0 | 0 | 0 | 0 | |||||
| Customer Loans | IDR bil | 4,523 | 5,824 | 6,436 | 6,409 | 6,174 | |||||
| Debt Securities | IDR bil | 0 | 0 | 0 | 0 | 0 | |||||
| Total Assets | IDR bil | 4,854 | 6,074 | 6,641 | 6,647 | 6,744 | |||||
| Shareholders' Equity | IDR bil | 2,450 | 2,765 | 3,257 | 3,599 | 3,799 | |||||
| Interbank Borrowing | IDR bil | 545 | 975 | 1,054 | 756 | 2,044 | |||||
| Customer Deposits | IDR bil | 0 | 0 | 0 | 0 | 0 | |||||
| Issued Debt Securities | IDR bil | 1,745 | 2,171 | 2,100 | 2,117 | 698 | |||||
| ratios | |||||||||||
| ROE | % | ... | 14.4 | 14.7 | 13.2 | 8.35 | 5.55 | ||||
| ROA | % | ... | 6.90 | 7.01 | 6.25 | 4.31 | 3.07 | ||||
| Costs (As % Of Assets) | % | ... | 2.22 | 2.45 | 2.29 | 2.63 | 2.97 | ||||
| Costs (As % Of Income) | % | ... | 17.7 | 19.0 | 20.0 | 23.3 | 27.7 | ||||
| Net Interest Margin | % | ... | 10.4 | 10.7 | 9.66 | 9.29 | 6.77 | ||||
| Interest Income (As % Of Revenues) | % | ... | 83.4 | 82.5 | 84.4 | 82.1 | 63.2 | ||||
| Fee Income (As % Of Revenues) | % | ... | 9.38 | 0 | 0 | 0 | 14.8 | ||||
| Staff Cost (As % Of Total Cost) | % | ... | ... | ... | ... | 56.7 | 56.4 | 57.5 | 61.3 | ||
| Equity (As % Of Assets) | % | 50.5 | 45.5 | 49.0 | 54.1 | 56.3 | |||||
| Loans (As % Assets) | % | 93.2 | 95.9 | 96.9 | 96.4 | 91.6 | |||||
| NPLs (As % Of Loans) | % | ... | ... | ... | ... | ... | ... | 1.89 | 1.98 | ||
| Provisions (As % Of NPLs) | % | ... | ... | ... | ... | ... | ... | 76.5 | 118 | ||
| valuation | |||||||||||
| Market Capitalisation (End Of Period) | USD mil | ... | ... | ... | 159 | 119 | 141 | 79.4 | 71.2 | ||
| Number Of Shares (Average) | mil | 3,775 | 3,775 | 3,985 | 3,985 | 3,985 | |||||
| Share Price (End Of Period) | RUB | ... | ... | ... | 405 | 385 | 439 | 275 | 240 | ||
| Earnings Per Share (EPS) | IDR | ... | 88.1 | 101 | 99.8 | 71.9 | 51.5 | ||||
| Book Value Per Share | IDR | 649 | 732 | 817 | 903 | 953 | |||||
| Dividend Per Share | ... | ... | 18.0 | 0 | 0 | 0 | 0 | ||||
| Price/Earnings (P/E) | ... | ... | ... | 4.60 | 3.80 | 4.40 | 3.83 | 4.66 | |||
| Price/Book Value (P/BV) | ... | ... | ... | 0.624 | 0.526 | 0.537 | 0.304 | 0.252 | |||
| Dividend Yield | % | ... | ... | ... | 4.44 | 0 | 0 | 0 | 0 | ||
| Earnings Per Share Growth | % | ... | ... | 20.4 | 15.1 | -1.64 | -28.0 | -28.3 | |||
| Book Value Per Share Growth | % | ... | 12.7 | 12.9 | 11.6 | 10.5 | 5.56 |
| income statement | Unit | 2009 | 2010 | 2011 | 2012 | 2013 | 2014 | 2015 | 2016 | 2017 | 2018 |
| income statement | |||||||||||
| Interest Income | IDR bil | ... | 779 | 850 | 934 | 977 | 769 | ||||
| Interest Cost | IDR bil | ... | 276 | 267 | 320 | 360 | 316 | ||||
| Net Interest Income | IDR bil | ... | 504 | 583 | 614 | 617 | 453 | ||||
| Net Fee Income | IDR bil | ... | 56.7 | 0 | 0 | 0 | 106 | ||||
| Other Income | IDR bil | ... | 43.9 | 124 | 113 | 134 | 158 | ||||
| Total Revenues | IDR bil | ... | 604 | 707 | 727 | 752 | 717 | ||||
| Staff Cost | IDR bil | ... | ... | ... | ... | 76.0 | 82.0 | 101 | 122 | ||
| Depreciation | IDR bil | ... | ... | ... | ... | 4.00 | 5.00 | 4.70 | 1.84 | ||
| Other Cost | IDR bil | ... | ... | ... | ... | 54.1 | 58.5 | 69.6 | 75.1 | ||
| Operating Cost | IDR bil | ... | 107 | 134 | 145 | 175 | 199 | ||||
| Operating Profit | IDR bil | ... | 497 | 572 | 582 | 577 | 518 | ||||
| Provisions | IDR bil | ... | 55.3 | 60.9 | 49.7 | 178 | 235 | ||||
| Extra and Other Cost | IDR bil | ... | 5.12 | 4.91 | 5.65 | 8.67 | 7.52 | ||||
| Pre-Tax Profit | IDR bil | ... | 437 | 507 | 527 | 390 | 276 | ||||
| Tax | IDR bil | ... | 104 | 124 | 129 | 103 | 70.6 | ||||
| Minorities | IDR bil | ... | 0 | 0 | 0 | 0 | 0 | ||||
| Net Profit | IDR bil | ... | 333 | 383 | 398 | 286 | 205 | ||||
| Dividends | IDR bil | ... | ... | 67.9 | 0 | 0 | 0 | 0 | |||
| growth rates | |||||||||||
| Net Interest Income Growth | % | ... | ... | 19.7 | 15.8 | 5.33 | 0.503 | -26.6 | |||
| Net Fee Income Growth | % | ... | ... | 8.29 | -100 | ... | ... | ... | |||
| Total Revenue Growth | % | ... | ... | 21.2 | 17.0 | 2.94 | 3.34 | -4.63 | |||
| Operating Cost Growth | % | ... | ... | 8.24 | 25.6 | 8.44 | 20.3 | 13.5 | |||
| Operating Profit Growth | % | ... | ... | 24.4 | 15.1 | 1.65 | -0.908 | -10.1 | |||
| Pre-Tax Profit Growth | % | ... | ... | 19.5 | 16.0 | 3.93 | -26.0 | -29.2 | |||
| Net Profit Growth | % | ... | ... | 20.4 | 15.1 | 3.82 | -28.0 | -28.3 |
| balance sheet | Unit | 2009 | 2010 | 2011 | 2012 | 2013 | 2014 | 2015 | 2016 | 2017 | 2018 |
| balance sheet | |||||||||||
| Cash | IDR bil | 189 | 95.6 | 35.8 | 30.4 | 30.3 | |||||
| Interbank Loans | IDR bil | 0 | 0 | 0 | 0 | 0 | |||||
| Customer Loans | IDR bil | 4,523 | 5,824 | 6,436 | 6,409 | 6,174 | |||||
| Retail Loans | IDR bil | ... | ... | ... | ... | 3,668 | 4,584 | 4,981 | 5,009 | ||
| Mortgage Loans | IDR bil | 0 | 0 | 0 | 0 | 0 | |||||
| Consumer Loans | IDR bil | ... | ... | ... | ... | 3,668 | 4,584 | 4,981 | 5,009 | ||
| Corporate Loans | IDR bil | ... | ... | ... | ... | 2,157 | 1,852 | 1,428 | 1,287 | ||
| Debt Securities | IDR bil | 0 | 0 | 0 | 0 | 0 | |||||
| Fixed Assets | IDR bil | 48.3 | 55.5 | 70.2 | 122 | 137 | |||||
| Total Assets | IDR bil | 4,854 | 6,074 | 6,641 | 6,647 | 6,744 | |||||
| Shareholders' Equity | IDR bil | 2,450 | 2,765 | 3,257 | 3,599 | 3,799 | |||||
| Of Which Minority Interest | IDR bil | 0 | 0 | 0 | 0 | 0 | |||||
| Liabilities | IDR bil | 2,404 | 3,310 | 3,384 | 3,048 | 2,945 | |||||
| Interbank Borrowing | IDR bil | 545 | 975 | 1,054 | 756 | 2,044 | |||||
| Customer Deposits | IDR bil | 0 | 0 | 0 | 0 | 0 | |||||
| Issued Debt Securities | IDR bil | 1,745 | 2,171 | 2,100 | 2,117 | 698 | |||||
| Other Liabilities | IDR bil | 114 | 163 | 230 | 174 | 203 | |||||
| asset quality | |||||||||||
| Non-Performing Loans | IDR bil | ... | ... | ... | ... | ... | ... | 123 | 104 | ||
| Gross Loans | IDR bil | 4,546 | 5,862 | 6,485 | 6,503 | 5,231 | |||||
| Total Provisions | IDR bil | 23.5 | 37.6 | 49.2 | 94.3 | 122 | |||||
| growth rates | |||||||||||
| Customer Loan Growth | % | ... | 0.466 | 28.8 | 10.5 | -0.419 | -3.66 | ||||
| Retail Loan Growth | % | ... | ... | ... | ... | ... | 25.0 | 8.66 | 0.566 | ||
| Consumer Loan Growth | % | ... | ... | ... | ... | ... | 25.0 | 8.66 | 0.566 | ||
| Corporate Loan Growth | % | ... | ... | ... | ... | ... | -14.1 | -22.9 | -9.85 | ||
| Total Asset Growth | % | ... | 1.42 | 25.2 | 9.33 | 0.085 | 1.47 | ||||
| Shareholders' Equity Growth | % | ... | 12.7 | 12.9 | 17.8 | 10.5 | 5.56 |
| ratios | Unit | 2009 | 2010 | 2011 | 2012 | 2013 | 2014 | 2015 | 2016 | 2017 | 2018 |
| ratios | |||||||||||
| ROE | % | ... | 14.4 | 14.7 | 13.2 | 8.35 | 5.55 | ||||
| ROA | % | ... | 6.90 | 7.01 | 6.25 | 4.31 | 3.07 | ||||
| Costs (As % Of Assets) | % | ... | 2.22 | 2.45 | 2.29 | 2.63 | 2.97 | ||||
| Costs (As % Of Income) | % | ... | 17.7 | 19.0 | 20.0 | 23.3 | 27.7 | ||||
| Net Interest Margin | % | ... | 10.4 | 10.7 | 9.66 | 9.29 | 6.77 | ||||
| Interest Spread | % | ... | 5.17 | 6.22 | 5.14 | 3.52 | 0.942 | ||||
| Asset Yield | % | ... | 16.2 | 15.6 | 14.7 | 14.7 | 11.5 | ||||
| Cost Of Liabilities | % | ... | 11.0 | 9.34 | 9.55 | 11.2 | 10.5 | ||||
| Payout Ratio | % | ... | ... | 20.4 | 0 | 0 | 0 | 0 | |||
| Interest Income (As % Of Revenues) | % | ... | 83.4 | 82.5 | 84.4 | 82.1 | 63.2 | ||||
| Fee Income (As % Of Revenues) | % | ... | 9.38 | 0 | 0 | 0 | 14.8 | ||||
| Other Income (As % Of Revenues) | % | ... | 7.27 | 17.5 | 15.6 | 17.9 | 22.0 | ||||
| Cost Per Employee | USD per month | ... | ... | ... | ... | 603 | 499 | 491 | 542 | ||
| Cost Per Employee (Local Currency) | IDR per month | ... | ... | ... | ... | 6,283,070 | 6,128,550 | 6,425,550 | 7,382,550 | ||
| Staff Cost (As % Of Total Cost) | % | ... | ... | ... | ... | 56.7 | 56.4 | 57.5 | 61.3 | ||
| Equity (As % Of Assets) | % | 50.5 | 45.5 | 49.0 | 54.1 | 56.3 | |||||
| Loans (As % Assets) | % | 93.2 | 95.9 | 96.9 | 96.4 | 91.6 | |||||
| NPLs (As % Of Loans) | % | ... | ... | ... | ... | ... | ... | 1.89 | 1.98 | ||
| Provisions (As % Of NPLs) | % | ... | ... | ... | ... | ... | ... | 76.5 | 118 | ||
| Provisions (As % Of Loans) | % | 0.519 | 0.646 | 0.764 | 1.47 | 1.98 | |||||
| Cost of Provisions (As % Of Loans) | % | ... | 1.23 | 1.18 | 0.811 | 2.78 | 3.73 |
| other data | Unit | 2009 | 2010 | 2011 | 2012 | 2013 | 2014 | 2015 | 2016 | 2017 | 2018 |
| other data | |||||||||||
| Employees | 910 | 1,008 | 1,115 | 1,306 | 1,374 |
Get all company financials in excel:

By Helgi Library - September 26, 2019
Clipan Finance Indonesia stock traded at RUB 314 per share at the end of 2018 implying a market capitalization of USD 92.4 mil. Since the end of 2013, the stock has depreciated by -18.4 % implying an annual average growth of -4.00 %. In absolute terms, the value of th...

Clipan Finance Indonesia has been growing its revenues and asset by 21.8% and 18.6% a year on average in the last 3 years. Its loans and deposits have grown by 14.1% and % a year during that time and loans to deposits ratio reached at the end of 2018. The company achieved an average return on equity of 6.29% in the last three years with net profit growing 2.14% a year on average. In terms of operating efficiency, its cost to income ratio reached 35.4% in 2018, compared to 32.3% average in the last three years.
Equity represented 39.2% of total assets or 45.6% of loans at the end of 2018. Clipan Finance Indonesia's non-performing loans were 1.28% of total loans while provisions covered some 155% of NPLs at the end of 2018.
Clipan Finance Indonesia stock traded at RUB 314 per share at the end of 2018 resulting in a market capitalization of USD 92.4 mil. Over the previous five years, stock price fell by 18.4% or 4% a year on average. That’s compared to an average ROE of 8.09% the bank generated for its shareholders. This closing price put stock at a 12-month trailing price to earnings (PE) of 4.10x and price to book value (PBV) of 0.288x in 2018.
 Helgi Library