By Helgi Library - October 24, 2019
Adira Dinamika Multi Finance made a net profit of IDR 487 bil under revenues of IDR 2,227 bil in the second quarter of 2019, up 13% a...
By Helgi Library - October 24, 2019
Adira Dinamika Multi Finance stock traded at RUB 9,850 per share at the end second quarter of 2019 implying a market capitalization of USD 69...
By Helgi Library - October 24, 2019
Adira Dinamika Multi Finance's net interest margin amounted to 21.5% in the second quarter of 2019, down from 22.1% when compare...
| Profit Statement | 2016 | 2017 | 2018 | |
| Net Interest Income | IDR bil | 4,578 | 7,341 | 6,722 |
| Net Fee Income | IDR bil | 0 | 0 | 0 |
| Other Income | IDR bil | 6,476 | 7,341 | 8,446 |
| Total Revenues | IDR bil | 6,476 | 7,341 | 8,446 |
| Staff Cost | IDR bil | 1,732 | 1,893 | 2,031 |
| Operating Profit | IDR bil | 3,370 | 3,783 | 4,248 |
| Provisions | IDR bil | 1,652 | 1,661 | 1,764 |
| Net Profit | IDR bil | 1,009 | 1,409 | 1,815 |
| Balance Sheet | 2016 | 2017 | 2018 | |
| Interbank Loans | IDR bil | 0 | 0.650 | 0.650 |
| Customer Loans | IDR bil | 15,947 | 17,319 | 23,501 |
| Total Assets | IDR bil | 27,643 | 29,493 | 31,496 |
| Shareholders' Equity | IDR bil | 4,977 | 5,745 | 7,028 |
| Interbank Borrowing | IDR bil | 0 | 0 | 0 |
| Customer Deposits | IDR bil | 0 | 0 | 0 |
| Issued Debt Securities | IDR bil | 20,053 | 20,573 | 21,200 |
| Ratios | 2016 | 2017 | 2018 | |
| ROE | % | 21.6 | 26.3 | 28.4 |
| ROA | % | 3.64 | 4.93 | 5.95 |
| Costs (As % Of Assets) | % | 11.2 | 12.5 | 13.8 |
| Costs (As % Of Income) | % | 48.0 | 48.5 | 49.7 |
| Capital Adequacy Ratio | % | 17.8 | 19.5 | 22.0 |
| Net Interest Margin | % | 16.5 | 25.7 | 22.0 |
| NPLs (As % Of Loans) | % | 20.7 | 23.2 | 20.2 |
| Provisions (As % Of NPLs) | % | 21.0 | 20.0 | 23.9 |
| Valuation | 2016 | 2017 | 2018 | |
| Price/Earnings (P/E) | 6.69 | 5.06 | 5.01 | |
| Price/Book Value (P/BV) | 1.36 | 1.24 | 1.29 | |
| Dividend Yield | % | 7.48 | 7.09 | 9.98 |
| Earnings Per Share (EPS) | IDR | 1,009 | 1,409 | 1,815 |
| Book Value Per Share | IDR | 4,977 | 5,745 | 7,028 |
| Dividend Per Share | IDR | 505 | 505 | 908 |
Get all company financials in excel:
| summary | Unit | 2009 | 2010 | 2011 | 2012 | 2013 | 2014 | 2015 | 2016 | 2017 | 2018 |
| income statement | |||||||||||
| Net Interest Income | IDR bil | ... | 3,015 | 3,492 | 3,730 | 3,881 | 4,578 | ||||
| Total Revenues | IDR bil | ... | 5,560 | 6,394 | 5,989 | 5,866 | 6,476 | ||||
| Operating Profit | IDR bil | ... | 2,653 | 3,568 | 2,870 | 2,679 | 3,370 | ||||
| Net Profit | IDR bil | ... | 1,419 | 1,707 | 792 | 665 | 1,009 | ||||
| balance sheet | |||||||||||
| Interbank Loans | IDR bil | 0 | 0 | 0 | 0 | 0 | |||||
| Customer Loans | IDR bil | 22,152 | 27,008 | 26,073 | 23,390 | 15,947 | |||||
| Debt Securities | IDR bil | 0 | 0 | 0 | 0 | 0 | |||||
| Total Assets | IDR bil | 25,461 | 30,994 | 29,931 | 27,744 | 27,643 | |||||
| Shareholders' Equity | IDR bil | 5,036 | 6,022 | 4,034 | 4,361 | 4,977 | |||||
| Interbank Borrowing | IDR bil | 2,905 | 3,261 | 4,050 | 3,455 | 0 | |||||
| Customer Deposits | IDR bil | 0 | 0 | 0 | 0 | 0 | |||||
| Issued Debt Securities | IDR bil | 15,183 | 18,975 | 19,129 | 17,022 | 20,053 | |||||
| ratios | |||||||||||
| ROE | % | ... | 30.0 | 30.9 | 15.8 | 15.8 | 21.6 | ||||
| ROA | % | ... | 6.70 | 6.05 | 2.60 | 2.31 | 3.64 | ||||
| Costs (As % Of Assets) | % | ... | 13.7 | 10.0 | 10.2 | 11.1 | 11.2 | ||||
| Costs (As % Of Income) | % | ... | 52.3 | 44.2 | 52.1 | 54.3 | 48.0 | ||||
| Capital Adequacy Ratio | % | 19.6 | 19.3 | 13.3 | 15.5 | 17.8 | |||||
| Net Interest Margin | % | ... | 14.2 | 12.4 | 12.2 | 13.5 | 16.5 | ||||
| Interest Income (As % Of Revenues) | % | ... | 54.2 | 54.6 | 62.3 | 66.2 | 70.7 | ||||
| Fee Income (As % Of Revenues) | % | ... | 44.9 | 0 | 0 | 0 | 0 | ||||
| Staff Cost (As % Of Total Cost) | % | ... | ... | ... | ... | ... | 60.5 | 49.7 | 55.8 | ||
| Equity (As % Of Assets) | % | 19.8 | 19.4 | 13.5 | 15.7 | 18.0 | |||||
| Loans (As % Assets) | % | 87.0 | 87.1 | 87.1 | 84.3 | 57.7 | |||||
| NPLs (As % Of Loans) | % | ... | ... | ... | ... | ... | ... | ... | 20.7 | ||
| Provisions (As % Of NPLs) | % | ... | ... | ... | ... | ... | ... | ... | 21.0 | ||
| valuation | |||||||||||
| Market Capitalisation (End Of Period) | USD mil | ... | ... | ... | ... | ... | 581 | 252 | 502 | ||
| Number Of Shares (Average) | mil | ... | ... | ... | 1,000 | 1,000 | 1,000 | 1,000 | 1,000 | ||
| Share Price (End Of Period) | RUB | ... | ... | ... | ... | ... | 7,200 | 3,470 | 6,750 | ||
| Earnings Per Share (EPS) | IDR | ... | ... | ... | 1,419 | 1,707 | 792 | 665 | 1,009 | ||
| Book Value Per Share | IDR | ... | ... | ... | 5,036 | 6,022 | 4,034 | 4,361 | 4,977 | ||
| Dividend Per Share | IDR | ... | ... | ... | 709 | 2,700 | 396 | 333 | 505 | ||
| Price/Earnings (P/E) | ... | ... | ... | ... | ... | 9.09 | 5.22 | 6.69 | |||
| Price/Book Value (P/BV) | ... | ... | ... | ... | ... | 1.78 | 0.796 | 1.36 | |||
| Dividend Yield | % | ... | ... | ... | ... | ... | 5.50 | 9.58 | 7.48 | ||
| Earnings Per Share Growth | % | ... | ... | ... | ... | 20.3 | -53.6 | -16.1 | 51.8 | ||
| Book Value Per Share Growth | % | ... | ... | 21.8 | 19.6 | -33.0 | 8.11 | 14.1 |
| income statement | Unit | 2009 | 2010 | 2011 | 2012 | 2013 | 2014 | 2015 | 2016 | 2017 | 2018 |
| income statement | |||||||||||
| Interest Income | IDR bil | ... | 4,208 | 5,163 | 5,992 | 6,079 | 6,515 | ||||
| Interest Cost | IDR bil | ... | 1,193 | 1,671 | 2,262 | 2,198 | 1,937 | ||||
| Net Interest Income | IDR bil | ... | 3,015 | 3,492 | 3,730 | 3,881 | 4,578 | ||||
| Net Fee Income | IDR bil | ... | 2,496 | 0 | 0 | 0 | 0 | ||||
| Other Income | IDR bil | ... | 3,063 | 6,394 | 5,989 | 5,866 | 6,476 | ||||
| Total Revenues | IDR bil | ... | 5,560 | 6,394 | 5,989 | 5,866 | 6,476 | ||||
| Staff Cost | IDR bil | ... | ... | ... | ... | ... | 1,887 | 1,585 | 1,732 | ||
| Depreciation | IDR bil | ... | ... | ... | ... | ... | ... | ... | 75.1 | ||
| Other Cost | IDR bil | ... | ... | ... | ... | ... | ... | ... | 1,299 | ||
| Operating Cost | IDR bil | ... | 2,907 | 2,826 | 3,120 | 3,187 | 3,106 | ||||
| Operating Profit | IDR bil | ... | 2,653 | 3,568 | 2,870 | 2,679 | 3,370 | ||||
| Provisions | IDR bil | ... | 750 | 1,278 | 1,809 | 1,778 | 1,652 | ||||
| Extra and Other Cost | IDR bil | ... | 7.26 | 7.55 | 0 | 0 | 0 | ||||
| Pre-Tax Profit | IDR bil | ... | 1,896 | 2,282 | 1,061 | 901 | 1,718 | ||||
| Tax | IDR bil | ... | 477 | 575 | 268 | 236 | 708 | ||||
| Minorities | IDR bil | ... | 0 | 0 | 0 | 0 | 0 | ||||
| Net Profit | IDR bil | ... | 1,419 | 1,707 | 792 | 665 | 1,009 | ||||
| Dividends | IDR bil | ... | 709 | 2,700 | 396 | 333 | 505 | ||||
| growth rates | |||||||||||
| Net Interest Income Growth | % | ... | ... | 21.8 | 15.8 | 6.80 | 4.05 | 18.0 | |||
| Net Fee Income Growth | % | ... | ... | 11.5 | -100 | ... | ... | ... | ... | ... | |
| Total Revenue Growth | % | ... | ... | 16.6 | 15.0 | -6.33 | -2.06 | 10.4 | |||
| Operating Cost Growth | % | ... | ... | 32.4 | -2.78 | 10.4 | 2.17 | -2.56 | |||
| Operating Profit Growth | % | ... | ... | 3.05 | 34.5 | -19.6 | -6.66 | 25.8 | |||
| Pre-Tax Profit Growth | % | ... | ... | -10.2 | 20.4 | -53.5 | -15.1 | 90.7 | |||
| Net Profit Growth | % | ... | ... | -10.4 | 20.3 | -53.6 | -16.1 | 51.8 |
| balance sheet | Unit | 2009 | 2010 | 2011 | 2012 | 2013 | 2014 | 2015 | 2016 | 2017 | 2018 |
| balance sheet | |||||||||||
| Cash | IDR bil | 2,249 | 1,264 | 582 | 1,060 | 941 | |||||
| Interbank Loans | IDR bil | 0 | 0 | 0 | 0 | 0 | |||||
| Customer Loans | IDR bil | 22,152 | 27,008 | 26,073 | 23,390 | 15,947 | |||||
| Debt Securities | IDR bil | 0 | 0 | 0 | 0 | 0 | |||||
| Fixed Assets | IDR bil | 331 | 331 | 358 | 317 | 305 | |||||
| Total Assets | IDR bil | 25,461 | 30,994 | 29,931 | 27,744 | 27,643 | |||||
| Shareholders' Equity | IDR bil | 5,036 | 6,022 | 4,034 | 4,361 | 4,977 | |||||
| Of Which Minority Interest | IDR bil | 0 | 0 | 0 | 0 | 0 | |||||
| Liabilities | IDR bil | 20,425 | 24,972 | 25,897 | 23,383 | 22,666 | |||||
| Interbank Borrowing | IDR bil | 2,905 | 3,261 | 4,050 | 3,455 | 0 | |||||
| Customer Deposits | IDR bil | 0 | 0 | 0 | 0 | 0 | |||||
| Issued Debt Securities | IDR bil | 15,183 | 18,975 | 19,129 | 17,022 | 20,053 | |||||
| Other Liabilities | IDR bil | 2,337 | 2,737 | 2,718 | 2,907 | 2,613 | |||||
| asset quality | |||||||||||
| Non-Performing Loans | IDR bil | ... | ... | ... | ... | ... | ... | ... | 3,458 | ||
| Gross Loans | IDR bil | 22,886 | 27,912 | 27,180 | 24,462 | 16,671 | |||||
| Total Provisions | IDR bil | 734 | 904 | 1,107 | 1,072 | 725 | |||||
| growth rates | |||||||||||
| Customer Loan Growth | % | ... | 67.3 | 21.9 | -3.46 | -10.3 | -31.8 | ||||
| Total Asset Growth | % | ... | 50.7 | 21.7 | -3.43 | -7.31 | -0.364 | ||||
| Shareholders' Equity Growth | % | ... | 13.9 | 19.6 | -33.0 | 8.11 | 14.1 |
| ratios | Unit | 2009 | 2010 | 2011 | 2012 | 2013 | 2014 | 2015 | 2016 | 2017 | 2018 |
| ratios | |||||||||||
| ROE | % | ... | 30.0 | 30.9 | 15.8 | 15.8 | 21.6 | ||||
| ROA | % | ... | 6.70 | 6.05 | 2.60 | 2.31 | 3.64 | ||||
| Costs (As % Of Assets) | % | ... | 13.7 | 10.0 | 10.2 | 11.1 | 11.2 | ||||
| Costs (As % Of Income) | % | ... | 52.3 | 44.2 | 52.1 | 54.3 | 48.0 | ||||
| Capital Adequacy Ratio | % | 19.6 | 19.3 | 13.3 | 15.5 | 17.8 | |||||
| Net Interest Margin | % | ... | 14.2 | 12.4 | 12.2 | 13.5 | 16.5 | ||||
| Interest Spread | % | ... | 12.6 | 10.9 | 10.8 | 12.2 | 15.1 | ||||
| Asset Yield | % | ... | 19.9 | 18.3 | 19.7 | 21.1 | 23.5 | ||||
| Cost Of Liabilities | % | ... | 7.25 | 7.36 | 8.89 | 8.92 | 8.41 | ||||
| Payout Ratio | % | ... | 50.0 | 158 | 50.0 | 50.0 | 50.0 | ||||
| Interest Income (As % Of Revenues) | % | ... | 54.2 | 54.6 | 62.3 | 66.2 | 70.7 | ||||
| Fee Income (As % Of Revenues) | % | ... | 44.9 | 0 | 0 | 0 | 0 | ||||
| Other Income (As % Of Revenues) | % | ... | 55.1 | 100 | 100 | 100 | 100 | ||||
| Cost Per Employee | USD per month | ... | ... | ... | ... | ... | 766 | 652 | 751 | ||
| Cost Per Employee (Local Currency) | RUB per month | ... | ... | ... | ... | ... | 9,411,510 | 8,530,600 | 10,221,400 | ||
| Staff Cost (As % Of Total Cost) | % | ... | ... | ... | ... | ... | 60.5 | 49.7 | 55.8 | ||
| Equity (As % Of Assets) | % | 19.8 | 19.4 | 13.5 | 15.7 | 18.0 | |||||
| Loans (As % Assets) | % | 87.0 | 87.1 | 87.1 | 84.3 | 57.7 | |||||
| NPLs (As % Of Loans) | % | ... | ... | ... | ... | ... | ... | ... | 20.7 | ||
| Provisions (As % Of NPLs) | % | ... | ... | ... | ... | ... | ... | ... | 21.0 | ||
| Provisions (As % Of Loans) | % | 3.31 | 3.35 | 4.24 | 4.58 | 4.54 | |||||
| Cost of Provisions (As % Of Loans) | % | ... | 4.24 | 5.20 | 6.82 | 7.19 | 8.40 |
Get all company financials in excel:
By Helgi Library - October 24, 2019
Adira Dinamika Multi Finance stock traded at RUB 9,850 per share at the end of second quarter of 2019 implying a market capitalization of USD 697 mil. Over the last five years, the stock has depreciated by 13.2 implying an annual average growth of -2.80% ...
By Helgi Library - October 24, 2019
Adira Dinamika Multi Finance generated total banking revenues of IDR 2,227 bil in the second quarter of 2019, up 7.52% when compared to the same period of last year and 0.125% when compared to the previous quarter. Historically, the bank’s revenues containing...
By Helgi Library - October 24, 2019
Adira Dinamika Multi Finance stock traded at RUB 9,850 per share at the end of second quarter of 2019 implying a market capitalization of USD 697 mil. Over the last five years, the stock has depreciated by -13.2 % implying an annual average growth of -2.80 %. In absol...
By Helgi Library - October 24, 2019
Adira Dinamika Multi Finance's Equity reached 22.8% of total assets in the 2Q2019, up from 19.5% for the previous year. As a share of net customer loans, the ratio amounted to 29.6% at the end of the second quarter of 2019. ...
By Helgi Library - September 26, 2019
Adira Dinamika Multi Finance made a net profit of IDR 1,815 bil under revenues of IDR 8,446 bil in 2018, up 28.8% and 15.1% respectively compared to the previous year. Historically, the bank’s net profit reached an all time high of IDR 1,815 bil in 2018 and an all time l...
By Helgi Library - September 26, 2019
Adira Dinamika Multi Finance stock traded at RUB 9,100 per share at the end 2018 implying a market capitalization of USD 672 mil. Since the end of 2013, the stock has appreciated by % implying an annual average growth of 0 %. In absolute terms, the value of the compa...
By Helgi Library - September 26, 2019
Adira Dinamika Multi Finance employed 13,397 persons in 2018, down 0.542% when compared to the previous year. Historically, the bank's workforce hit an all time high of 16,708 persons in 2014 and an all time low of 13,397 in 2018. Average cost reached USD 933 per ...
By Helgi Library - September 26, 2019
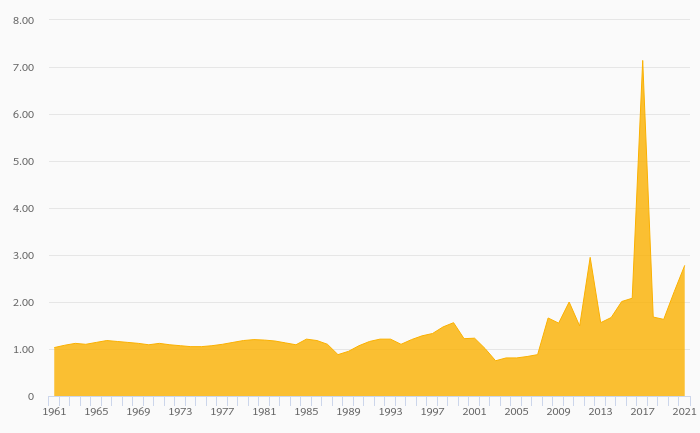
Adira Dinamika Multi Finance's net interest margin amounted to 22.0% in 2018, down from 25.7% compared to the previous year. Historically, the bank’s net interest margin reached an all time high of 33.3% in 2010 and an all time low of 12.2% in 2014. The...
By Helgi Library - September 26, 2019
Adira Dinamika Multi Finance generated total banking revenues of IDR 8,446 bil in 2018, up 15.1% compared to the previous year. Historically, the bank’s revenues containing of interest, fee and other non-interest income reached an all time high of IDR 8,446 bil...
By Helgi Library - September 26, 2019
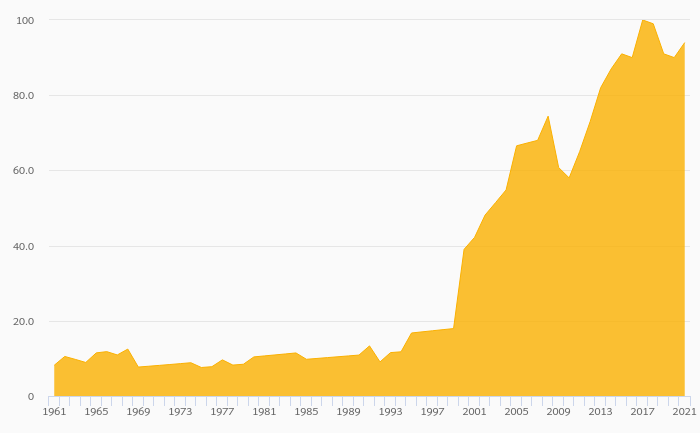
Adira Dinamika Multi Finance's cost to income ratio reached 49.7% in 2018, up from 48.5% compared to the previous year. Historically, the bank’s costs reached an all time high of 54.3% of income in 2015 and an all time low of 48.0% in 2016. When compared t...

Adira Dinamika Multi Finance has been growing its revenues and asset by 12.9% and 4.32% a year on average in the last 3 years. Its loans and deposits have grown by 0.159% and % a year during that time and loans to deposits ratio reached at the end of 2018. The company achieved an average return on equity of 25.4% in the last three years with net profit growing 39.8% a year on average. In terms of operating efficiency, its cost to income ratio reached 49.7% in 2018, compared to 48.7% average in the last three years.
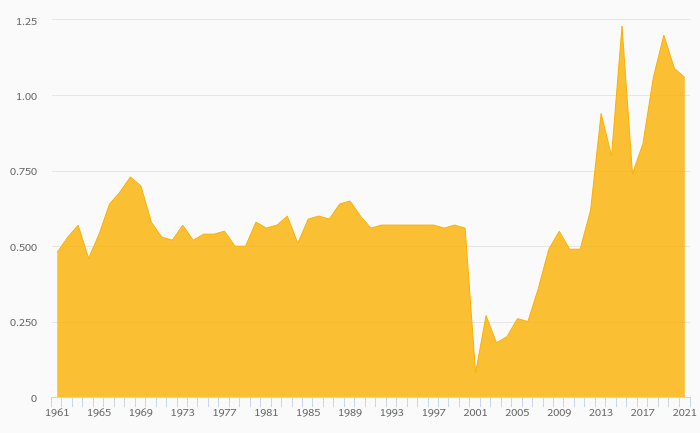
Equity represented 22.3% of total assets or 29.9% of loans at the end of 2018. Adira Dinamika Multi Finance's non-performing loans were 20.2% of total loans while provisions covered some 23.9% of NPLs at the end of 2018.
Adira Dinamika Multi Finance stock traded at RUB 9,100 per share at the end of 2018 resulting in a market capitalization of USD 672 mil. Over the previous five years, stock price rose by 0% or 0% a year on average. That’s compared to an average ROE of 21.6% the bank generated for its shareholders. This closing price put stock at a 12-month trailing price to earnings (PE) of 5.01x and price to book value (PBV) of 1.29x in 2018.
 Helgi Library