By Helgi Library - March 1, 2020
HDBank's non-performing loans reached 1.36% of total loans at the end of 2019-12-31, down from 1.53% compared to the previous yea...
By Helgi Library - March 1, 2020
HDBank made a net profit of VND 1,121 bil in the fourth quarter of 2019, up 43.8% when compared to the same period of last year. ...
By Helgi Library - March 1, 2020
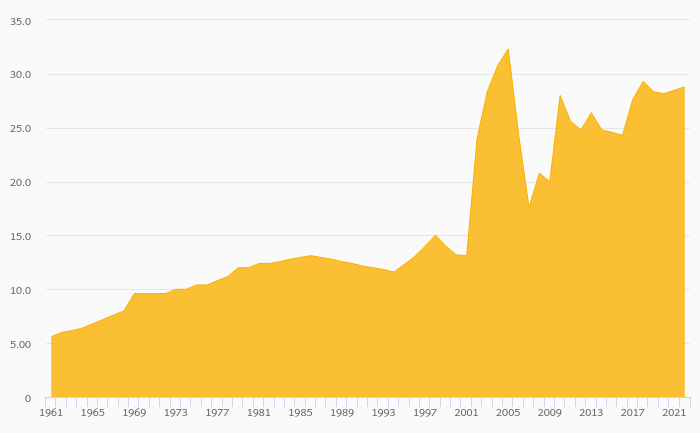
HDBank's net interest margin amounted to 5.17% in the fourth quarter of 2019, up from 4.69% when compared to the previous quarte...
| Profit Statement | 2017 | 2018 | 2019 | |
| Net Interest Income | VND bil | 6,419 | 7,755 | 9,774 |
| Net Fee Income | VND bil | 196 | 438 | 596 |
| Other Income | VND bil | 992 | 1,407 | 1,251 |
| Total Revenues | VND bil | 7,607 | 9,600 | 11,620 |
| Staff Cost | VND bil | 2,003 | 2,377 | 2,616 |
| Operating Profit | VND bil | 3,506 | 5,102 | 6,503 |
| Provisions | VND bil | 1,017 | 994 | 1,289 |
| Net Profit | VND bil | 1,746 | 2,842 | 3,605 |
| Balance Sheet | 2017 | 2018 | 2019 | |
| Interbank Loans | VND bil | 21,861 | 32,426 | 24,665 |
| Customer Loans | VND bil | 103,336 | 121,792 | 144,700 |
| Total Assets | VND bil | 189,334 | 216,057 | 229,477 |
| Shareholders' Equity | VND bil | 14,759 | 16,828 | 20,381 |
| Interbank Borrowing | VND bil | 40,192 | 49,981 | 55,423 |
| Customer Deposits | VND bil | 125,870 | 133,987 | 132,600 |
| Issued Debt Securities | VND bil | 4,569 | 10,666 | 12,240 |
| Ratios | 2017 | 2018 | 2019 | |
| ROE | % | 14.1 | 18.0 | 19.4 |
| ROA | % | 1.03 | 1.40 | 1.62 |
| Costs (As % Of Assets) | % | 2.42 | 2.22 | 2.30 |
| Costs (As % Of Income) | % | 53.9 | 46.9 | 44.0 |
| Capital Adequacy Ratio | % | 13.5 | ... | ... |
| Net Interest Margin | % | 3.78 | 3.83 | 4.39 |
| Loans (As % Of Deposits) | % | 82.1 | 90.9 | 109 |
| NPLs (As % Of Loans) | % | 1.52 | 1.53 | 1.36 |
| Provisions (As % Of NPLs) | % | 73.3 | 71.1 | 81.4 |
| Valuation | 2017 | 2018 | 2019 | |
| Price/Earnings (P/E) | 16.3 | 10.5 | 7.50 | |
| Price/Book Value (P/BV) | 1.93 | 1.77 | 1.32 | |
| Dividend Yield | % | 4.69 | 3.30 | ... |
| Earnings Per Share (EPS) | VND | 1,963 | 2,897 | 3,675 |
| Book Value Per Share | VND | 16,616 | 17,154 | 20,902 |
| Dividend Per Share | VND | 1,500 | 1,000 | ... |
Get all company financials in excel:
| summary | Unit | 2009 | 2010 | 2011 | 2012 | 2013 | 2014 | 2015 | 2016 | 2017 | 2018 | 2019 |
| income statement | ||||||||||||
| Net Interest Income | VND bil | 325 | 1,629 | 3,322 | 4,690 | 6,419 | ||||||
| Total Revenues | VND bil | 1,443 | 2,899 | 4,238 | 5,496 | 7,607 | ||||||
| Operating Profit | VND bil | 432 | 1,079 | 1,769 | 2,190 | 3,506 | ||||||
| Net Profit | VND bil | 218 | 477 | 513 | 738 | 1,746 | ||||||
| balance sheet | ||||||||||||
| Interbank Loans | VND bil | 11,341 | 16,835 | 11,994 | 18,580 | 21,861 | ||||||
| Customer Loans | VND bil | 43,333 | 41,509 | 55,853 | 81,304 | 103,336 | ||||||
| Debt Securities | VND bil | 14,219 | 25,638 | 22,603 | 35,136 | 50,920 | ||||||
| Total Assets | VND bil | 86,227 | 99,525 | 106,486 | 150,294 | 189,334 | ||||||
| Shareholders' Equity | VND bil | 8,587 | 8,874 | 9,842 | 9,943 | 14,759 | ||||||
| Interbank Borrowing | VND bil | 11,417 | 19,691 | 10,725 | 24,941 | 40,192 | ||||||
| Customer Deposits | VND bil | 62,384 | 65,412 | 76,560 | 108,467 | 125,870 | ||||||
| Issued Debt Securities | VND bil | 2,503 | 3,580 | 7,011 | 3,625 | 4,569 | ||||||
| ratios | ||||||||||||
| ROE | % | ... | 3.11 | 5.46 | 5.48 | 7.46 | 14.1 | |||||
| ROA | % | ... | 0.313 | 0.513 | 0.498 | 0.575 | 1.03 | |||||
| Costs (As % Of Assets) | % | ... | 1.45 | 1.96 | 2.40 | 2.57 | 2.42 | |||||
| Costs (As % Of Income) | % | 70.0 | 62.8 | 58.3 | 60.1 | 53.9 | ||||||
| Capital Adequacy Ratio | % | ... | ... | ... | ... | ... | ... | ... | ... | 13.5 | ... | ... |
| Net Interest Margin | % | ... | 0.468 | 1.75 | 3.23 | 3.65 | 3.78 | |||||
| Interest Income (As % Of Revenues) | % | 22.5 | 56.2 | 78.4 | 85.3 | 84.4 | ||||||
| Fee Income (As % Of Revenues) | % | 3.07 | 4.36 | 4.44 | 2.15 | 2.58 | ||||||
| Staff Cost (As % Of Total Cost) | % | 35.0 | 40.7 | 40.8 | 44.4 | 48.8 | ||||||
| Equity (As % Of Assets) | % | 9.96 | 8.92 | 9.24 | 6.62 | 7.80 | ||||||
| Loans (As % Of Deposits) | % | 69.5 | 63.5 | 73.0 | 75.0 | 82.1 | ||||||
| Loans (As % Assets) | % | 50.3 | 41.7 | 52.5 | 54.1 | 54.6 | ||||||
| NPLs (As % Of Loans) | % | 3.53 | 2.27 | 1.59 | 1.46 | 1.52 | ||||||
| Provisions (As % Of NPLs) | % | 46.5 | 50.8 | 78.7 | 76.8 | 73.3 | ||||||
| valuation | ||||||||||||
| Market Capitalisation (End Of Period) | USD mil | ... | ... | ... | ... | ... | 1,212 | 1,184 | 1,170 | 1,256 | ||
| Number Of Shares (Average) | mil | 502 | 810 | 810 | 810 | 888 | ||||||
| Share Price (End Of Period) | VND | ... | ... | ... | ... | ... | 32,000 | 32,000 | 32,000 | 32,000 | ||
| Earnings Per Share (EPS) | VND | 434 | 589 | 633 | 911 | 1,963 | ||||||
| Book Value Per Share | VND | 17,116 | 10,956 | 12,150 | 12,275 | 16,616 | ||||||
| Dividend Per Share | VND | ... | ... | ... | ... | ... | ... | 1,000 | ... | 1,500 | ... | |
| Price/Earnings (P/E) | ... | ... | ... | ... | ... | 54.4 | 50.6 | 35.1 | 16.3 | |||
| Price/Book Value (P/BV) | ... | ... | ... | ... | ... | 2.92 | 2.63 | 2.61 | 1.93 | |||
| Dividend Yield | % | ... | ... | ... | ... | ... | ... | 3.13 | ... | 4.69 | ... | |
| Earnings Per Share Growth | % | ... | -46.7 | 35.7 | 7.52 | 43.9 | 115 | |||||
| Book Value Per Share Growth | % | ... | 27.3 | -36.0 | 10.9 | 1.03 | 35.4 |
| income statement | Unit | 2009 | 2010 | 2011 | 2012 | 2013 | 2014 | 2015 | 2016 | 2017 | 2018 | 2019 |
| income statement | ||||||||||||
| Interest Income | VND bil | 4,900 | 6,298 | 8,000 | 11,334 | 14,678 | ||||||
| Interest Cost | VND bil | 4,575 | 4,669 | 4,678 | 6,643 | 8,259 | ||||||
| Net Interest Income | VND bil | 325 | 1,629 | 3,322 | 4,690 | 6,419 | ||||||
| Net Fee Income | VND bil | 44.3 | 126 | 188 | 118 | 196 | ||||||
| Other Income | VND bil | 1,073 | 1,143 | 727 | 687 | 992 | ||||||
| Total Revenues | VND bil | 1,443 | 2,899 | 4,238 | 5,496 | 7,607 | ||||||
| Staff Cost | VND bil | 354 | 740 | 1,008 | 1,467 | 2,003 | ||||||
| Depreciation | VND bil | 63.9 | 116 | 79.5 | 94.0 | 85.2 | ... | |||||
| Other Cost | VND bil | 593 | 964 | 1,381 | 1,744 | 2,013 | ... | |||||
| Operating Cost | VND bil | 1,010 | 1,820 | 2,469 | 3,305 | 4,101 | ||||||
| Operating Profit | VND bil | 432 | 1,079 | 1,769 | 2,190 | 3,506 | ||||||
| Provisions | VND bil | 192 | 456 | 935 | 994 | 1,017 | ||||||
| Extra and Other Cost | VND bil | < -0.001 | < 0.001 | 46.0 | 49.1 | 72.2 | ||||||
| Pre-Tax Profit | VND bil | 240 | 622 | 788 | 1,148 | 2,417 | ||||||
| Tax | VND bil | 22.9 | 145 | 158 | 233 | 462 | ||||||
| Minorities | VND bil | 0 | 0 | 117 | 176 | 208 | ||||||
| Net Profit | VND bil | 218 | 477 | 513 | 738 | 1,746 | ||||||
| Dividends | VND bil | ... | ... | ... | ... | ... | ... | 810 | ... | 1,472 | ... | |
| growth rates | ||||||||||||
| Net Interest Income Growth | % | ... | -61.8 | 401 | 104 | 41.2 | 36.8 | |||||
| Net Fee Income Growth | % | ... | 152 | 185 | 48.9 | -37.2 | 66.2 | |||||
| Total Revenue Growth | % | ... | -5.23 | 101 | 46.2 | 29.7 | 38.4 | |||||
| Operating Cost Growth | % | ... | 26.9 | 80.1 | 35.6 | 33.9 | 24.1 | |||||
| Operating Profit Growth | % | ... | -40.4 | 150 | 64.0 | 23.8 | 60.1 | |||||
| Pre-Tax Profit Growth | % | ... | -43.7 | 159 | 26.7 | 45.6 | 111 | |||||
| Net Profit Growth | % | ... | -33.3 | 119 | 7.58 | 43.9 | 137 | |||||
| market share | ||||||||||||
| Market Share in Revenues | % | 0.816 | 1.57 | 2.04 | 2.30 | ... | ... | ... | ||||
| Market Share in Net Profit | % | 0.725 | 2.79 | 1.65 | 1.79 | ... | ... | ... |
| balance sheet | Unit | 2009 | 2010 | 2011 | 2012 | 2013 | 2014 | 2015 | 2016 | 2017 | 2018 | 2019 |
| balance sheet | ||||||||||||
| Cash | VND bil | 2,227 | 3,228 | 4,215 | 4,025 | 3,434 | ||||||
| Interbank Loans | VND bil | 11,341 | 16,835 | 11,994 | 18,580 | 21,861 | ||||||
| Customer Loans | VND bil | 43,333 | 41,509 | 55,853 | 81,304 | 103,336 | ||||||
| Retail Loans | VND bil | 24,985 | 18,907 | 27,588 | 36,729 | 47,385 | ... | |||||
| Corporate Loans | VND bil | 19,071 | 23,087 | 28,906 | 45,460 | 57,054 | ... | |||||
| Debt Securities | VND bil | 14,219 | 25,638 | 22,603 | 35,136 | 50,920 | ||||||
| Fixed Assets | VND bil | 590 | 27.4 | 760 | 1,328 | 1,509 | ||||||
| Intangible Assets | VND bil | ... | ... | ... | ... | ... | ... | 90.3 | 63.6 | 51.2 | ||
| Goodwill | VND bil | ... | ... | ... | ... | ... | ... | 45.1 | 39.4 | 33.6 | ||
| Total Assets | VND bil | 86,227 | 99,525 | 106,486 | 150,294 | 189,334 | ||||||
| Shareholders' Equity | VND bil | 8,587 | 8,874 | 9,842 | 9,943 | 14,759 | ||||||
| Of Which Minority Interest | VND bil | 0 | 325 | 449 | 626 | 684 | ||||||
| Liabilities | VND bil | 77,639 | 90,651 | 96,644 | 140,352 | 174,575 | ||||||
| Interbank Borrowing | VND bil | 11,417 | 19,691 | 10,725 | 24,941 | 40,192 | ||||||
| Customer Deposits | VND bil | 62,384 | 65,412 | 76,560 | 108,467 | 125,870 | ||||||
| Retail Deposits | VND bil | 44,008 | 39,709 | 47,543 | 66,607 | 76,906 | ... | |||||
| Corporate Deposits | VND bil | 18,376 | 25,703 | 29,017 | 41,860 | 48,964 | ... | |||||
| Sight Deposits | VND bil | 3,625 | 4,433 | 5,614 | 9,813 | 104,979 | ||||||
| Term Deposits | VND bil | 58,759 | 60,979 | 70,182 | 28,042 | 19,903 | ||||||
| Issued Debt Securities | VND bil | 2,503 | 3,580 | 7,011 | 3,625 | 4,569 | ||||||
| Other Liabilities | VND bil | 1,335 | 1,968 | 2,349 | 3,319 | 3,943 | ||||||
| asset quality | ||||||||||||
| Non-Performing Loans | VND bil | 1,553 | 954 | 897 | 1,199 | 1,583 | ||||||
| Gross Loans | VND bil | 44,056 | 41,994 | 56,559 | 82,224 | 104,497 | ||||||
| Total Provisions | VND bil | 723 | 485 | 706 | 920 | 1,161 | ||||||
| growth rates | ||||||||||||
| Customer Loan Growth | % | ... | 107 | -4.21 | 34.6 | 45.6 | 27.1 | |||||
| Retail Loan Growth | % | ... | 129 | -24.3 | 45.9 | 33.1 | 29.0 | ... | ||||
| Corporate Loan Growth | % | ... | 86.0 | 21.1 | 25.2 | 57.3 | 25.5 | ... | ||||
| Total Asset Growth | % | ... | 63.4 | 15.4 | 6.99 | 41.1 | 26.0 | |||||
| Shareholders' Equity Growth | % | ... | 59.2 | 3.34 | 10.9 | 1.03 | 48.4 | |||||
| Customer Deposit Growth | % | ... | 82.1 | 4.85 | 17.0 | 41.7 | 16.0 | |||||
| Retail Deposit Growth | % | ... | 74.1 | -9.77 | 19.7 | 40.1 | 15.5 | ... | ||||
| Corporate Deposit Growth | % | ... | 105 | 39.9 | 12.9 | 44.3 | 17.0 | ... | ||||
| market share | ||||||||||||
| Market Share in Customer Loans | % | 1.44 | 1.24 | 1.39 | 1.68 | 1.79 | ... | ... | ||||
| Market Share in Corporate Loans | % | ... | ... | ... | 0.633 | 0.691 | 0.719 | 0.940 | ... | ... | ... | |
| Market Share in Total Assets | % | 1.58 | 1.65 | 1.53 | 1.85 | 1.96 | ... | ... | ||||
| Market Share in Customer Deposits | % | 1.69 | 1.53 | 1.52 | 1.83 | 1.85 | ... | ... |
| ratios | Unit | 2009 | 2010 | 2011 | 2012 | 2013 | 2014 | 2015 | 2016 | 2017 | 2018 | 2019 |
| ratios | ||||||||||||
| ROE | % | ... | 3.11 | 5.46 | 5.48 | 7.46 | 14.1 | |||||
| ROA | % | ... | 0.313 | 0.513 | 0.498 | 0.575 | 1.03 | |||||
| Costs (As % Of Assets) | % | ... | 1.45 | 1.96 | 2.40 | 2.57 | 2.42 | |||||
| Costs (As % Of Income) | % | 70.0 | 62.8 | 58.3 | 60.1 | 53.9 | ||||||
| Capital Adequacy Ratio | % | ... | ... | ... | ... | ... | ... | ... | ... | 13.5 | ... | ... |
| Net Interest Margin | % | ... | 0.468 | 1.75 | 3.23 | 3.65 | 3.78 | |||||
| Interest Spread | % | ... | -0.268 | 1.23 | 2.77 | 3.22 | 3.40 | |||||
| Asset Yield | % | ... | 7.05 | 6.78 | 7.77 | 8.83 | 8.64 | |||||
| Cost Of Liabilities | % | ... | 7.32 | 5.55 | 5.00 | 5.61 | 5.25 | |||||
| Payout Ratio | % | ... | ... | ... | ... | ... | ... | 158 | ... | 84.3 | ... | |
| Interest Income (As % Of Revenues) | % | 22.5 | 56.2 | 78.4 | 85.3 | 84.4 | ||||||
| Fee Income (As % Of Revenues) | % | 3.07 | 4.36 | 4.44 | 2.15 | 2.58 | ||||||
| Other Income (As % Of Revenues) | % | 74.4 | 39.4 | 17.2 | 12.5 | 13.0 | ||||||
| Cost Per Employee | USD per month | 283 | 426 | 459 | 500 | 543 | ||||||
| Cost Per Employee (Local Currency) | VND per month | 5,954,820 | 9,054,060 | 9,925,060 | 11,013,100 | 12,161,000 | ||||||
| Staff Cost (As % Of Total Cost) | % | 35.0 | 40.7 | 40.8 | 44.4 | 48.8 | ||||||
| Equity (As % Of Assets) | % | 9.96 | 8.92 | 9.24 | 6.62 | 7.80 | ||||||
| Loans (As % Of Deposits) | % | 69.5 | 63.5 | 73.0 | 75.0 | 82.1 | ||||||
| Loans (As % Assets) | % | 50.3 | 41.7 | 52.5 | 54.1 | 54.6 | ||||||
| NPLs (As % Of Loans) | % | 3.53 | 2.27 | 1.59 | 1.46 | 1.52 | ||||||
| Provisions (As % Of NPLs) | % | 46.5 | 50.8 | 78.7 | 76.8 | 73.3 | ||||||
| Provisions (As % Of Loans) | % | 1.67 | 1.17 | 1.26 | 1.13 | 1.12 | ||||||
| Cost of Provisions (As % Of Loans) | % | ... | 0.597 | 1.08 | 1.92 | 1.45 | 1.10 |
| other data | Unit | 2009 | 2010 | 2011 | 2012 | 2013 | 2014 | 2015 | 2016 | 2017 | 2018 | 2019 |
| other data | ||||||||||||
| Branches | ... | ... | ... | ... | ... | ... | ... | 221 | 240 | ... | ||
| Employees | 4,953 | 6,815 | 8,464 | 11,102 | 13,728 | |||||||
| Clients | mil | ... | ... | ... | ... | 0.487 | 0.712 | 1.24 | 2.27 | ... | ... | ... |
| Sight (As % Of Customer Deposits) | % | 5.81 | 6.78 | 7.33 | 9.05 | 83.4 | ||||||
| Return on Loans | % | 0.677 | 1.12 | 1.05 | 1.08 | 1.89 | ||||||
| Operating Profit (As % of Loans) | % | ... | 1.34 | 2.54 | 3.63 | 3.19 | 3.80 | |||||
| Costs (As % Of Loans) | % | ... | 3.14 | 4.29 | 5.07 | 4.82 | 4.44 | |||||
| Equity (As % Of Loans) | % | 19.8 | 21.4 | 17.6 | 12.2 | 14.3 |
Get all company financials in excel:
By Helgi Library - March 1, 2020
HDBank stock traded at VND 27,550 per share at the end fourth quarter of 2019 implying a market capitalization of USD 1,159 mil. Since the end of 4Q2014, the stock has appreciated by % implying an annual average growth of 0 %. In absolute terms, the value of the comp...
By Helgi Library - March 1, 2020
HDBank generated total banking revenues of VND 3,413 bil in the fourth quarter of 2019, up 26.5% when compared to the same period of last year and 17.4% when compared to the previous quarter. Historically, the bank’s revenues containing of interest, fee a...
By Helgi Library - March 1, 2020
HDBank stock traded at VND 27,550 per share at the end of fourth quarter of 2019 implying a market capitalization of USD 1,159 mil. Over the last five years, the stock has appreciated by 0 implying an annual average growth of 0% In absolute terms, the val...
By Helgi Library - March 1, 2020
HDBank's Equity reached 8.88% of total assets in the 4Q2019, up from 7.79% for the previous year. As a share of net customer loans, the ratio amounted to 14.1% at the end of the fourth quarter of 2019. ...
By Helgi Library - March 1, 2020
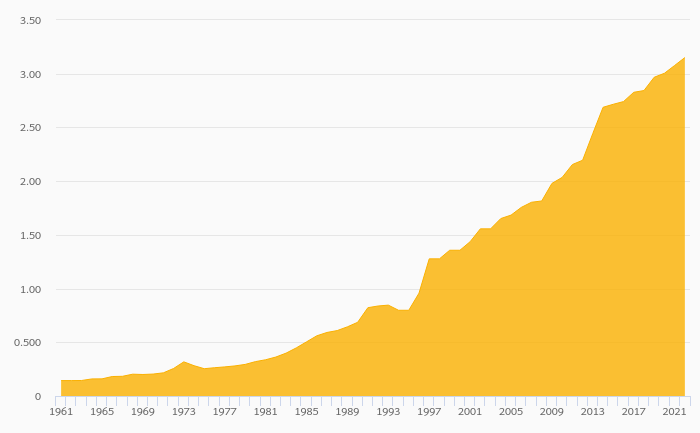
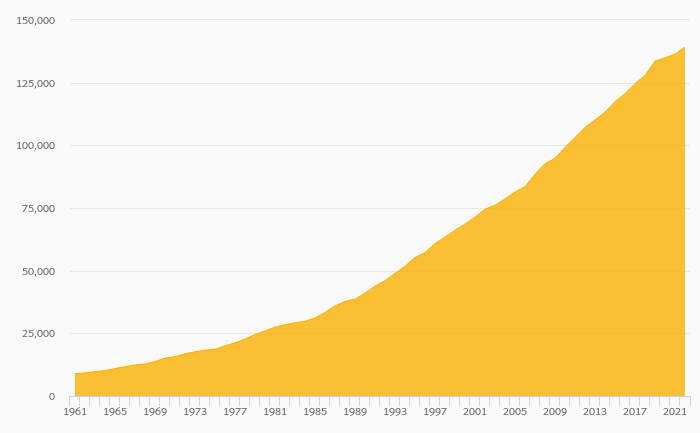
HDBank's customer loan growth reached 18.8% in 2019-12-31, up from 17.9% compared to the previous year. Historically, the bank’s loans growth reached an all time high of 25.2% in 2018-09-30 and an all time low of 11.2% in 2019-03-31. In the last decade, t...
By Helgi Library - March 1, 2020
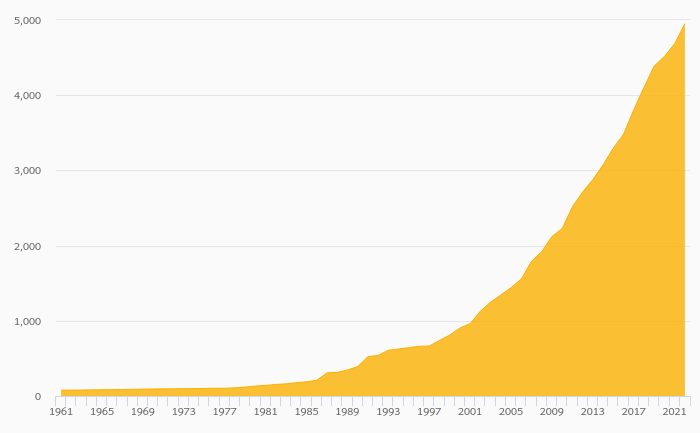
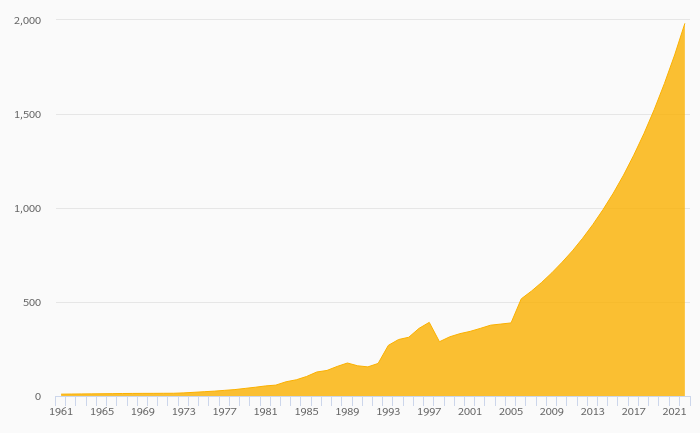
HDBank made a net profit of VND 3,605 bil under revenues of VND 11,620 bil in 2019, up 26.8% and 21.0% respectively compared to the previous year. Historically, the bank’s net profit reached an all time high of VND 3,605 bil in 2019 and an all time low of VND 194 bil...
By Helgi Library - March 1, 2020
HDBank stock traded at VND 27,550 per share at the end 2019 implying a market capitalization of USD 1,159 mil. Since the end of 2014, the stock has depreciated by -13.9 % implying an annual average growth of -2.95 %. In absolute terms, the value of the company fe...
By Helgi Library - March 1, 2020
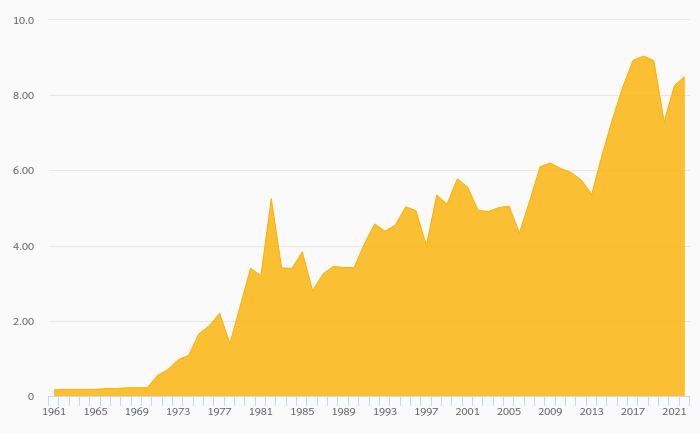
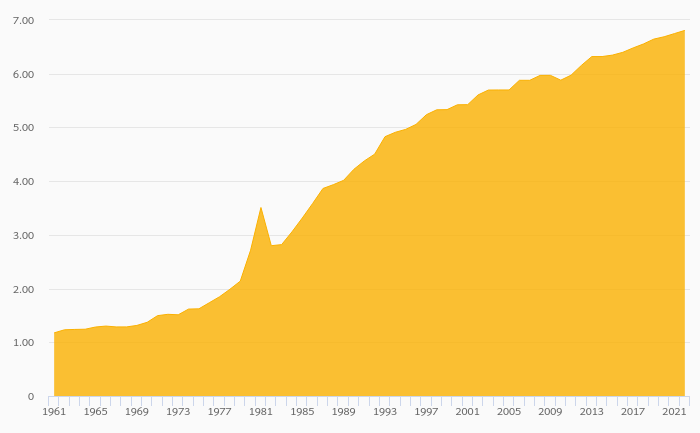
HDBank's net interest margin amounted to 4.39% in 2019, up from 3.83% compared to the previous year. Historically, the bank’s net interest margin reached an all time high of 4.39% in 2019 and an all time low of 0.468% in 2013. The average margin in the ...
By Helgi Library - March 1, 2020
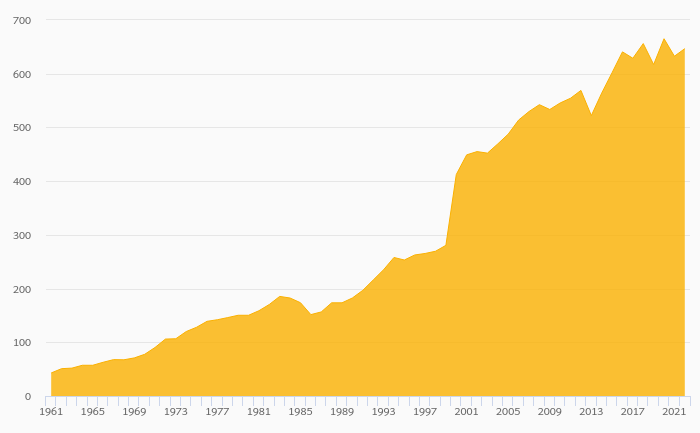
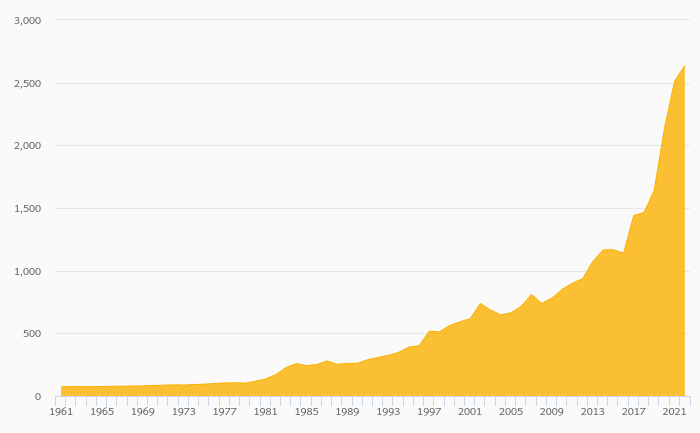
HDBank generated total banking revenues of VND 11,620 bil in 2019, up 21% compared to the previous year. Historically, the bank’s revenues containing of interest, fee and other non-interest income reached an all time high of VND 11,620 bil in 2019 and an all ti...
By Helgi Library - March 1, 2020
HDBank's non-performing loans reached 1.36% of total loans at the end of 2019, down from 1.53% compared to the previous year. Historically, the NPL ratio hit an all time high of 3.53% in 2013 and an all time low of 0.831% in 2010. Provision coverage amounte...

HDBank has been growing its revenues and asset by 37.2% and 28.2% a year on average in the last 10 years. Its loans and deposits have grown by 33.3% and 30.2% a year during that time and loans to deposits ratio reached 109% at the end of 2019. The company achieved an average return on equity of 10.8% in the last decade with net profit growing 33.9% a year on average. In terms of operating efficiency, its cost to income ratio reached 44.0% in 2019, compared to 54.4% average in the last decade.
Equity represented 8.88% of total assets or 14.1% of loans at the end of 2019. HDBank's non-performing loans were 1.36% of total loans while provisions covered some 81.4% of NPLs at the end of 2019.
HDBank stock traded at VND 27,550 per share at the end of 2019 resulting in a market capitalization of USD 1,159 mil. Over the previous five years, stock price fell by 13.9% or 2.95% a year on average. That’s compared to an average ROE of 12.9% the bank generated for its shareholders. This closing price put stock at a 12-month trailing price to earnings (PE) of 7.50x and price to book value (PBV) of 1.32x in 2019.
 Helgi Library