By Helgi Library - November 21, 2019
Klarna Group stock traded at NOK 45,142 per share at the end 2018 implying a market capitalization of USD 5,500 mil. Since the end of 2...
By Helgi Library - November 21, 2019
Klarna Group stock traded at NOK 45,142 per share at the end of 2018 implying a market capitalization of USD 5,500 mil. Since the end o...
By Helgi Library - July 4, 2019
Klarna Group's capital adequacy ratio reached 15.0% at the end of 2018, down from 18.2% compared to the previous year. Histor...
| Profit Statement |
| Balance Sheet |
| Ratios |
| Valuation |
Get all company financials in excel:
Get all company financials in excel:


By Helgi Library - July 4, 2019
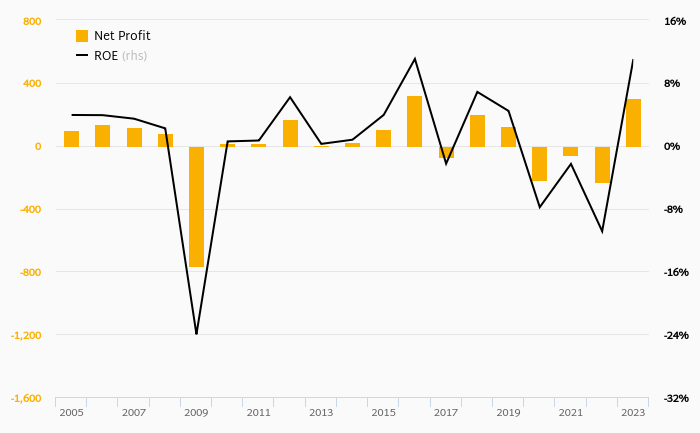
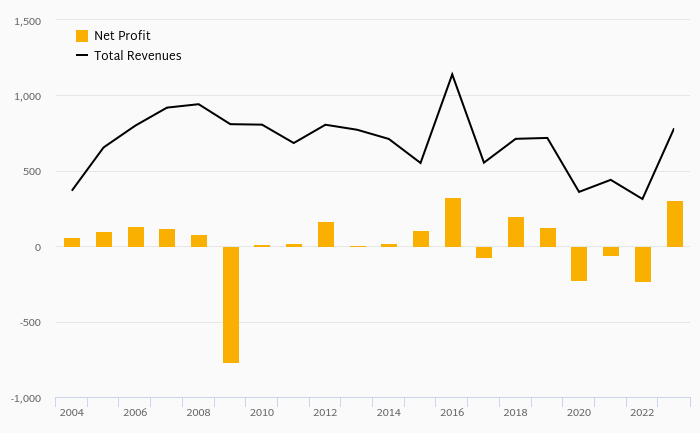
Klarna Group made a net profit of SEK 103 mil under revenues of SEK 5,450 mil in 2018, up -70.0% and 31.1% respectively compared to the previous year. Historically, the bank’s net profit reached an all time high of SEK 345 mil in 2017 and an all time low of SEK 24.0 ...
By Helgi Library - July 4, 2019
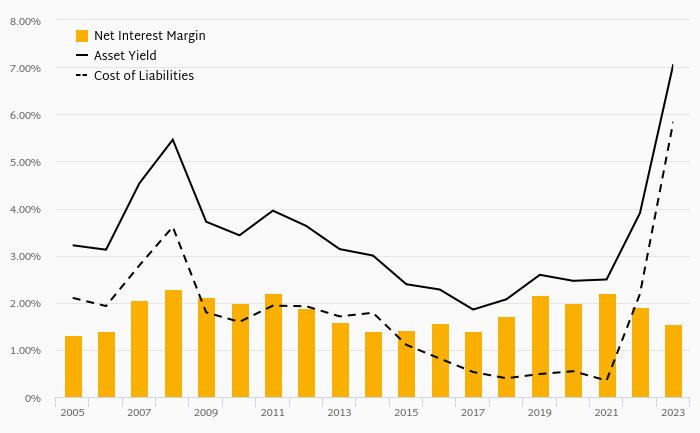
Klarna Group's net interest margin amounted to 7.63% in 2018, down from 9.34% compared to the previous year. Historically, the bank’s net interest margin reached an all time high of 14.0% in 2014 and an all time low of 7.63% in 2018. The average margin ...
By Helgi Library - July 4, 2019
Klarna Group generated total banking revenues of SEK 5,450 mil in 2018, up 31.1% compared to the previous year. Historically, the bank’s revenues containing of interest, fee and other non-interest income reached an all time high of SEK 5,450 mil in 2018 and an ...
By Helgi Library - July 4, 2019
Klarna Group's customer loan growth reached 44.0% in 2018, down from 64.2% compared to the previous year. Historically, the bank’s loans growth reached an all time high of 64.2% in 2017 and an all time low of 22.4% in 2013. In the last decade, the average...

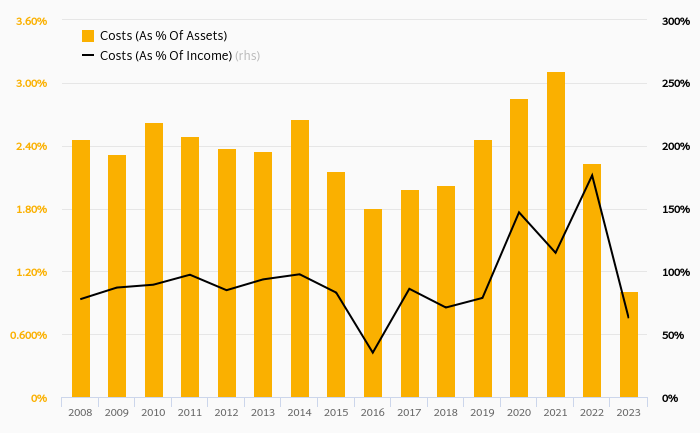
Klarna Group has been growing its revenues and asset by 28.3% and 47.7% a year on average in the last 3 years. Its loans and deposits have grown by 48.5% and 54.4% a year during that time and loans to deposits ratio reached 137% at the end of 2018. The company achieved an average return on equity of 5.45% in the last three years with net profit growing -6.69% a year on average. In terms of operating efficiency, its cost to income ratio reached 82.7% in 2018, compared to 80.0% average in the last three years.
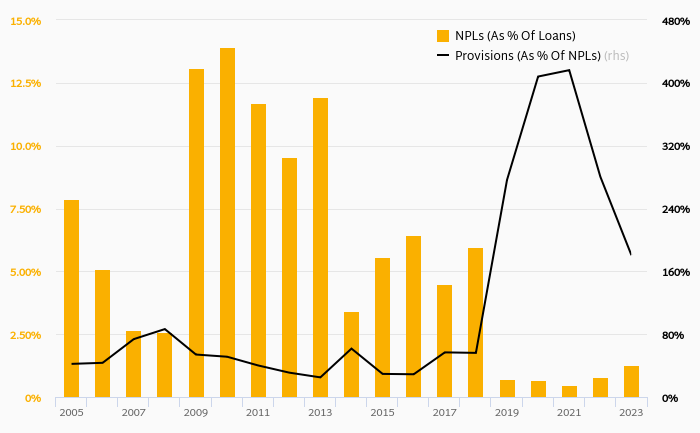
Equity represented 17.2% of total assets or 24.2% of loans at the end of 2018. Klarna Group's non-performing loans were 3.12% of total loans while provisions covered some 144% of NPLs at the end of 2018.
Klarna Group stock traded at NOK 45,142 per share at the end of 2018 resulting in a market capitalization of USD 5,500 mil. Over the previous five years, stock price rose by 603% or 47.7% a year on average. That’s compared to an average ROE of 5.44% the bank generated for its shareholders. This closing price put stock at a 12-month trailing price to earnings (PE) of 437x and price to book value (PBV) of 9.32x in 2018.
 Helgi Library