By Helgi Library - October 12, 2020
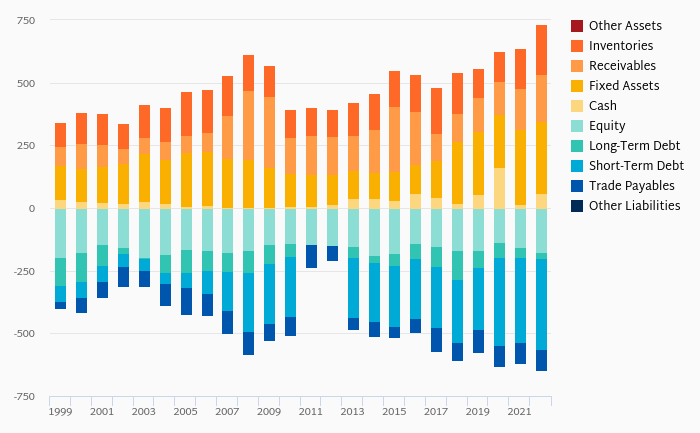
MOL's total assets reached HUF 3,914,790 mil at the end of 1Q2016, down 15% compared to the previous year. Current...
By Helgi Library - April 2, 2020
MOL's total assets reached HUF 3,928,000 mil at the end of 2015, down 15.5% compared to the previous year. Current...
| Profit Statement |
| Balance Sheet |
| Ratios |
| Valuation |
Get all company financials in excel:
Get all company financials in excel:


MOL (Magyar Olaj- es Gazipari Nyrt) is an integrated oil and gas group in Hungary. The company is present in the Europe, the Middle East and Africa region, as also in the CIS countries, with interests in exploration, production, refining, marketing and petrochemicals. The Company employed nearly 30,000 people and operated 1,748 filling stations internationally at the end of 2012 and is the market leader in Hungary and Slovakia. The Company's core activities include exploration and production of crude oil, natural gas and gas products; refining, transportation, storage and distribution of crude oil products at both retail and wholesale; transmission of natural gas; production and sales of olefins and polyolefins; production of electricity and thermal energy from gas and renewable resources. Hungarian State remains the single biggest shareholder holding a 27.3% stake.
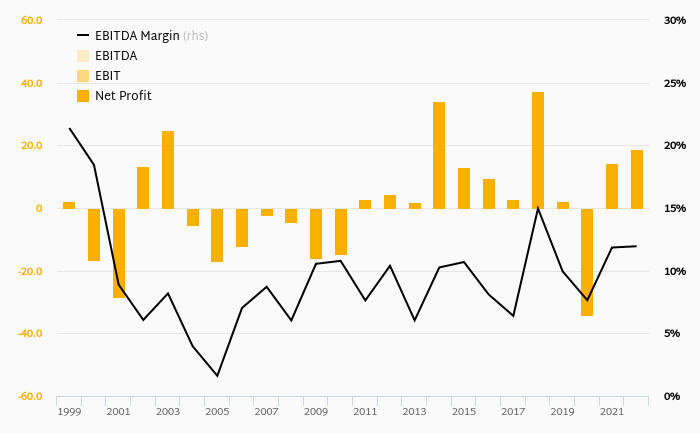
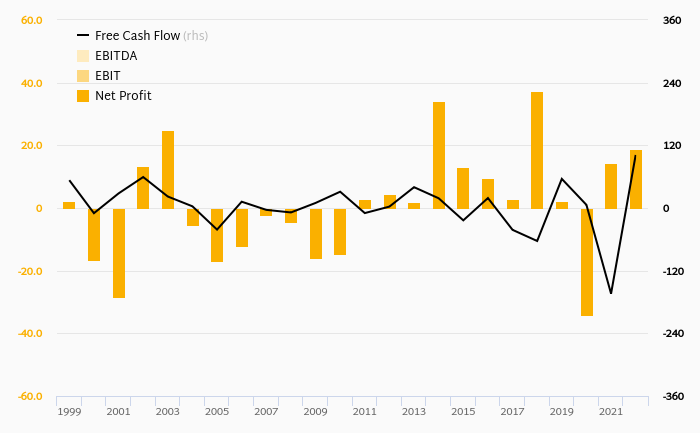
MOL has been growing its sales by a year on average in the last 5 years. EBITDA has grown on average by 5.08% a year during that time to total of HUF 647,466 mil in 2015, or 15.8% of sales. That’s compared to 10.9% average margin seen in last five years.
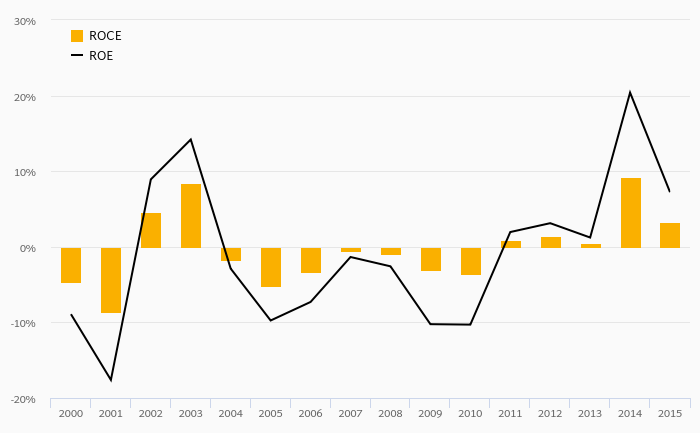
The company netted HUF -256,554 mil in 2015 implying ROE of -12.8% and ROCE of -8.11%. Again, the average figures were 0.490% and 0.257%, respectively when looking at the previous 5 years.
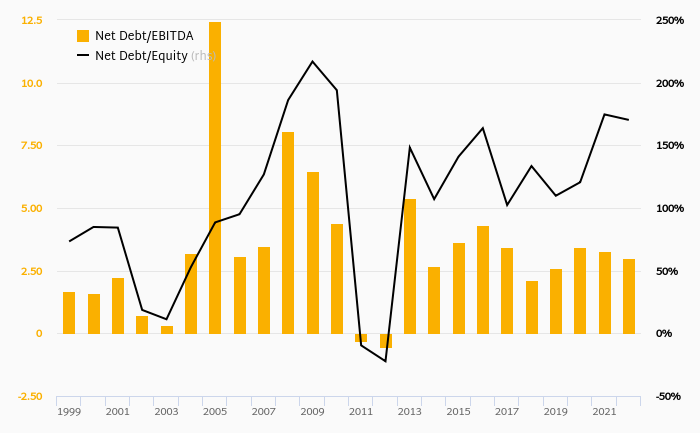
MOL’s net debt amounted to HUF 472,301 mil at the end of 2015, or 0.259 of equity. When compared to EBITDA, net debt was 0.729x, down when compared to average of 1.14x seen in the last 5 years.
MOL stock traded at HUF 14,255 per share at the end of 2015 resulting in a market capitalization of USD 4,566 mil. Over the previous five years, stock price fell by 31.4% or -7.27% a year on average. The closing price put stock at a 12-month trailing EV/EBITDA of 2.63x and price to earnings (PE) of -5.10x as of 2015.
 Helgi Library