By Helgi Library - April 2, 2020
Palfinger's total assets reached EUR 1,212 mil at the end of 2015, up 8.01% compared to the previous year. Current...
| Profit Statement | 2013 | 2014 | 2015 | |
| Sales | EUR mil | 981 | 1,063 | 1,230 |
| Gross Profit | EUR mil | 414 | 452 | 529 |
| EBITDA | EUR mil | 106 | 105 | 145 |
| EBIT | EUR mil | 74.1 | 66.1 | 104 |
| Financing Cost | EUR mil | 13.0 | 11.9 | 11.4 |
| Pre-Tax Profit | EUR mil | 61.1 | 54.2 | 93.0 |
| Net Profit | EUR mil | 44.0 | 38.2 | 64.4 |
| Dividends | EUR mil | 13.4 | 19.4 | 14.5 |
| Balance Sheet | 2013 | 2014 | 2015 | |
| Total Assets | EUR mil | 850 | 1,122 | 1,212 |
| Non-Current Assets | EUR mil | 429 | 669 | 709 |
| Current Assets | EUR mil | 420 | 454 | 503 |
| Working Capital | EUR mil | 237 | 246 | 247 |
| Shareholders' Equity | EUR mil | 386 | 455 | 511 |
| Liabilities | EUR mil | 464 | 668 | 702 |
| Total Debt | EUR mil | 236 | 412 | 406 |
| Net Debt | EUR mil | 220 | 392 | 384 |
| Ratios | 2013 | 2014 | 2015 | |
| ROE | % | 11.7 | 9.08 | 13.3 |
| ROCE | % | 6.15 | 4.83 | 6.88 |
| Gross Margin | % | 42.2 | 42.5 | 43.0 |
| EBITDA Margin | % | 10.8 | 9.84 | 11.8 |
| EBIT Margin | % | 7.56 | 6.21 | 8.49 |
| Net Margin | % | 4.49 | 3.59 | 5.23 |
| Net Debt/EBITDA | 2.08 | 3.74 | 2.64 | |
| Net Debt/Equity | 0.570 | 0.861 | 0.752 | |
| Cost of Financing | % | 5.36 | 3.68 | 2.79 |
| Valuation | 2013 | 2014 | 2015 | |
| Market Capitalisation | USD mil | 1,421 | 955 | 1,204 |
| Enterprise Value (EV) | USD mil | 1,724 | 1,429 | 1,668 |
| Number Of Shares | mil | 35.7 | 37.6 | 37.6 |
| Share Price | EUR | 28.9 | 21.0 | 26.5 |
| EV/EBITDA | 12.3 | 10.6 | 8.91 | |
| EV/Sales | 1.32 | 1.04 | 1.05 | |
| Price/Earnings (P/E) | 23.4 | 20.7 | 15.4 | |
| Price/Book Value (P/BV) | 2.67 | 1.74 | 1.95 | |
| Dividend Yield | % | 1.30 | 2.46 | 1.46 |
Get all company financials in excel:
| summary | Unit | 2000 | 2001 | 2002 | 2003 | 2004 | 2005 | 2006 | 2007 | 2008 | 2009 | 2010 | 2011 | 2012 | 2013 | 2014 | 2015 |
| income statement | |||||||||||||||||
| Sales | EUR mil | 505 | 652 | 846 | 935 | 981 | |||||||||||
| Gross Profit | EUR mil | ... | 243 | 315 | 387 | 437 | 414 | ||||||||||
| EBIT | EUR mil | -4.98 | 34.6 | 54.8 | 59.1 | 74.1 | |||||||||||
| Net Profit | EUR mil | -7.82 | 24.2 | 42.0 | 40.4 | 44.0 | |||||||||||
| ROE | % | -2.60 | 7.77 | 12.3 | 11.3 | 11.7 | |||||||||||
| EBIT Margin | % | -0.985 | 5.31 | 6.48 | 6.32 | 7.56 | |||||||||||
| Net Margin | % | -1.55 | 3.72 | 4.96 | 4.32 | 4.49 | |||||||||||
| Employees | ... | ... | ... | 4,517 | 4,671 | 5,600 | 6,175 | 6,490 | |||||||||
| balance sheet | |||||||||||||||||
| Total Assets | EUR mil | 588 | 677 | 740 | 814 | 850 | |||||||||||
| Non-Current Assets | EUR mil | 313 | 381 | 392 | 422 | 429 | |||||||||||
| Current Assets | EUR mil | 275 | 297 | 348 | 392 | 420 | |||||||||||
| Shareholders' Equity | EUR mil | 292 | 331 | 353 | 365 | 386 | |||||||||||
| Liabilities | EUR mil | 296 | 346 | 387 | 449 | 464 | |||||||||||
| Non-Current Liabilities | EUR mil | 163 | 184 | 161 | 269 | 253 | |||||||||||
| Current Liabilities | EUR mil | 132 | 162 | 226 | 180 | 211 | |||||||||||
| Net Debt/EBITDA | 9.31 | 2.85 | 2.09 | 2.55 | 2.08 | ||||||||||||
| Net Debt/Equity | 0.525 | 0.494 | 0.493 | 0.616 | 0.570 | ||||||||||||
| Cost of Financing | % | ... | 6.29 | 5.95 | 6.06 | 7.08 | 5.36 | ||||||||||
| cash flow | |||||||||||||||||
| Total Cash From Operations | EUR mil | ... | 50.0 | 49.1 | 37.7 | 55.4 | 62.5 | ||||||||||
| Total Cash From Investing | EUR mil | ... | -15.9 | -54.1 | -34.6 | -70.6 | -39.7 | ||||||||||
| Total Cash From Financing | EUR mil | ... | -10.2 | -12.2 | -3.79 | 24.5 | -30.4 | ||||||||||
| Net Change In Cash | EUR mil | ... | 24.0 | -17.2 | -0.728 | 9.34 | -7.56 | ||||||||||
| valuation | |||||||||||||||||
| Market Capitalisation | USD mil | 790 | 1,350 | 566 | 775 | 1,421 | |||||||||||
| Number Of Shares | mil | 35.4 | 35.4 | 35.4 | 35.7 | 35.7 | |||||||||||
| Share Price | EUR | 15.6 | 28.7 | 12.3 | 16.4 | 28.9 | |||||||||||
| Earnings Per Share (EPS) | EUR | -0.221 | 0.684 | 1.19 | 1.13 | 1.23 | |||||||||||
| Book Value Per Share | EUR | 8.26 | 9.36 | 9.97 | 10.2 | 10.8 | |||||||||||
| Dividend Per Share | EUR | 0 | 0.220 | 0.380 | 0.376 | 0.376 | |||||||||||
| Price/Earnings (P/E) | -70.5 | 42.0 | 10.4 | 14.5 | 23.4 | ||||||||||||
| Price/Book Value (P/BV) | 1.89 | 3.07 | 1.24 | 1.61 | 2.67 | ||||||||||||
| Dividend Yield | % | 0 | 0.765 | 3.08 | 2.29 | 1.30 | |||||||||||
| Earnings Per Share Growth | % | ... | -118 | -410 | 73.2 | -4.57 | 8.98 | ||||||||||
| Book Value Per Share Growth | % | ... | -5.76 | 13.3 | 6.47 | 2.47 | 5.77 |
| income statement | Unit | 2000 | 2001 | 2002 | 2003 | 2004 | 2005 | 2006 | 2007 | 2008 | 2009 | 2010 | 2011 | 2012 | 2013 | 2014 | 2015 |
| income statement | |||||||||||||||||
| Sales | EUR mil | 505 | 652 | 846 | 935 | 981 | |||||||||||
| Cost of Goods & Services | EUR mil | ... | 263 | 337 | 459 | 498 | 566 | ||||||||||
| Gross Profit | EUR mil | ... | 243 | 315 | 387 | 437 | 414 | ||||||||||
| Staff Cost | EUR mil | ... | 149 | 179 | 217 | 243 | 263 | ||||||||||
| Other Cost | EUR mil | ... | 77.1 | 78.4 | 86.6 | 106 | 45.7 | ||||||||||
| EBITDA | EUR mil | 16.5 | 57.4 | 83.4 | 88.2 | 106 | |||||||||||
| Depreciation | EUR mil | 21.5 | 22.7 | 28.6 | 29.0 | 31.7 | |||||||||||
| EBIT | EUR mil | -4.98 | 34.6 | 54.8 | 59.1 | 74.1 | |||||||||||
| Financing Cost | EUR mil | 11.4 | 10.9 | 11.2 | 15.5 | 13.0 | |||||||||||
| Extraordinary Cost | EUR mil | -4.56 | -6.11 | -13.4 | -10.1 | 0 | |||||||||||
| Pre-Tax Profit | EUR mil | -11.9 | 29.8 | 57.0 | 53.7 | 61.1 | |||||||||||
| Tax | EUR mil | -5.11 | 2.56 | 9.63 | 8.27 | 12.4 | |||||||||||
| Minorities | EUR mil | 1.07 | 3.05 | 5.41 | 5.05 | 4.70 | |||||||||||
| Net Profit | EUR mil | -7.82 | 24.2 | 42.0 | 40.4 | 44.0 | |||||||||||
| Dividends | EUR mil | 0 | 7.79 | 13.4 | 13.4 | 13.4 | |||||||||||
| growth rates | |||||||||||||||||
| Total Revenue Growth | % | ... | -36.4 | 29.0 | 29.7 | 10.6 | 4.86 | ||||||||||
| Operating Cost Growth | % | ... | ... | -18.9 | 13.7 | 18.0 | 14.9 | -11.5 | |||||||||
| EBITDA Growth | % | ... | -82.5 | 248 | 45.5 | 5.64 | 20.1 | ||||||||||
| EBIT Growth | % | ... | -108 | -795 | 58.3 | 7.91 | 25.3 | ||||||||||
| Pre-Tax Profit Growth | % | ... | -119 | -352 | 91.1 | -5.75 | 13.8 | ||||||||||
| Net Profit Growth | % | ... | -118 | -410 | 73.2 | -3.68 | 8.98 | ||||||||||
| ratios | |||||||||||||||||
| ROE | % | -2.60 | 7.77 | 12.3 | 11.3 | 11.7 | |||||||||||
| ROCE | % | ... | -1.36 | 4.26 | 6.42 | 5.47 | 6.15 | ||||||||||
| Gross Margin | % | ... | 48.0 | 48.3 | 45.8 | 46.7 | 42.2 | ||||||||||
| EBITDA Margin | % | 3.26 | 8.80 | 9.87 | 9.43 | 10.8 | |||||||||||
| EBIT Margin | % | -0.985 | 5.31 | 6.48 | 6.32 | 7.56 | |||||||||||
| Net Margin | % | -1.55 | 3.72 | 4.96 | 4.32 | 4.49 | |||||||||||
| Payout Ratio | % | 0 | 32.1 | 32.0 | 33.3 | 30.5 | |||||||||||
| Cost of Financing | % | ... | 6.29 | 5.95 | 6.06 | 7.08 | 5.36 | ||||||||||
| Net Debt/EBITDA | 9.31 | 2.85 | 2.09 | 2.55 | 2.08 |
| balance sheet | Unit | 2000 | 2001 | 2002 | 2003 | 2004 | 2005 | 2006 | 2007 | 2008 | 2009 | 2010 | 2011 | 2012 | 2013 | 2014 | 2015 |
| balance sheet | |||||||||||||||||
| Non-Current Assets | EUR mil | 313 | 381 | 392 | 422 | 429 | |||||||||||
| Property, Plant & Equipment | EUR mil | 192 | 200 | 197 | 209 | 218 | |||||||||||
| Intangible Assets | EUR mil | 74.0 | 128 | 150 | 165 | 174 | |||||||||||
| Current Assets | EUR mil | 275 | 297 | 348 | 392 | 420 | |||||||||||
| Inventories | EUR mil | 149 | 160 | 199 | 203 | 215 | |||||||||||
| Receivables | EUR mil | 80.2 | 111 | 121 | 141 | 164 | |||||||||||
| Cash & Cash Equivalents | EUR mil | 33.1 | 15.8 | 15.1 | 24.5 | 16.0 | |||||||||||
| Total Assets | EUR mil | 588 | 677 | 740 | 814 | 850 | |||||||||||
| Shareholders' Equity | EUR mil | 292 | 331 | 353 | 365 | 386 | |||||||||||
| Of Which Minority Interest | EUR mil | 3.89 | 14.0 | 6.17 | 6.47 | 11.2 | |||||||||||
| Liabilities | EUR mil | 296 | 346 | 387 | 449 | 464 | |||||||||||
| Non-Current Liabilities | EUR mil | 163 | 184 | 161 | 269 | 253 | |||||||||||
| Long-Term Debt | EUR mil | 127 | 124 | 86.3 | 205 | 185 | |||||||||||
| Deferred Tax Liabilities | EUR mil | ... | ... | ... | ... | ... | ... | ... | ... | ... | ... | ... | ... | ... | 7.65 | ||
| Current Liabilities | EUR mil | 132 | 162 | 226 | 180 | 211 | |||||||||||
| Short-Term Debt | EUR mil | 59.1 | 55.9 | 103 | 44.5 | 51.2 | |||||||||||
| Trade Payables | EUR mil | 0 | 55.9 | 0 | 0 | 142 | |||||||||||
| Provisions | EUR mil | ... | ... | ... | ... | ... | ... | ... | ... | ... | ... | ... | ... | ... | 12.4 | ||
| Equity And Liabilities | EUR mil | 588 | 677 | 740 | 814 | 850 | |||||||||||
| growth rates | |||||||||||||||||
| Total Asset Growth | % | ... | -7.89 | 15.2 | 9.20 | 9.97 | 4.42 | ||||||||||
| Shareholders' Equity Growth | % | ... | -5.67 | 13.4 | 6.46 | 3.43 | 5.77 | ||||||||||
| Net Debt Growth | % | ... | -8.76 | 6.69 | 6.30 | 29.2 | -2.15 | ||||||||||
| Total Debt Growth | % | ... | 5.21 | -3.75 | 5.35 | 31.8 | -5.35 | ||||||||||
| ratios | |||||||||||||||||
| Total Debt | EUR mil | 186 | 180 | 189 | 249 | 236 | |||||||||||
| Net Debt | EUR mil | 153 | 164 | 174 | 225 | 220 | |||||||||||
| Working Capital | EUR mil | 229 | 214 | 319 | 344 | 237 | |||||||||||
| Capital Employed | EUR mil | 542 | 595 | 711 | 766 | 666 | |||||||||||
| Net Debt/Equity | 0.525 | 0.494 | 0.493 | 0.616 | 0.570 | ||||||||||||
| Cost of Financing | % | ... | 6.29 | 5.95 | 6.06 | 7.08 | 5.36 |
| cash flow | Unit | 2000 | 2001 | 2002 | 2003 | 2004 | 2005 | 2006 | 2007 | 2008 | 2009 | 2010 | 2011 | 2012 | 2013 | 2014 | 2015 |
| cash flow | |||||||||||||||||
| Net Profit | EUR mil | -7.82 | 24.2 | 42.0 | 40.4 | 44.0 | |||||||||||
| Depreciation | EUR mil | 21.5 | 22.7 | 28.6 | 29.0 | 31.7 | |||||||||||
| Non-Cash Items | EUR mil | ... | -40.0 | -12.4 | 72.2 | 10.3 | -120 | ||||||||||
| Change in Working Capital | EUR mil | ... | 76.4 | 14.6 | -105 | -24.3 | 107 | ||||||||||
| Total Cash From Operations | EUR mil | ... | 50.0 | 49.1 | 37.7 | 55.4 | 62.5 | ||||||||||
| Capital Expenditures | EUR mil | ... | -14.3 | -18.9 | -24.4 | -40.3 | -38.5 | ||||||||||
| Other Investments | EUR mil | ... | -1.60 | -35.2 | -10.2 | -30.3 | -1.26 | ||||||||||
| Total Cash From Investing | EUR mil | ... | -15.9 | -54.1 | -34.6 | -70.6 | -39.7 | ||||||||||
| Dividends Paid | EUR mil | 0 | -7.79 | -13.4 | -13.4 | -13.4 | |||||||||||
| Issuance Of Debt | EUR mil | ... | 9.24 | -6.99 | 9.60 | 60.1 | -13.3 | ||||||||||
| Total Cash From Financing | EUR mil | ... | -10.2 | -12.2 | -3.79 | 24.5 | -30.4 | ||||||||||
| Net Change In Cash | EUR mil | ... | 24.0 | -17.2 | -0.728 | 9.34 | -7.56 | ||||||||||
| ratios | |||||||||||||||||
| Days Sales Outstanding | days | 57.9 | 61.9 | 52.2 | 55.1 | 61.0 | |||||||||||
| Days Sales Of Inventory | days | ... | 207 | 173 | 158 | 148 | 139 | ||||||||||
| Days Payable Outstanding | days | ... | 0 | 60.5 | 0 | 0 | 91.5 | ||||||||||
| Cash Conversion Cycle | days | ... | 265 | 174 | 210 | 203 | 108 | ||||||||||
| Cash Earnings | EUR mil | 13.6 | 47.0 | 70.6 | 69.4 | 75.8 | |||||||||||
| Cash Earnings Per Share | EUR | 0.386 | 1.33 | 1.99 | 1.94 | 2.12 | |||||||||||
| Price/Cash Earnings (P/CE) | 40.4 | 21.7 | 6.18 | 8.46 | 13.6 | ||||||||||||
| Free Cash Flow | EUR mil | ... | 34.2 | -4.97 | 3.06 | -15.2 | 22.8 | ||||||||||
| Free Cash Flow Yield | % | ... | 6.02 | -0.487 | 0.752 | -2.52 | 2.13 |
| other data | Unit | 2000 | 2001 | 2002 | 2003 | 2004 | 2005 | 2006 | 2007 | 2008 | 2009 | 2010 | 2011 | 2012 | 2013 | 2014 | 2015 |
| other data | |||||||||||||||||
| ROA | % | -1.28 | 3.83 | 5.92 | 5.20 | 5.30 | |||||||||||
| Gross Margin | % | ... | 48.0 | 48.3 | 45.8 | 46.7 | 42.2 | ||||||||||
| Employees | ... | ... | ... | 4,517 | 4,671 | 5,600 | 6,175 | 6,490 | |||||||||
| Cost Per Employee | USD per month | ... | ... | ... | 3,828 | 4,218 | 4,487 | 4,203 | 4,477 | ||||||||
| Cost Per Employee (Local Currency) | EUR per month | ... | ... | ... | 2,752 | 3,189 | 3,227 | 3,273 | 3,373 | ||||||||
| Staff Cost (As % Of Total Cost) | % | ... | 29.2 | 29.0 | 27.4 | 27.7 | 29.0 | ||||||||||
| Effective Tax Rate | % | 43.1 | 8.57 | 16.9 | 15.4 | 20.3 | |||||||||||
| Enterprise Value (EV) | USD mil | 1,010 | 1,567 | 791 | 1,072 | 1,724 | |||||||||||
| EV/EBITDA | 44.1 | 20.7 | 6.82 | 9.47 | 12.3 | ||||||||||||
| EV/Capital Employed | 1.30 | 1.98 | 0.858 | 1.06 | 1.88 | ||||||||||||
| EV/Sales | 1.44 | 1.82 | 0.673 | 0.893 | 1.32 | ||||||||||||
| EV/EBIT | -146 | 34.2 | 10.4 | 14.1 | 17.5 | ||||||||||||
| Capital Expenditures (As % of Sales) | % | ... | 2.82 | 2.90 | 2.89 | 4.31 | 3.92 | ||||||||||
| Sales in the EU | EUR mil | ... | ... | ... | ... | ... | ... | ... | ... | ... | 369 | 419 | 541 | 502 | 498 | ||
| Sales in the Rest Of Europe | EUR mil | ... | ... | ... | ... | ... | ... | ... | ... | ... | 18.0 | 27.0 | 59.0 | 85.0 | 42.0 | ||
| Sales in the North America | EUR mil | ... | ... | ... | ... | ... | ... | ... | ... | ... | 60.0 | 105 | 141 | 193 | 199 | ||
| Sales in the Central & South America | EUR mil | ... | ... | ... | ... | ... | ... | ... | ... | ... | 31.0 | 51.0 | 51.0 | 83.0 | 89.8 | ||
| Sales in the Far East | EUR mil | ... | ... | ... | ... | ... | ... | ... | ... | ... | 6.00 | 10.0 | 27.0 | 38.0 | 71.5 | ||
| Sales in Oceania | EUR mil | ... | ... | ... | ... | ... | ... | ... | ... | ... | 10.0 | 19.0 | 11.0 | 17.0 | ... | ... | ... |
| Sales in Africa | EUR mil | ... | ... | ... | ... | ... | ... | ... | ... | ... | 7.00 | 12.0 | 9.00 | 8.00 | ... | ... | ... |
| Sales in the Middle East & Near East | EUR mil | ... | ... | ... | ... | ... | ... | ... | ... | ... | 4.00 | 8.00 | 7.00 | 10.0 | ... | ... | ... |
| Sales from European Units | EUR mil | ... | ... | ... | ... | ... | ... | ... | ... | ... | 405 | 479 | 622 | 617 | 735 | ||
| Sales from Area Units | EUR mil | ... | ... | ... | ... | ... | ... | ... | ... | ... | 100 | 173 | 224 | 318 | 330 | ||
| EBITDA from European Units | EUR mil | ... | ... | ... | ... | ... | ... | ... | ... | ... | 26.0 | 67.0 | 103 | 97.0 | 108 | ||
| EBITDA from Area Units | EUR mil | ... | ... | ... | ... | ... | ... | ... | ... | ... | -5.00 | -2.00 | 5.00 | 17.0 | 18.2 | ||
| EBITDA from Ventures | EUR mil | ... | ... | ... | ... | ... | ... | ... | ... | ... | -4.00 | -8.00 | -10.0 | -15.0 | -20.3 | ||
| EBIT from European Units | EUR mil | ... | ... | ... | ... | ... | ... | ... | ... | ... | 9.00 | 50.0 | 80.0 | 74.0 | 83.5 | ||
| EBIT from Area Units | EUR mil | ... | ... | ... | ... | ... | ... | ... | ... | ... | -10.0 | -7.00 | -1.00 | 11.0 | 11.4 | ||
| EBIT from Ventures | EUR mil | ... | ... | ... | ... | ... | ... | ... | ... | ... | -4.00 | -8.00 | -10.0 | -15.0 | -20.3 | ||
| Employees - European Units | ... | ... | ... | ... | ... | ... | ... | ... | ... | 3,480 | 3,366 | 3,857 | 4,023 | ... | ... | ... | |
| Employees - Area Units | ... | ... | ... | ... | ... | ... | ... | ... | ... | 1,023 | 1,281 | 1,685 | 2,126 | ... | ... | ... | |
| Employees - Ventures | ... | ... | ... | ... | ... | ... | ... | ... | ... | 14.0 | 24.0 | 57.0 | 26.0 | ... | ... | ... |
Get all company financials in excel:


Palfinger AG is an Austria-based manufacturer of cranes, hydraulic lifting, loading and handling systems. Its core product is the truck-mounted knuckle boom crane, which is available in approximately 150 models. The Company's product portfolio includes telescopic cranes, timber and recycling cranes, container handling systems, transportable forklifts, tail lifts, high-tech railway applications and access platforms, as well as related services. The history of Palfinger dates back to 1932, with the founding of a reparation and metalworking shop for agricultural trailers, tippers and vehicle bodies by Richard Palfinger. In 1999, the Company went public, and in 2004 acquired German crane company BISON. As of 2012, Palfinger had 30 manufacturing and assembly sites, and around 4,500 outlets in over 130 countries. In 2012, the group started to implement production in China.
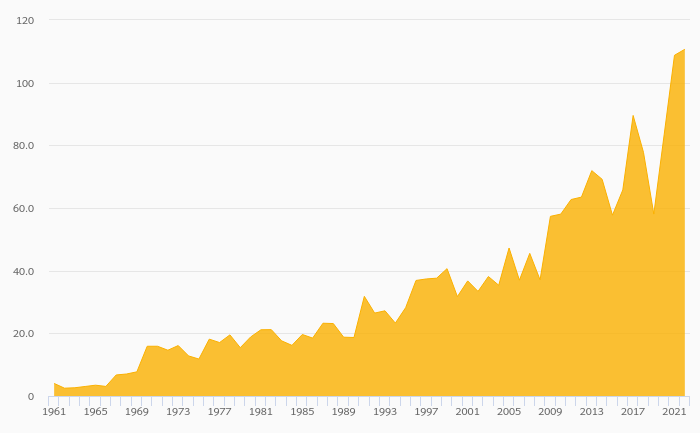
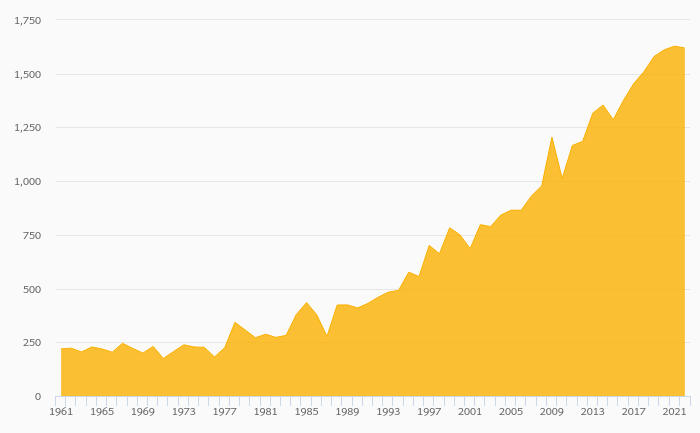
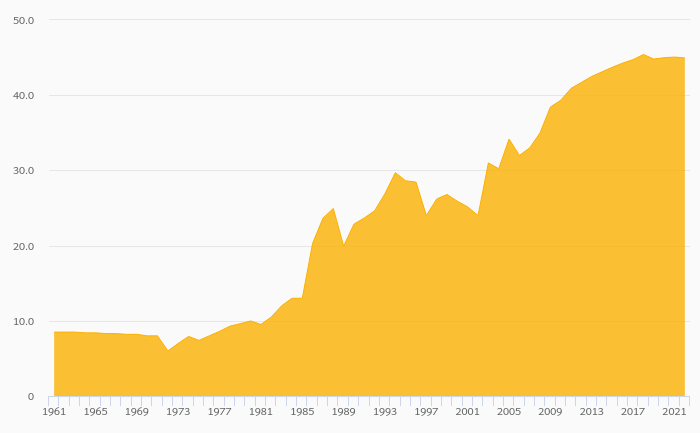
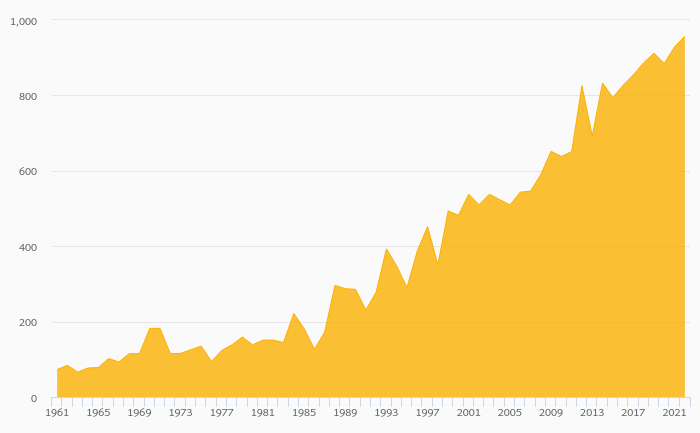
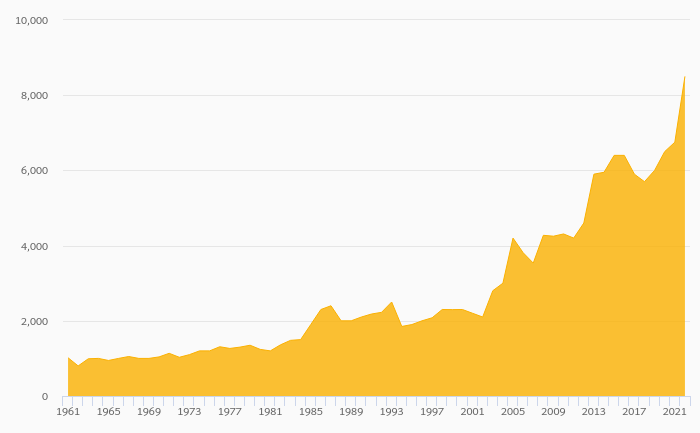
Palfinger has been growing its sales by a year on average in the last 5 years. EBITDA has grown on average by 20.4% a year during that time to total of EUR 145 mil in 2015, or 11.8% of sales. That’s compared to 10.3% average margin seen in last five years.
The company netted EUR 64.4 mil in 2015 implying ROE of 13.3% and ROCE of 6.88%. Again, the average figures were 11.5% and 5.95%, respectively when looking at the previous 5 years.
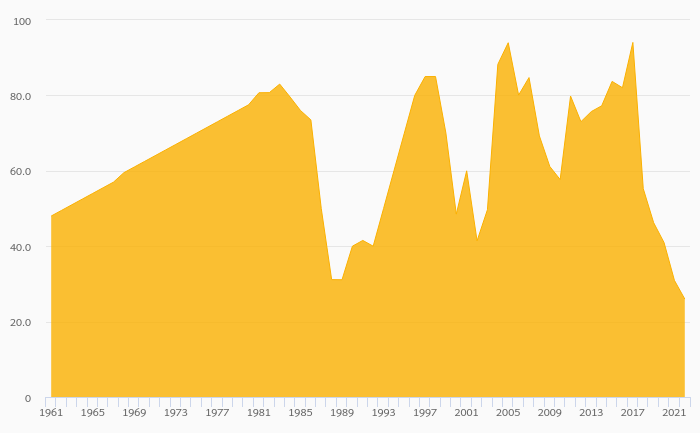
Palfinger’s net debt amounted to EUR 384 mil at the end of 2015, or 0.752 of equity. When compared to EBITDA, net debt was 2.64x, up when compared to average of 2.62x seen in the last 5 years.
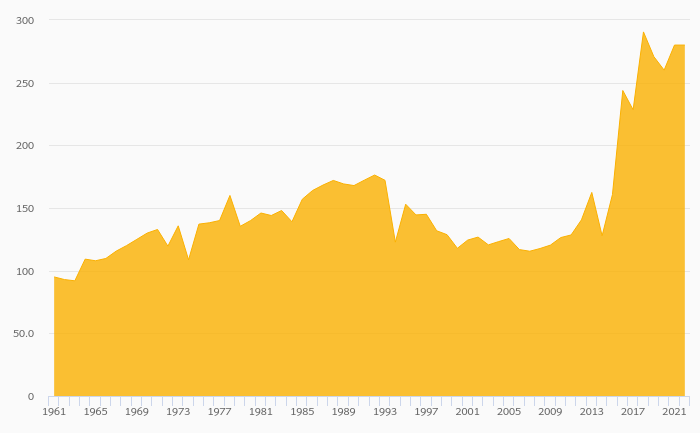
Palfinger stock traded at EUR 26.5 per share at the end of 2015 resulting in a market capitalization of USD 1,204 mil. Over the previous five years, stock price fell by 7.98% or -1.65% a year on average. The closing price put stock at a 12-month trailing EV/EBITDA of 8.91x and price to earnings (PE) of 15.4x as of 2015.
 Helgi Library