By Helgi Library - April 2, 2020
Rosenbauer International's total assets reached EUR 612 mil at the end of 2015, up 5.5% compared to the previous year. ...
By Helgi Library - April 2, 2020
Rosenbauer International's total assets reached EUR 612 mil at the end of 2015, up 5.5% compared to the previous year. ...
| Profit Statement | 2013 | 2014 | 2015 | |
| Sales | EUR mil | 738 | 814 | 865 |
| Gross Profit | EUR mil | 242 | 291 | 310 |
| EBITDA | EUR mil | 52.6 | 61.0 | 64.7 |
| EBIT | EUR mil | 42.3 | 48.4 | 50.6 |
| Financing Cost | EUR mil | 2.56 | 2.86 | 3.02 |
| Pre-Tax Profit | EUR mil | 41.7 | 47.3 | 48.2 |
| Net Profit | EUR mil | 26.3 | 27.3 | 22.4 |
| Dividends | EUR mil | 8.16 | 8.16 | 8.16 |
| Balance Sheet | 2013 | 2014 | 2015 | |
| Total Assets | EUR mil | 416 | 580 | 612 |
| Non-Current Assets | EUR mil | 101 | 147 | 159 |
| Current Assets | EUR mil | 314 | 433 | 453 |
| Working Capital | EUR mil | 215 | 261 | 315 |
| Shareholders' Equity | EUR mil | 188 | 198 | 227 |
| Liabilities | EUR mil | 228 | 382 | 385 |
| Total Debt | EUR mil | 62.8 | 181 | 210 |
| Net Debt | EUR mil | 49.0 | 154 | 192 |
| Ratios | 2013 | 2014 | 2015 | |
| ROE | % | 14.6 | 14.1 | 10.6 |
| ROCE | % | 8.40 | 7.54 | 5.09 |
| Gross Margin | % | 32.8 | 35.8 | 35.8 |
| EBITDA Margin | % | 7.12 | 7.50 | 7.47 |
| EBIT Margin | % | 5.74 | 5.94 | 5.85 |
| Net Margin | % | 3.57 | 3.35 | 2.59 |
| Net Debt/EBITDA | 0.932 | 2.53 | 2.97 | |
| Net Debt/Equity | 0.261 | 0.779 | 0.846 | |
| Cost of Financing | % | 3.01 | 2.34 | 1.54 |
| Valuation | 2013 | 2014 | 2015 | |
| Market Capitalisation | USD mil | 556 | 588 | 548 |
| Enterprise Value (EV) | USD mil | 623 | 775 | 780 |
| Number Of Shares | mil | 6.80 | 6.80 | 6.80 |
| Share Price | EUR | 59.3 | 71.5 | 66.6 |
| EV/EBITDA | 8.94 | 9.86 | 9.36 | |
| EV/Sales | 0.636 | 0.739 | 0.699 | |
| Price/Earnings (P/E) | 15.3 | 17.8 | 20.2 | |
| Price/Book Value (P/BV) | 2.15 | 2.45 | 2.00 | |
| Dividend Yield | % | 2.02 | 1.68 | 1.80 |
Get all company financials in excel:
| summary | Unit | 1999 | 2000 | 2001 | 2002 | 2003 | 2004 | 2005 | 2006 | 2007 | 2008 | 2009 | 2010 | 2011 | 2012 | 2013 | 2014 | 2015 |
| income statement | ||||||||||||||||||
| Sales | EUR mil | 542 | 596 | 542 | 645 | 738 | ||||||||||||
| Gross Profit | EUR mil | ... | ... | ... | ... | ... | ... | ... | ... | 171 | 201 | 197 | 192 | 242 | ||||
| EBIT | EUR mil | 29.2 | 48.3 | 41.6 | 39.7 | 42.3 | ||||||||||||
| Net Profit | EUR mil | 9.86 | 31.7 | 27.6 | 30.9 | 26.3 | ||||||||||||
| ROE | % | 10.3 | 27.6 | 20.1 | 19.5 | 14.6 | ||||||||||||
| EBIT Margin | % | 5.40 | 8.12 | 7.68 | 6.15 | 5.74 | ||||||||||||
| Net Margin | % | 1.82 | 5.32 | 5.09 | 4.79 | 3.57 | ||||||||||||
| Employees | ... | ... | ... | ... | ... | ... | ... | 1,946 | 2,046 | 2,123 | 2,432 | 2,551 | ||||||
| balance sheet | ||||||||||||||||||
| Total Assets | EUR mil | 307 | 302 | 357 | 431 | 416 | ||||||||||||
| Non-Current Assets | EUR mil | 62.8 | 67.7 | 71.7 | 84.4 | 101 | ||||||||||||
| Current Assets | EUR mil | 244 | 234 | 285 | 347 | 314 | ||||||||||||
| Shareholders' Equity | EUR mil | 99.8 | 129 | 145 | 172 | 188 | ||||||||||||
| Liabilities | EUR mil | 207 | 172 | 212 | 259 | 228 | ||||||||||||
| Non-Current Liabilities | EUR mil | 36.8 | 37.3 | 35.3 | 35.7 | 32.9 | ||||||||||||
| Current Liabilities | EUR mil | 170 | 135 | 177 | 224 | 195 | ||||||||||||
| Net Debt/EBITDA | 1.17 | 0.472 | 1.23 | 1.91 | 0.932 | |||||||||||||
| Net Debt/Equity | 0.420 | 0.203 | 0.420 | 0.545 | 0.261 | |||||||||||||
| Cost of Financing | % | ... | 11.3 | 9.17 | 7.12 | 4.18 | 3.01 | |||||||||||
| cash flow | ||||||||||||||||||
| Total Cash From Operations | EUR mil | ... | 17.5 | 34.8 | -12.8 | -3.67 | 82.2 | |||||||||||
| Total Cash From Investing | EUR mil | ... | -17.0 | -8.62 | -10.2 | -16.9 | -26.5 | |||||||||||
| Total Cash From Financing | EUR mil | ... | 5.18 | -22.6 | 23.9 | 22.7 | -55.1 | |||||||||||
| Net Change In Cash | EUR mil | ... | 5.73 | 3.61 | 0.917 | 2.15 | 0.510 | |||||||||||
| valuation | ||||||||||||||||||
| Market Capitalisation | USD mil | 283 | 338 | 320 | 413 | 556 | ||||||||||||
| Number Of Shares | mil | 6.80 | 6.80 | 6.80 | 6.80 | 6.80 | ||||||||||||
| Share Price | EUR | 29.0 | 37.5 | 36.3 | 46.1 | 59.3 | ||||||||||||
| Earnings Per Share (EPS) | EUR | 1.45 | 4.66 | 4.05 | 4.54 | 3.87 | ||||||||||||
| Book Value Per Share | EUR | 14.7 | 19.0 | 21.3 | 25.3 | 27.6 | ||||||||||||
| Dividend Per Share | EUR | 0.800 | 1.20 | 1.20 | 1.20 | 1.20 | ||||||||||||
| Price/Earnings (P/E) | 20.0 | 8.05 | 8.95 | 10.1 | 15.3 | |||||||||||||
| Price/Book Value (P/BV) | 1.98 | 1.97 | 1.70 | 1.82 | 2.15 | |||||||||||||
| Dividend Yield | % | 2.76 | 3.20 | 3.31 | 2.61 | 2.02 | ||||||||||||
| Earnings Per Share Growth | % | ... | -49.5 | 221 | -12.9 | 12.0 | -14.8 | |||||||||||
| Book Value Per Share Growth | % | ... | 8.50 | 29.5 | 12.2 | 18.5 | 9.22 |
| income statement | Unit | 1999 | 2000 | 2001 | 2002 | 2003 | 2004 | 2005 | 2006 | 2007 | 2008 | 2009 | 2010 | 2011 | 2012 | 2013 | 2014 | 2015 |
| income statement | ||||||||||||||||||
| Sales | EUR mil | 542 | 596 | 542 | 645 | 738 | ||||||||||||
| Cost of Goods & Services | EUR mil | ... | ... | ... | ... | ... | ... | ... | ... | 371 | 394 | 344 | 453 | 496 | ||||
| Gross Profit | EUR mil | ... | ... | ... | ... | ... | ... | ... | ... | 171 | 201 | 197 | 192 | 242 | ||||
| Staff Cost | EUR mil | ... | ... | ... | ... | ... | ... | ... | ... | 99.6 | 109 | 114 | 128 | 142 | ||||
| Other Cost | EUR mil | ... | ... | ... | ... | ... | ... | ... | ... | 35.3 | 36.5 | 34.0 | 15.2 | 47.0 | ||||
| EBITDA | EUR mil | 35.8 | 55.6 | 49.6 | 49.0 | 52.6 | ||||||||||||
| Depreciation | EUR mil | 6.54 | 7.27 | 7.97 | 9.34 | 10.2 | ||||||||||||
| EBIT | EUR mil | 29.2 | 48.3 | 41.6 | 39.7 | 42.3 | ||||||||||||
| Financing Cost | EUR mil | 4.60 | 3.93 | 3.89 | 3.76 | 2.56 | ||||||||||||
| Extraordinary Cost | EUR mil | -1.80 | -4.67 | -2.59 | -2.87 | -1.91 | ||||||||||||
| Pre-Tax Profit | EUR mil | 26.4 | 49.1 | 40.3 | 38.8 | 41.7 | ||||||||||||
| Tax | EUR mil | 8.86 | 9.10 | 8.15 | 6.82 | 10.9 | ||||||||||||
| Minorities | EUR mil | 7.71 | 8.32 | 4.58 | 1.08 | 4.43 | ||||||||||||
| Net Profit | EUR mil | 9.86 | 31.7 | 27.6 | 30.9 | 26.3 | ||||||||||||
| Dividends | EUR mil | 5.44 | 8.16 | 8.16 | 8.16 | 8.16 | ||||||||||||
| growth rates | ||||||||||||||||||
| Total Revenue Growth | % | ... | 8.29 | 9.94 | -9.08 | 19.1 | 14.4 | |||||||||||
| Operating Cost Growth | % | ... | ... | ... | ... | ... | ... | ... | ... | ... | -1.71 | 8.06 | 1.38 | -3.19 | 32.2 | |||
| EBITDA Growth | % | ... | -20.2 | 55.4 | -10.9 | -1.13 | 7.24 | |||||||||||
| EBIT Growth | % | ... | -25.8 | 65.3 | -14.0 | -4.64 | 6.76 | |||||||||||
| Pre-Tax Profit Growth | % | ... | -18.1 | 85.7 | -17.9 | -3.78 | 7.51 | |||||||||||
| Net Profit Growth | % | ... | -49.5 | 221 | -12.9 | 12.0 | -14.8 | |||||||||||
| ratios | ||||||||||||||||||
| ROE | % | 10.3 | 27.6 | 20.1 | 19.5 | 14.6 | ||||||||||||
| ROCE | % | ... | 5.39 | 15.5 | 12.3 | 11.1 | 8.40 | |||||||||||
| Gross Margin | % | ... | ... | ... | ... | ... | ... | ... | ... | 31.5 | 33.8 | 36.4 | 29.8 | 32.8 | ||||
| EBITDA Margin | % | 6.60 | 9.34 | 9.15 | 7.60 | 7.12 | ||||||||||||
| EBIT Margin | % | 5.40 | 8.12 | 7.68 | 6.15 | 5.74 | ||||||||||||
| Net Margin | % | 1.82 | 5.32 | 5.09 | 4.79 | 3.57 | ||||||||||||
| Payout Ratio | % | 55.1 | 25.8 | 29.6 | 26.4 | 31.0 | ||||||||||||
| Cost of Financing | % | ... | 11.3 | 9.17 | 7.12 | 4.18 | 3.01 | |||||||||||
| Net Debt/EBITDA | 1.17 | 0.472 | 1.23 | 1.91 | 0.932 |
| balance sheet | Unit | 1999 | 2000 | 2001 | 2002 | 2003 | 2004 | 2005 | 2006 | 2007 | 2008 | 2009 | 2010 | 2011 | 2012 | 2013 | 2014 | 2015 |
| balance sheet | ||||||||||||||||||
| Non-Current Assets | EUR mil | 62.8 | 67.7 | 71.7 | 84.4 | 101 | ||||||||||||
| Property, Plant & Equipment | EUR mil | 57.2 | 59.4 | 63.0 | 72.0 | 86.4 | ||||||||||||
| Intangible Assets | EUR mil | 0.534 | 0.897 | 0.941 | 1.81 | 4.00 | ||||||||||||
| Current Assets | EUR mil | 244 | 234 | 285 | 347 | 314 | ||||||||||||
| Inventories | EUR mil | 119 | 120 | 144 | 174 | 168 | ||||||||||||
| Receivables | EUR mil | 64.9 | 43.5 | 76.3 | 98.1 | 86.8 | ||||||||||||
| Cash & Cash Equivalents | EUR mil | 6.93 | 10.5 | 11.5 | 13.6 | 13.8 | ||||||||||||
| Total Assets | EUR mil | 307 | 302 | 357 | 431 | 416 | ||||||||||||
| Shareholders' Equity | EUR mil | 99.8 | 129 | 145 | 172 | 188 | ||||||||||||
| Of Which Minority Interest | EUR mil | 14.8 | 18.1 | 19.9 | 17.4 | 18.5 | ||||||||||||
| Liabilities | EUR mil | 207 | 172 | 212 | 259 | 228 | ||||||||||||
| Non-Current Liabilities | EUR mil | 36.8 | 37.3 | 35.3 | 35.7 | 32.9 | ||||||||||||
| Long-Term Debt | EUR mil | 12.5 | 11.6 | 11.0 | 10.8 | 0.675 | ||||||||||||
| Deferred Tax Liabilities | EUR mil | ... | ... | ... | ... | ... | ... | ... | ... | ... | ... | ... | ... | ... | ... | 2.83 | ||
| Current Liabilities | EUR mil | 170 | 135 | 177 | 224 | 195 | ||||||||||||
| Short-Term Debt | EUR mil | 36.3 | 25.2 | 61.4 | 96.5 | 62.1 | ||||||||||||
| Trade Payables | EUR mil | 38.9 | 30.9 | 44.7 | 45.3 | 39.9 | ||||||||||||
| Provisions | EUR mil | ... | ... | ... | ... | ... | ... | ... | ... | ... | ... | ... | ... | ... | ... | 13.9 | ||
| Equity And Liabilities | EUR mil | 307 | 302 | 357 | 431 | 416 | ||||||||||||
| growth rates | ||||||||||||||||||
| Total Asset Growth | % | ... | 22.2 | -1.68 | 18.4 | 20.8 | -3.65 | |||||||||||
| Shareholders' Equity Growth | % | ... | 8.50 | 29.5 | 12.2 | 18.5 | 9.22 | |||||||||||
| Net Debt Growth | % | ... | 33.0 | -37.4 | 132 | 53.8 | -47.7 | |||||||||||
| Total Debt Growth | % | ... | 49.3 | -24.7 | 96.9 | 48.2 | -41.5 | |||||||||||
| ratios | ||||||||||||||||||
| Total Debt | EUR mil | 48.8 | 36.8 | 72.4 | 107 | 62.8 | ||||||||||||
| Net Debt | EUR mil | 41.9 | 26.3 | 61.0 | 93.8 | 49.0 | ||||||||||||
| Working Capital | EUR mil | 145 | 133 | 176 | 227 | 215 | ||||||||||||
| Capital Employed | EUR mil | 208 | 200 | 248 | 311 | 316 | ||||||||||||
| Net Debt/Equity | 0.420 | 0.203 | 0.420 | 0.545 | 0.261 | |||||||||||||
| Cost of Financing | % | ... | 11.3 | 9.17 | 7.12 | 4.18 | 3.01 |
| cash flow | Unit | 1999 | 2000 | 2001 | 2002 | 2003 | 2004 | 2005 | 2006 | 2007 | 2008 | 2009 | 2010 | 2011 | 2012 | 2013 | 2014 | 2015 |
| cash flow | ||||||||||||||||||
| Net Profit | EUR mil | 9.86 | 31.7 | 27.6 | 30.9 | 26.3 | ||||||||||||
| Depreciation | EUR mil | 6.54 | 7.27 | 7.97 | 9.34 | 10.2 | ||||||||||||
| Non-Cash Items | EUR mil | ... | 43.1 | -16.5 | -5.04 | 6.78 | 33.8 | |||||||||||
| Change in Working Capital | EUR mil | ... | -42.0 | 12.4 | -43.3 | -50.7 | 11.8 | |||||||||||
| Total Cash From Operations | EUR mil | ... | 17.5 | 34.8 | -12.8 | -3.67 | 82.2 | |||||||||||
| Capital Expenditures | EUR mil | ... | -15.8 | -8.95 | -10.9 | -14.1 | -25.1 | |||||||||||
| Other Investments | EUR mil | ... | -1.19 | 0.330 | 0.748 | -2.87 | -1.41 | |||||||||||
| Total Cash From Investing | EUR mil | ... | -17.0 | -8.62 | -10.2 | -16.9 | -26.5 | |||||||||||
| Dividends Paid | EUR mil | -5.44 | -8.16 | -8.16 | -8.16 | -8.16 | ||||||||||||
| Issuance Of Shares | EUR mil | ... | 0 | 0 | 0 | 0 | 0 | |||||||||||
| Issuance Of Debt | EUR mil | ... | 16.1 | -12.1 | 35.6 | 34.9 | -44.6 | |||||||||||
| Total Cash From Financing | EUR mil | ... | 5.18 | -22.6 | 23.9 | 22.7 | -55.1 | |||||||||||
| Net Change In Cash | EUR mil | ... | 5.73 | 3.61 | 0.917 | 2.15 | 0.510 | |||||||||||
| ratios | ||||||||||||||||||
| Days Sales Outstanding | days | 43.8 | 26.6 | 51.4 | 55.5 | 42.9 | ||||||||||||
| Days Sales Of Inventory | days | ... | ... | ... | ... | ... | ... | ... | ... | 117 | 111 | 153 | 140 | 124 | ||||
| Days Payable Outstanding | days | ... | ... | ... | ... | ... | ... | ... | ... | 38.3 | 28.6 | 47.4 | 36.5 | 29.3 | ||||
| Cash Conversion Cycle | days | ... | ... | ... | ... | ... | ... | ... | ... | 122 | 109 | 157 | 159 | 137 | ||||
| Cash Earnings | EUR mil | 16.4 | 38.9 | 35.5 | 40.2 | 36.5 | ||||||||||||
| Cash Earnings Per Share | EUR | 2.41 | 5.73 | 5.23 | 5.92 | 5.37 | ||||||||||||
| Price/Cash Earnings (P/CE) | 12.0 | 6.55 | 6.95 | 7.79 | 11.0 | |||||||||||||
| Free Cash Flow | EUR mil | ... | 0.549 | 26.2 | -23.0 | -20.6 | 55.6 | |||||||||||
| Free Cash Flow Yield | % | ... | 0.270 | 10.2 | -9.99 | -6.40 | 13.3 |
| other data | Unit | 1999 | 2000 | 2001 | 2002 | 2003 | 2004 | 2005 | 2006 | 2007 | 2008 | 2009 | 2010 | 2011 | 2012 | 2013 | 2014 | 2015 |
| other data | ||||||||||||||||||
| ROA | % | 3.54 | 10.4 | 8.37 | 7.83 | 6.22 | ||||||||||||
| Gross Margin | % | ... | ... | ... | ... | ... | ... | ... | ... | 31.5 | 33.8 | 36.4 | 29.8 | 32.8 | ||||
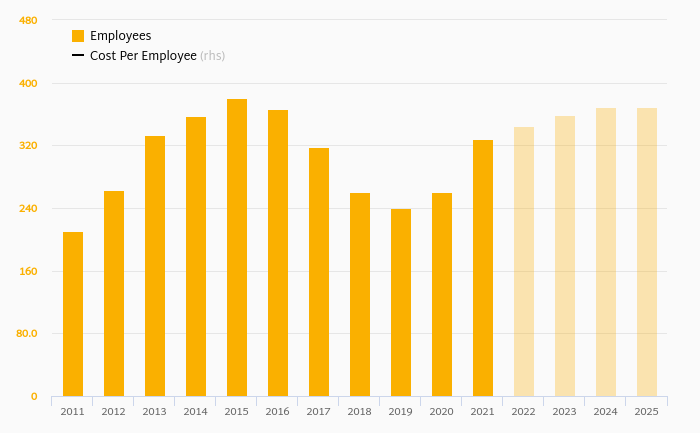
| Employees | ... | ... | ... | ... | ... | ... | ... | 1,946 | 2,046 | 2,123 | 2,432 | 2,551 | ||||||
| Cost Per Employee | USD per month | ... | ... | ... | ... | ... | ... | ... | ... | 5,933 | 5,888 | 6,211 | 5,628 | 6,168 | ||||
| Cost Per Employee (Local Currency) | EUR per month | ... | ... | ... | ... | ... | ... | ... | ... | 4,266 | 4,451 | 4,467 | 4,383 | 4,646 | ||||
| Staff Cost (As % Of Total Cost) | % | ... | ... | ... | ... | ... | ... | ... | ... | 19.4 | 20.0 | 22.8 | 21.1 | 20.4 | ||||
| Effective Tax Rate | % | 33.5 | 18.5 | 20.2 | 17.6 | 26.2 | ||||||||||||
| Enterprise Value (EV) | USD mil | 343 | 373 | 399 | 537 | 623 | ||||||||||||
| EV/EBITDA | 6.89 | 5.07 | 5.79 | 8.53 | 8.94 | |||||||||||||
| EV/Capital Employed | 1.15 | 1.40 | 1.24 | 1.31 | 1.43 | |||||||||||||
| EV/Sales | 0.455 | 0.474 | 0.530 | 0.648 | 0.636 | |||||||||||||
| EV/EBIT | 8.43 | 5.84 | 6.90 | 10.5 | 11.1 | |||||||||||||
| Domestic Sales | EUR mil | ... | ... | ... | ... | ... | ... | ... | ... | 298 | 308 | 281 | 447 | 504 | ... | |||
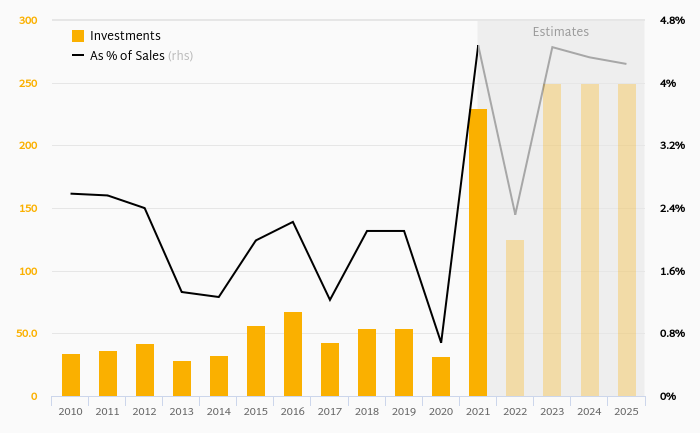
| Capital Expenditures (As % of Sales) | % | ... | 2.91 | 1.50 | 2.01 | 2.18 | 3.41 | |||||||||||
| Revenues From Abroad | EUR mil | ... | ... | ... | ... | ... | ... | ... | ... | 244 | 288 | 261 | 198 | 234 | ... | |||
| Revenues From Abroad (As % Of Total) | % | ... | ... | ... | ... | ... | ... | ... | ... | 45.1 | 48.4 | 48.1 | 30.7 | 31.7 | ... | |||
| Sales in Austria | EUR mil | ... | ... | ... | ... | ... | ... | ... | ... | 298 | 308 | 281 | 447 | 504 | ... | |||
| Sales in the USA | EUR mil | ... | ... | ... | ... | ... | ... | ... | ... | 116 | 123 | 120 | 145 | 172 | ||||
| Sales in Germany | EUR mil | ... | ... | ... | ... | ... | ... | ... | ... | 93.4 | 123 | 105 | 158 | 178 | ||||
| Sales in the Rest Of Europe | EUR mil | ... | ... | ... | ... | ... | ... | ... | ... | 19.7 | 22.9 | 23.2 | 24.0 | 46.4 | ... | |||
| Sales in Asia | EUR mil | ... | ... | ... | ... | ... | ... | ... | ... | 15.3 | 19.3 | 12.5 | 11.2 | 15.9 | ... | |||
| EBIT in Austria | EUR mil | ... | ... | ... | ... | ... | ... | ... | ... | 9.80 | 33.7 | 25.5 | 30.0 | 32.0 | ... | |||
| EBIT in the USA | EUR mil | ... | ... | ... | ... | ... | ... | ... | ... | 14.0 | 15.2 | 9.00 | 3.20 | 9.80 | ... | |||
| EBIT in Germany | EUR mil | ... | ... | ... | ... | ... | ... | ... | ... | 3.30 | 4.80 | 4.50 | 3.60 | -1.40 | ... | |||
| EBIT in the Rest Of Europe | EUR mil | ... | ... | ... | ... | ... | ... | ... | ... | 1.10 | 1.20 | 1.70 | 0.800 | 2.18 | ... | |||
| EBIT in Asia | EUR mil | ... | ... | ... | ... | ... | ... | ... | ... | 1.10 | 1.90 | 0.900 | 1.00 | -0.256 | ... | |||
| Employees - Austria | ... | ... | ... | ... | ... | ... | ... | 903 | 940 | 1,030 | 1,066 | 1,154 | ||||||
| Employees - USA | ... | ... | ... | ... | ... | ... | ... | ... | ... | ... | ... | 527 | 514 | 574 | 644 | ... | ||
| Employees - Germany | ... | ... | ... | ... | ... | ... | ... | ... | ... | ... | ... | 497 | 498 | 538 | 564 | ... | ||
| Employees - Rest Of The World | ... | ... | ... | ... | ... | ... | ... | ... | ... | ... | ... | 82.0 | 81.0 | 150 | 189 | ... | ||
| Sales From Vehicles | EUR mil | ... | ... | ... | ... | ... | ... | ... | ... | 377 | 424 | 370 | 443 | 517 | ||||
| Sales from Aerials | EUR mil | ... | ... | ... | ... | ... | ... | ... | ... | 70.0 | 66.0 | 68.0 | 72.0 | 71.5 | ... | |||
| Sales from Firefighting Components | EUR mil | ... | ... | ... | ... | ... | ... | ... | ... | 16.0 | 19.0 | 25.0 | 23.0 | 2.21 | ||||
| Sales from Fire & Safety Equipment | EUR mil | ... | ... | ... | ... | ... | ... | ... | ... | 52.0 | 57.0 | 48.0 | 67.0 | 81.2 | ||||
| Sales from Business Development | EUR mil | ... | ... | ... | ... | ... | ... | ... | ... | ... | ... | 1.00 | 1.00 | 2.00 | 3.00 | 0.738 | ... | ... |
| Sales from Service & Spare Parts | EUR mil | ... | ... | ... | ... | ... | ... | ... | ... | 23.0 | 27.0 | 28.0 | 35.0 | 36.9 | ||||
| Sales From Others | EUR mil | ... | ... | ... | ... | ... | ... | ... | ... | 3.00 | 2.00 | 1.00 | 3.00 | ... | ... | ... | ||
| Order Backlog | EUR mil | ... | ... | ... | ... | ... | ... | ... | 487 | 395 | 682 | 581 | 590 | |||||
| Order Intake | EUR mil | ... | ... | ... | ... | ... | ... | ... | 576 | 497 | 827 | 533 | 761 | |||||
| Number of Truck-Mounted Pumps Sold | Units | ... | ... | ... | ... | ... | ... | ... | ... | ... | 1,773 | 1,787 | 1,685 | 2,088 | 2,112 | |||
| Number of Portable Pumps Sold | Units | ... | ... | ... | ... | ... | ... | ... | ... | ... | 951 | 1,260 | 1,053 | 955 | 898 | |||
| Number of Vehicles Sold | Units | ... | ... | ... | ... | ... | ... | ... | ... | ... | ... | ... | 2,697 | 2,013 | 2,297 | 2,697 |
Get all company financials in excel:


Rosenbauer International AG is an Austria-based manufacturer of mobile fire protection and civil defense solutions. The Group is one of the world’s three largest manufacturers of fire-service vehicles. It is headquartered in Leonding, Austria. Rosenbauer supplies the fire fighting sector in over 100 countries with a wide range of custom fire and rescue apparatus and services. It produces its extensive series of fire fighting vehicles and aerials in three continents. Its product portfolio includes a range of municipal fire fighting vehicles and aerials built to both European and the United States standards, Aircraft Rescue Fire Fighting (ARFF) vehicles, industrial fire fighting vehicles, turntable ladders and aerial rescue platforms, as well as other fire and safety components and equipment. Rosenbauer International AG has been listed on the Vienna Stock Exchange since 1994.
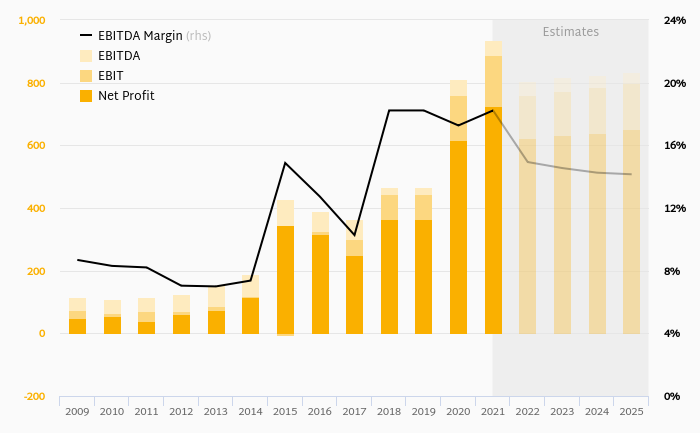
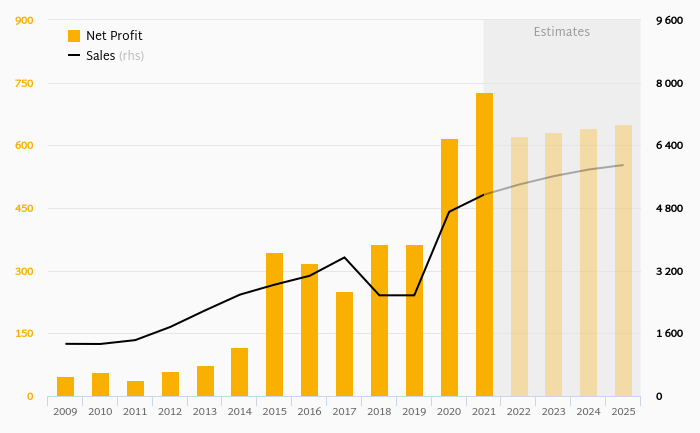
Rosenbauer International has been growing its sales by a year on average in the last 5 years. EBITDA has grown on average by 3.06% a year during that time to total of EUR 64.7 mil in 2015, or 7.47% of sales. That’s compared to 7.77% average margin seen in last five years.
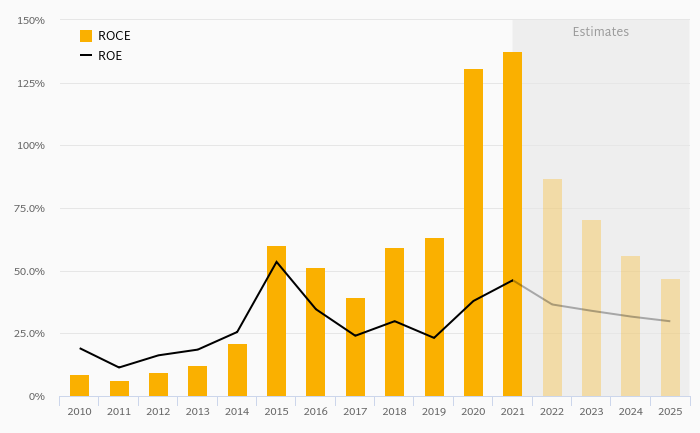
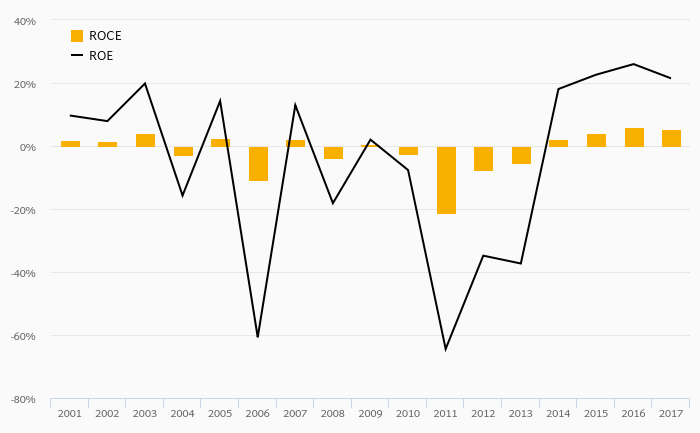
The company netted EUR 22.4 mil in 2015 implying ROE of 10.6% and ROCE of 5.09%. Again, the average figures were 15.8% and 8.88%, respectively when looking at the previous 5 years.
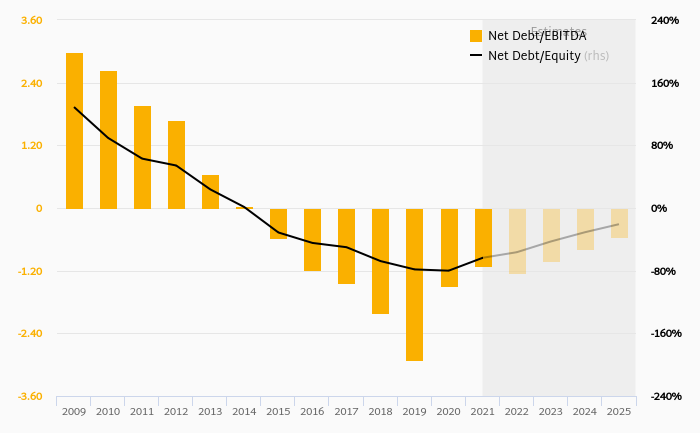
Rosenbauer International’s net debt amounted to EUR 192 mil at the end of 2015, or 0.846 of equity. When compared to EBITDA, net debt was 2.97x, up when compared to average of 1.91x seen in the last 5 years.
Rosenbauer International stock traded at EUR 66.6 per share at the end of 2015 resulting in a market capitalization of USD 548 mil. Over the previous five years, stock price grew by 77.59999999999999% or 12.2% a year on average. The closing price put stock at a 12-month trailing EV/EBITDA of 9.36x and price to earnings (PE) of 20.2x as of 2015.
 Helgi Library