By Helgi Library - December 22, 2019
Royal Bank of Scotland Group's non-performing loans reached 2.26% of total loans at the end of 2019-09-30, down from 2.69% compar...
By Helgi Library - December 22, 2019
Royal Bank of Scotland Group stock traded at 2.07 per share at the end of third quarter of 2019 implying a market capitalization of U...
By Helgi Library - December 22, 2019
Royal Bank of Scotland Group made a net profit of GBP -210 mil under revenues of GBP 3,077 mil in the third quarter of 2019, down 138...
| Profit Statement | 2016 | 2017 | 2018 | |
| Net Interest Income | GBP mil | 8,779 | 9,213 | 8,690 |
| Net Fee Income | GBP mil | 2,535 | 2,455 | 2,357 |
| Other Income | GBP mil | 2,061 | 1,848 | 3,276 |
| Total Revenues | GBP mil | 13,375 | 13,516 | 14,323 |
| Operating Profit | GBP mil | 5,392 | 5,788 | 7,001 |
| Provisions | GBP mil | 478 | 493 | 398 |
| Net Profit | GBP mil | -5,258 | 1,380 | 2,092 |
| Balance Sheet | 2016 | 2017 | 2018 | |
| Interbank Loans | GBP mil | 59,065 | 56,986 | 47,596 |
| Customer Loans | GBP mil | 323,023 | 323,184 | 305,089 |
| Total Assets | GBP mil | 798,656 | 738,056 | 694,235 |
| Shareholders' Equity | GBP mil | 49,404 | 49,093 | 46,490 |
| Interbank Borrowing | GBP mil | 94,418 | 77,900 | 95,647 |
| Customer Deposits | GBP mil | 353,872 | 367,034 | 360,914 |
| Issued Debt Securities | GBP mil | 39,975 | 74,652 | 13,601 |
| Ratios | 2016 | 2017 | 2018 | |
| ROE | % | -10.2 | 2.80 | 4.38 |
| ROA | % | -0.652 | 0.180 | 0.292 |
| Costs (As % Of Assets) | % | 0.989 | 1.01 | 1.02 |
| Costs (As % Of Income) | % | 59.7 | 57.2 | 51.1 |
| Capital Adequacy Ratio | % | 22.9 | 21.3 | 21.8 |
| Net Interest Margin | % | 1.09 | 1.20 | 1.21 |
| Loans (As % Of Deposits) | % | 91.3 | 88.1 | 84.5 |
| NPLs (As % Of Loans) | % | 3.15 | 2.72 | 2.50 |
| Provisions (As % Of NPLs) | % | 43.2 | 42.8 | 43.6 |
| Valuation | 2016 | 2017 | 2018 | |
| Price/Earnings (P/E) | ... | 24.1 | 12.5 | |
| Price/Book Value (P/BV) | 0.536 | 0.677 | 0.561 | |
| Dividend Yield | % | 0 | 0 | 6.00 |
| Earnings Per Share (EPS) | -0.448 | 0.116 | 0.173 | |
| Book Value Per Share | 4.21 | 4.11 | 3.85 | |
| Dividend Per Share | 0 | 0 | 0.130 | |
Get all company financials in excel:
| summary | Unit | 1988 | 1989 | 1990 | 1991 | 1992 | 1993 | 1994 | 1995 | 1996 | 1997 | 1998 | 1999 | 2000 | 2001 | 2002 | 2003 | 2004 | 2005 | 2006 | 2007 | 2008 | 2009 | 2010 | 2011 | 2012 | 2013 | 2014 | 2015 | 2016 | 2017 | 2018 |
| income statement | ||||||||||||||||||||||||||||||||
| Net Interest Income | GBP mil | 12,607 | 9,821 | 9,288 | 8,763 | 8,779 | ||||||||||||||||||||||||||
| Total Revenues | GBP mil | 22,680 | 17,519 | 15,696 | 13,683 | 13,375 | ||||||||||||||||||||||||||
| Operating Profit | GBP mil | 4,759 | 5,300 | 5,708 | 5,533 | 5,392 | ||||||||||||||||||||||||||
| Net Profit | GBP mil | -5,754 | -8,597 | -2,771 | -1,594 | -5,258 | ||||||||||||||||||||||||||
| balance sheet | ||||||||||||||||||||||||||||||||
| Interbank Loans | GBP mil | 133,998 | 103,968 | 87,722 | 58,204 | 59,065 | ||||||||||||||||||||||||||
| Customer Loans | GBP mil | 430,088 | 390,825 | 334,251 | 306,334 | 323,023 | ||||||||||||||||||||||||||
| Debt Securities | GBP mil | 172,670 | 122,410 | 92,284 | 88,489 | 79,846 | ||||||||||||||||||||||||||
| Total Assets | GBP mil | 1,312,300 | 1,027,880 | 1,051,020 | 815,408 | 798,656 | ||||||||||||||||||||||||||
| Shareholders' Equity | GBP mil | 70,448 | 59,215 | 58,709 | 54,147 | 49,404 | ||||||||||||||||||||||||||
| Interbank Borrowing | GBP mil | 217,036 | 148,485 | 121,045 | 95,773 | 94,418 | ||||||||||||||||||||||||||
| Customer Deposits | GBP mil | 433,239 | 414,396 | 354,288 | 343,186 | 353,872 | ||||||||||||||||||||||||||
| Issued Debt Securities | GBP mil | 121,365 | 91,831 | 73,185 | 41,441 | 39,975 | ||||||||||||||||||||||||||
| ratios | ||||||||||||||||||||||||||||||||
| ROE | % | -7.86 | -13.3 | -4.70 | -2.82 | -10.2 | ||||||||||||||||||||||||||
| ROA | % | -0.408 | -0.735 | -0.267 | -0.171 | -0.652 | ||||||||||||||||||||||||||
| Costs (As % Of Assets) | % | 1.27 | 1.04 | 0.961 | 0.873 | 0.989 | ||||||||||||||||||||||||||
| Costs (As % Of Income) | % | 79.0 | 69.7 | 63.6 | 59.6 | 59.7 | ||||||||||||||||||||||||||
| Capital Adequacy Ratio | % | 14.5 | 16.5 | 17.1 | 24.7 | 22.9 | ||||||||||||||||||||||||||
| Net Interest Margin | % | 0.894 | 0.839 | 0.894 | 0.939 | 1.09 | ||||||||||||||||||||||||||
| Interest Income (As % Of Revenues) | % | 55.6 | 56.1 | 59.2 | 64.0 | 65.6 | ||||||||||||||||||||||||||
| Fee Income (As % Of Revenues) | % | 21.5 | 21.4 | 22.5 | 21.4 | 19.0 | ||||||||||||||||||||||||||
| Equity (As % Of Assets) | % | 5.37 | 5.76 | 5.59 | 6.64 | 6.19 | ||||||||||||||||||||||||||
| Loans (As % Of Deposits) | % | 99.3 | 94.3 | 94.3 | 89.3 | 91.3 | ||||||||||||||||||||||||||
| Loans (As % Assets) | % | 32.8 | 38.0 | 31.8 | 37.6 | 40.4 | ||||||||||||||||||||||||||
| NPLs (As % Of Loans) | % | 9.11 | 9.47 | 7.64 | 3.87 | 3.15 | ||||||||||||||||||||||||||
| Provisions (As % Of NPLs) | % | 51.4 | 63.9 | 64.9 | 58.6 | 43.2 | ||||||||||||||||||||||||||
| valuation | ||||||||||||||||||||||||||||||||
| Market Capitalisation (End Of Period) | USD mil | 59,334 | 62,713 | 69,796 | 51,908 | 32,560 | ||||||||||||||||||||||||||
| Number Of Shares (Average) | mil | 11,002 | 11,311 | 11,447 | 11,576 | 11,743 | ||||||||||||||||||||||||||
| Share Price (End Of Period) | 3.32 | 3.35 | 3.91 | 3.03 | 2.25 | |||||||||||||||||||||||||||
| Earnings Per Share (EPS) | -0.523 | -0.760 | -0.242 | -0.138 | -0.448 | |||||||||||||||||||||||||||
| Book Value Per Share | 6.40 | 5.24 | 5.13 | 4.68 | 4.21 | |||||||||||||||||||||||||||
| Dividend Per Share | 0 | 0 | 0 | 0 | 0 | |||||||||||||||||||||||||||
| Price/Earnings (P/E) | ... | ... | ... | ... | ... | ... | ... | ... | ... | |||||||||||||||||||||||
| Price/Book Value (P/BV) | 0.518 | 0.639 | 0.763 | 0.647 | 0.536 | |||||||||||||||||||||||||||
| Dividend Yield | % | 0 | 0 | 0 | 0 | 0 | ||||||||||||||||||||||||||
| Earnings Per Share Growth | % | ... | 183 | 45.3 | -68.2 | -43.1 | 225 | |||||||||||||||||||||||||
| Book Value Per Share Growth | % | ... | -8.89 | -18.2 | -2.03 | -8.80 | -10.1 |
| income statement | Unit | 1988 | 1989 | 1990 | 1991 | 1992 | 1993 | 1994 | 1995 | 1996 | 1997 | 1998 | 1999 | 2000 | 2001 | 2002 | 2003 | 2004 | 2005 | 2006 | 2007 | 2008 | 2009 | 2010 | 2011 | 2012 | 2013 | 2014 | 2015 | 2016 | 2017 | 2018 |
| income statement | ||||||||||||||||||||||||||||||||
| Interest Income | GBP mil | 19,735 | 15,292 | 13,109 | 11,921 | 11,329 | ||||||||||||||||||||||||||
| Interest Cost | GBP mil | 7,128 | 5,471 | 3,821 | 3,158 | 2,550 | ||||||||||||||||||||||||||
| Net Interest Income | GBP mil | 12,607 | 9,821 | 9,288 | 8,763 | 8,779 | ||||||||||||||||||||||||||
| Net Fee Income | GBP mil | 4,875 | 3,755 | 3,539 | 2,933 | 2,535 | ||||||||||||||||||||||||||
| Other Income | GBP mil | 5,198 | 3,943 | 2,869 | 1,987 | 2,061 | ||||||||||||||||||||||||||
| Total Revenues | GBP mil | 22,680 | 17,519 | 15,696 | 13,683 | 13,375 | ||||||||||||||||||||||||||
| Operating Cost | GBP mil | 17,921 | 12,219 | 9,988 | 8,150 | 7,983 | ||||||||||||||||||||||||||
| Operating Profit | GBP mil | 4,759 | 5,300 | 5,708 | 5,533 | 5,392 | ||||||||||||||||||||||||||
| Provisions | GBP mil | 5,279 | 8,120 | -1,352 | -727 | 478 | ||||||||||||||||||||||||||
| Extra and Other Cost | GBP mil | 4,757 | 6,029 | 4,417 | 8,963 | 8,996 | ||||||||||||||||||||||||||
| Pre-Tax Profit | GBP mil | -5,277 | -8,849 | 2,643 | -2,703 | -4,082 | ||||||||||||||||||||||||||
| Tax | GBP mil | 441 | 186 | 1,909 | 23.0 | 1,166 | ||||||||||||||||||||||||||
| Minorities | GBP mil | -136 | 120 | 60.0 | 409 | 10.0 | ||||||||||||||||||||||||||
| Net Profit | GBP mil | -5,754 | -8,597 | -2,771 | -1,594 | -5,258 | ||||||||||||||||||||||||||
| Dividends | GBP mil | 0 | 0 | 0 | 0 | 0 | ||||||||||||||||||||||||||
| growth rates | ||||||||||||||||||||||||||||||||
| Net Interest Income Growth | % | ... | -4.39 | -22.1 | -5.43 | -5.65 | 0.183 | |||||||||||||||||||||||||
| Net Fee Income Growth | % | ... | -10.0 | -23.0 | -5.75 | -17.1 | -13.6 | |||||||||||||||||||||||||
| Total Revenue Growth | % | ... | -3.03 | -22.8 | -10.4 | -12.8 | -2.25 | |||||||||||||||||||||||||
| Operating Cost Growth | % | ... | 5.08 | -31.8 | -18.3 | -18.4 | -2.05 | |||||||||||||||||||||||||
| Operating Profit Growth | % | ... | -24.9 | 11.4 | 7.70 | -3.07 | -2.55 | |||||||||||||||||||||||||
| Pre-Tax Profit Growth | % | ... | 343 | 67.7 | -130 | -202 | 51.0 | |||||||||||||||||||||||||
| Net Profit Growth | % | ... | 188 | 49.4 | -67.8 | -42.5 | 230 | |||||||||||||||||||||||||
| market share | ||||||||||||||||||||||||||||||||
| Market Share in Revenues | % | ... | ... | ... | ... | ... | ... | ... | ... | ... | ... | ... | ... | ... | ... | ... | ... | ... | ... | ... | ... | ... | ... | ... | ... | ... | ... | ... | ... | ... | ||
| Market Share in Net Profit | % | ... | ... | ... | ... | ... | ... | ... | ... | ... | ... | ... | ... | ... | ... | ... | ... | ... | ... | ... | ... | ... | ... | ... | ... | ... | ... | ... | ... | ... | ||
| Market Share in Employees | % | ... | ... | ... | ... | ... | ... | ... | ... | ... | ... | ... | ... | ... | ... | ... | ... | ... | ... | ... | ... | ... | ... | ... | ... | ... | ... | ... | ... | ... |
| balance sheet | Unit | 1988 | 1989 | 1990 | 1991 | 1992 | 1993 | 1994 | 1995 | 1996 | 1997 | 1998 | 1999 | 2000 | 2001 | 2002 | 2003 | 2004 | 2005 | 2006 | 2007 | 2008 | 2009 | 2010 | 2011 | 2012 | 2013 | 2014 | 2015 | 2016 | 2017 | 2018 |
| balance sheet | ||||||||||||||||||||||||||||||||
| Cash | GBP mil | 79,290 | 82,659 | 74,872 | 79,404 | 74,250 | ||||||||||||||||||||||||||
| Interbank Loans | GBP mil | 133,998 | 103,968 | 87,722 | 58,204 | 59,065 | ||||||||||||||||||||||||||
| Customer Loans | GBP mil | 430,088 | 390,825 | 334,251 | 306,334 | 323,023 | ||||||||||||||||||||||||||
| Debt Securities | GBP mil | 172,670 | 122,410 | 92,284 | 88,489 | 79,846 | ||||||||||||||||||||||||||
| Fixed Assets | GBP mil | 23,329 | 20,277 | 13,948 | 10,104 | 9,975 | ||||||||||||||||||||||||||
| Total Assets | GBP mil | 1,312,300 | 1,027,880 | 1,051,020 | 815,408 | 798,656 | ||||||||||||||||||||||||||
| Shareholders' Equity | GBP mil | 70,448 | 59,215 | 58,709 | 54,147 | 49,404 | ||||||||||||||||||||||||||
| Of Which Minority Interest | GBP mil | 1,770 | 473 | 2,946 | 716 | 795 | ||||||||||||||||||||||||||
| Liabilities | GBP mil | 1,241,850 | 968,663 | 992,310 | 761,261 | 749,252 | ||||||||||||||||||||||||||
| Interbank Borrowing | GBP mil | 217,036 | 148,485 | 121,045 | 95,773 | 94,418 | ||||||||||||||||||||||||||
| Customer Deposits | GBP mil | 433,239 | 414,396 | 354,288 | 343,186 | 353,872 | ||||||||||||||||||||||||||
| Issued Debt Securities | GBP mil | 121,365 | 91,831 | 73,185 | 41,441 | 39,975 | ||||||||||||||||||||||||||
| Other Liabilities | GBP mil | 470,207 | 313,951 | 443,792 | 280,861 | 260,987 | ||||||||||||||||||||||||||
| asset quality | ||||||||||||||||||||||||||||||||
| Non-Performing Loans | GBP mil | 41,127 | 39,392 | 26,884 | 12,137 | 10,310 | ||||||||||||||||||||||||||
| Gross Loans | GBP mil | 451,224 | 415,978 | 351,711 | 313,452 | 327,478 | ||||||||||||||||||||||||||
| Provisions | GBP mil | 5,279 | 8,120 | -1,352 | -727 | 478 | ||||||||||||||||||||||||||
| growth rates | ||||||||||||||||||||||||||||||||
| Customer Loan Growth | % | ... | -5.29 | -9.13 | -14.5 | -8.35 | 5.45 | |||||||||||||||||||||||||
| Total Asset Growth | % | ... | -12.9 | -21.7 | 2.25 | -22.4 | -2.05 | |||||||||||||||||||||||||
| Shareholders' Equity Growth | % | ... | -7.37 | -15.9 | -0.855 | -7.77 | -8.76 | |||||||||||||||||||||||||
| Customer Deposit Growth | % | ... | 4.61 | -4.35 | -14.5 | -3.13 | 3.11 | |||||||||||||||||||||||||
| market share | ||||||||||||||||||||||||||||||||
| Market Share in Customer Loans | % | ... | ... | ... | ... | ... | ... | ... | ... | ... | ... | ... | ... | ... | ... | ... | ... | ... | ... | ... | ... | ... | ... | ... | ... | ... | ... | ... | ... | ... | ||
| Market Share in Total Assets | % | ... | ... | ... | ... | ... | ... | ... | ... | ... | ... | ... | ... | ... | ... | ... | ... | ... | ... | ... | ... | ... | ... | ... | ... | ... | ... | ... | ... | ... | ||
| Market Share in Customer Deposits | % | ... | ... | ... | ... | ... | ... | ... | ... | ... | ... | ... | ... | ... | ... | ... | ... | ... | ... | ... | ... | ... | ... | ... | ... | ... | ... | ... | ... | ... |
| ratios | Unit | 1988 | 1989 | 1990 | 1991 | 1992 | 1993 | 1994 | 1995 | 1996 | 1997 | 1998 | 1999 | 2000 | 2001 | 2002 | 2003 | 2004 | 2005 | 2006 | 2007 | 2008 | 2009 | 2010 | 2011 | 2012 | 2013 | 2014 | 2015 | 2016 | 2017 | 2018 |
| ratios | ||||||||||||||||||||||||||||||||
| ROE | % | -7.86 | -13.3 | -4.70 | -2.82 | -10.2 | ||||||||||||||||||||||||||
| ROA | % | -0.408 | -0.735 | -0.267 | -0.171 | -0.652 | ||||||||||||||||||||||||||
| Costs (As % Of Assets) | % | 1.27 | 1.04 | 0.961 | 0.873 | 0.989 | ||||||||||||||||||||||||||
| Costs (As % Of Income) | % | 79.0 | 69.7 | 63.6 | 59.6 | 59.7 | ||||||||||||||||||||||||||
| Capital Adequacy Ratio | % | 14.5 | 16.5 | 17.1 | 24.7 | 22.9 | ||||||||||||||||||||||||||
| Tier 1 Ratio | % | 12.4 | 13.1 | 13.2 | 19.1 | 17.7 | ||||||||||||||||||||||||||
| Net Interest Margin | % | 0.894 | 0.839 | 0.894 | 0.939 | 1.09 | ||||||||||||||||||||||||||
| Interest Spread | % | ... | 0.867 | 0.812 | 0.871 | 0.917 | 1.07 | |||||||||||||||||||||||||
| Asset Yield | % | 1.40 | 1.31 | 1.26 | 1.28 | 1.40 | ||||||||||||||||||||||||||
| Cost Of Liabilities | % | ... | 0.533 | 0.495 | 0.390 | 0.360 | 0.338 | |||||||||||||||||||||||||
| Payout Ratio | % | 76.3 | 86.6 | 76.6 | 75.7 | 75.4 | ||||||||||||||||||||||||||
| Interest Income (As % Of Revenues) | % | 55.6 | 56.1 | 59.2 | 64.0 | 65.6 | ||||||||||||||||||||||||||
| Fee Income (As % Of Revenues) | % | 21.5 | 21.4 | 22.5 | 21.4 | 19.0 | ||||||||||||||||||||||||||
| Other Income (As % Of Revenues) | % | 22.9 | 22.5 | 18.3 | 14.5 | 15.4 | ||||||||||||||||||||||||||
| Equity (As % Of Assets) | % | 5.37 | 5.76 | 5.59 | 6.64 | 6.19 | ||||||||||||||||||||||||||
| Loans (As % Of Deposits) | % | 99.3 | 94.3 | 94.3 | 89.3 | 91.3 | ||||||||||||||||||||||||||
| Loans (As % Assets) | % | 32.8 | 38.0 | 31.8 | 37.6 | 40.4 | ||||||||||||||||||||||||||
| NPLs (As % Of Loans) | % | 9.11 | 9.47 | 7.64 | 3.87 | 3.15 | ||||||||||||||||||||||||||
| Provisions (As % Of NPLs) | % | 51.4 | 63.9 | 64.9 | 58.6 | 43.2 | ||||||||||||||||||||||||||
| Provisions (As % Of Loans) | % | 4.91 | 6.44 | 5.22 | 2.32 | 1.38 | ||||||||||||||||||||||||||
| Cost of Provisions (As % Of Loans) | % | 1.19 | 1.98 | -0.373 | -0.227 | 0.152 |
| other data | Unit | 1988 | 1989 | 1990 | 1991 | 1992 | 1993 | 1994 | 1995 | 1996 | 1997 | 1998 | 1999 | 2000 | 2001 | 2002 | 2003 | 2004 | 2005 | 2006 | 2007 | 2008 | 2009 | 2010 | 2011 | 2012 | 2013 | 2014 | 2015 | 2016 | 2017 | 2018 |
| other data | ||||||||||||||||||||||||||||||||
| Employees | 123,000 | 118,600 | 91,500 | 90,158 | 77,800 |
Get all company financials in excel:
By Helgi Library - December 22, 2019
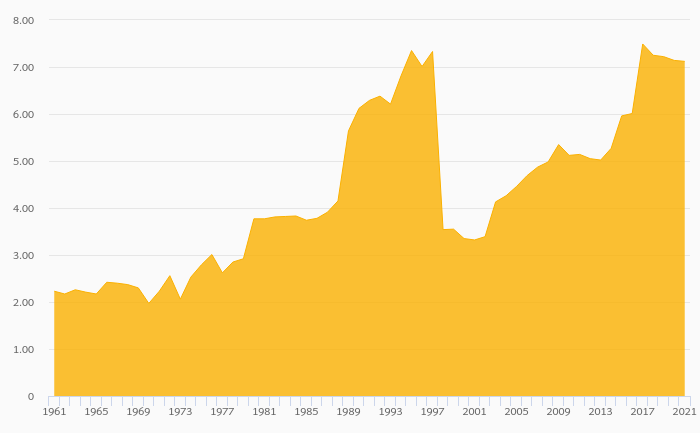
Royal Bank of Scotland Group's net interest margin amounted to 1.07% in the third quarter of 2019, down from 1.09% when compared to the previous quarter. Historically, the bank’s net interest margin reached an all time high of 1.23% in 4Q2018 and an all time...
By Helgi Library - December 22, 2019
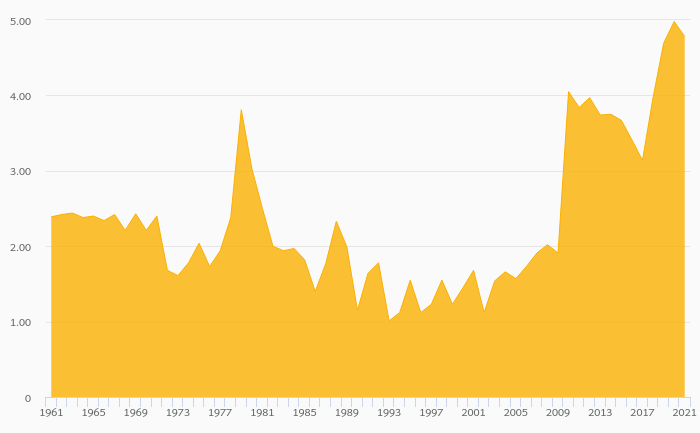
Royal Bank of Scotland Group stock traded at 2.07 per share at the end third quarter of 2019 implying a market capitalization of USD 30,884 mil. Since the end of 3Q2014, the stock has depreciated by -43.7 % implying an annual average growth of -10.8 %. In absolute ter...
By Helgi Library - December 22, 2019
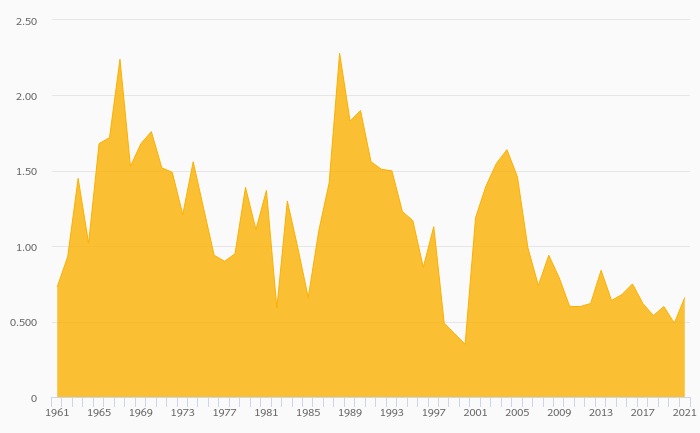
Royal Bank of Scotland Group's capital adequacy ratio reached 20.5% at the end of third quarter of 2019, down from 20.9% when compared to the previous quarter. Historically, the bank’s capital ratio hit an all time high of 24.7% in 3Q2018 and an all time low of 11....
By Helgi Library - December 22, 2019
Royal Bank of Scotland Group stock traded at 2.07 per share at the end of third quarter of 2019 implying a market capitalization of USD 30,884 mil. Over the last five years, the stock has depreciated by -43.7 % implying an annual average growth of -10.8 %. In absolute...
By Helgi Library - December 22, 2019
Royal Bank of Scotland Group generated total banking revenues of GBP 3,077 mil in the third quarter of 2019, down 20.7% when compared to the same period of last year and 28.8% when compared to the previous quarter. Historically, the bank’s revenues containing...
By Helgi Library - December 22, 2019
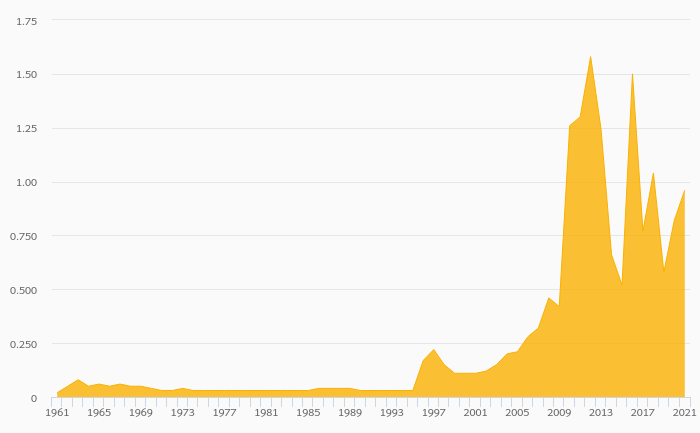
Royal Bank of Scotland Group's Equity reached 5.79% of total assets in the 3Q2019, up from 5.49% for the previous year. As a share of net customer loans, the ratio amounted to 16.7% at the end of the third quarter of 2019. ...
By Helgi Library - December 22, 2019
Royal Bank of Scotland Group's customer loan growth reached -0.026% in 2019-09-30, up from -1.56% compared to the previous year. Historically, the bank’s loans growth reached an all time high of 5.45% in 2016-12-31 and an all time low of -26.9% in 2010-12-31. ...
By Helgi Library - December 22, 2019
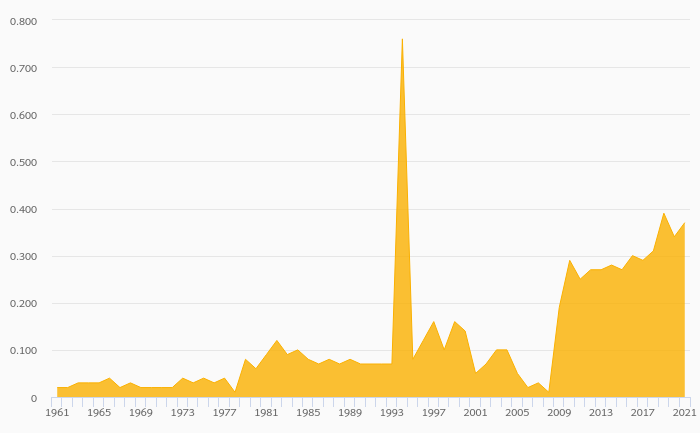
Royal Bank of Scotland Group's capital adequacy ratio reached 21.8% at the end of 2018, up from 21.3% compared to the previous year. Historically, the bank’s capital ratio hit an all time high of 24.7% in 2015 and an all time low of 9.40% in 1988. The Tier 1 ...
By Helgi Library - December 22, 2019
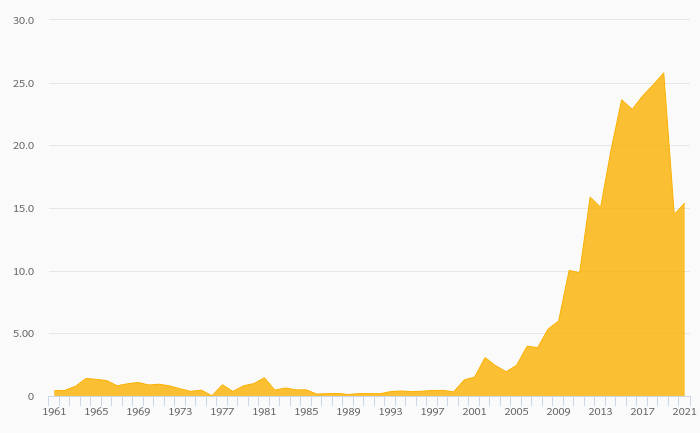
Royal Bank of Scotland Group's non-performing loans reached 2.50% of total loans at the end of 2018, down from 2.72% compared to the previous year. Historically, the NPL ratio hit an all time high of 9.47% in 2013 and an all time low of 0.645% in 1999. Prov...
By Helgi Library - December 22, 2019
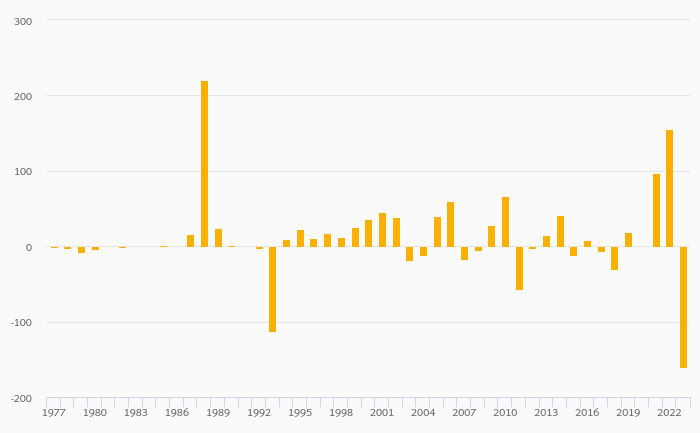
Royal Bank of Scotland Group made a net profit of GBP 2,092 mil under revenues of GBP 14,323 mil in 2018, up 51.6% and 5.97% respectively compared to the previous year. Historically, the bank’s net profit reached an all time high of GBP 7,549 mil in 2007 and an all time ...
 Helgi Library