By Helgi Library - March 1, 2020
Sacombank's net interest margin amounted to 1.59% in the fourth quarter of 2019, down from 2.63% when compared to the previous q...
By Helgi Library - March 1, 2020
Sacombank's customer deposits reached VND 291,653 bil in 2016-12-31, up 2.19% compared to the previous year. Vietnamese banking...
By Helgi Library - March 4, 2020
Sacombank's non-performing loans reached 1.94% of total loans at the end of 2019-12-31, down from 2.13% compared to the previous ...
| Profit Statement | Jun 2019 | Sep 2019 | Dec 2019 | |
| Net Interest Income | VND bil | 2,023 | 2,926 | 1,800 |
| Net Fee Income | VND bil | 742 | 747 | 1,192 |
| Other Income | VND bil | 311 | 773 | 1,224 |
| Total Revenues | VND bil | 3,076 | 4,447 | 4,216 |
| Staff Cost | VND bil | 1,348 | 1,433 | 1,523 |
| Operating Profit | VND bil | 786 | 2,043 | 1,631 |
| Provisions | VND bil | 616 | 637 | 469 |
| Net Profit | VND bil | -149 | 772 | 532 |
| Balance Sheet | Jun 2019 | Sep 2019 | Dec 2019 | |
| Interbank Loans | VND bil | 16,970 | 17,792 | 13,151 |
| Customer Loans | VND bil | 275,512 | 286,379 | 292,059 |
| Total Assets | VND bil | 439,170 | 450,200 | 453,581 |
| Shareholders' Equity | VND bil | 25,499 | 26,230 | 26,742 |
| Interbank Borrowing | VND bil | 2,843 | 2,685 | 3,225 |
| Customer Deposits | VND bil | 397,801 | 399,370 | 400,844 |
| Issued Debt Securities | VND bil | 505 | 10,156 | 10,116 |
| Ratios | Jun 2019 | Sep 2019 | Dec 2019 | |
| ROE | % | -2.34 | 11.9 | 8.03 |
| ROA | % | -0.138 | 0.694 | 0.471 |
| Costs (As % Of Assets) | % | 2.12 | 2.16 | 2.29 |
| Costs (As % Of Income) | % | 74.4 | 54.1 | 61.3 |
| Net Interest Margin | % | 1.87 | 2.63 | 1.59 |
| Loans (As % Of Deposits) | % | 69.3 | 71.7 | 72.9 |
| NPLs (As % Of Loans) | % | 2.04 | 2.00 | 1.94 |
| Provisions (As % Of NPLs) | % | 68.5 | 70.5 | 69.3 |
| Valuation | Jun 2019 | Sep 2019 | Dec 2019 | |
| Price/Earnings (P/E) | -34.3 | 6.16 | 8.53 | |
| Price/Book Value (P/BV) | 0.803 | 0.725 | 0.678 | |
| Dividend Yield | % | ... | ... | ... |
| Earnings Per Share (EPS) | VND | -331 | 1,712 | 1,179 |
| Book Value Per Share | VND | 14,137 | 14,543 | 14,826 |
| Dividend Per Share | VND | ... | ... | ... |
Get all company financials in excel:
| summary | Unit | Sep 2006 | Dec 2006 | Mar 2007 | Jun 2007 | Sep 2007 | Dec 2007 | Mar 2008 | Jun 2008 | Sep 2008 | Dec 2008 | Mar 2009 | Jun 2009 | Sep 2009 | Dec 2009 | Mar 2010 | Jun 2010 | Sep 2010 | Dec 2010 | Mar 2011 | Jun 2011 | Sep 2011 | Dec 2011 | Mar 2012 | Jun 2012 | Sep 2012 | Dec 2012 | Mar 2013 | Jun 2013 | Sep 2013 | Dec 2013 | Mar 2014 | Jun 2014 | Sep 2014 | Dec 2014 | Mar 2015 | Jun 2015 | Sep 2015 | Dec 2015 | Mar 2016 | Jun 2016 | Sep 2016 | Dec 2016 | Mar 2017 | Jun 2017 | Sep 2017 | Dec 2017 | Mar 2018 | Jun 2018 | Sep 2018 | Dec 2018 | Mar 2019 | Jun 2019 | Sep 2019 | Dec 2019 |
| income statement | |||||||||||||||||||||||||||||||||||||||||||||||||||||||
| Net Interest Income | VND bil | 1,783 | 2,071 | 2,111 | 2,460 | 2,023 | |||||||||||||||||||||||||||||||||||||||||||||||||
| Total Revenues | VND bil | 2,813 | 3,220 | 4,010 | 3,871 | 3,076 | |||||||||||||||||||||||||||||||||||||||||||||||||
| Operating Profit | VND bil | ... | ... | ... | ... | ... | 1,055 | 1,255 | 1,637 | 1,819 | 786 | ||||||||||||||||||||||||||||||||||||||||||||
| Net Profit | VND bil | 281 | 163 | 798 | 844 | -149 | |||||||||||||||||||||||||||||||||||||||||||||||||
| balance sheet | |||||||||||||||||||||||||||||||||||||||||||||||||||||||
| Interbank Loans | VND bil | ... | ... | ... | ... | 6,813 | 1,856 | 4,822 | 9,531 | 16,970 | |||||||||||||||||||||||||||||||||||||||||||||
| Customer Loans | VND bil | 243,565 | 249,548 | 253,100 | 267,226 | 275,512 | |||||||||||||||||||||||||||||||||||||||||||||||||
| Debt Securities | VND bil | ... | ... | 79,097 | 78,818 | 76,202 | 75,348 | 75,241 | |||||||||||||||||||||||||||||||||||||||||||||||
| Total Assets | VND bil | 400,686 | 403,602 | 406,041 | 425,033 | 439,170 | |||||||||||||||||||||||||||||||||||||||||||||||||
| Shareholders' Equity | VND bil | 23,649 | 23,781 | 24,632 | 25,477 | 25,499 | |||||||||||||||||||||||||||||||||||||||||||||||||
| Interbank Borrowing | VND bil | 3,553 | 3,984 | 11,849 | 2,711 | 2,843 | |||||||||||||||||||||||||||||||||||||||||||||||||
| Customer Deposits | VND bil | 364,046 | 357,220 | 357,455 | 377,223 | 397,801 | |||||||||||||||||||||||||||||||||||||||||||||||||
| Issued Debt Securities | VND bil | 726 | 8,875 | 832 | 8,899 | 505 | |||||||||||||||||||||||||||||||||||||||||||||||||
| ratios | |||||||||||||||||||||||||||||||||||||||||||||||||||||||
| ROE | % | ... | 4.75 | 2.75 | 13.2 | 13.5 | -2.34 | ||||||||||||||||||||||||||||||||||||||||||||||||
| ROA | % | ... | 0.288 | 0.162 | 0.788 | 0.813 | -0.138 | ||||||||||||||||||||||||||||||||||||||||||||||||
| Costs (As % Of Assets) | % | ... | ... | ... | ... | ... | 1.80 | 1.95 | 2.34 | 1.97 | 2.12 | ||||||||||||||||||||||||||||||||||||||||||||
| Costs (As % Of Income) | % | ... | ... | ... | ... | ... | 62.5 | 61.0 | 59.2 | 53.0 | 74.4 | ||||||||||||||||||||||||||||||||||||||||||||
| Net Interest Margin | % | ... | 1.82 | 2.06 | 2.09 | 2.37 | 1.87 | ||||||||||||||||||||||||||||||||||||||||||||||||
| Interest Income (As % Of Revenues) | % | 63.4 | 64.3 | 52.6 | 63.6 | 65.8 | |||||||||||||||||||||||||||||||||||||||||||||||||
| Fee Income (As % Of Revenues) | % | ... | ... | ... | ... | ... | ... | ... | ... | ... | ... | 21.0 | 19.5 | 23.0 | 16.6 | 24.1 | |||||||||||||||||||||||||||||||||||||||
| Staff Cost (As % Of Total Cost) | % | ... | ... | ... | ... | ... | ... | ... | ... | ... | ... | ... | ... | 64.7 | 62.1 | 61.5 | 56.6 | 58.9 | |||||||||||||||||||||||||||||||||||||
| Equity (As % Of Assets) | % | 5.90 | 5.89 | 6.07 | 5.99 | 5.81 | |||||||||||||||||||||||||||||||||||||||||||||||||
| Loans (As % Of Deposits) | % | 66.9 | 69.9 | 70.8 | 70.8 | 69.3 | |||||||||||||||||||||||||||||||||||||||||||||||||
| Loans (As % Assets) | % | 60.8 | 61.8 | 62.3 | 62.9 | 62.7 | |||||||||||||||||||||||||||||||||||||||||||||||||
| NPLs (As % Of Loans) | % | ... | ... | ... | ... | ... | ... | ... | ... | ... | ... | ... | 3.70 | 3.18 | 2.13 | 2.14 | 2.04 | ||||||||||||||||||||||||||||||||||||||
| Provisions (As % Of NPLs) | % | ... | ... | ... | ... | ... | ... | ... | ... | ... | ... | ... | 34.3 | 47.7 | 64.5 | 65.3 | 68.5 | ||||||||||||||||||||||||||||||||||||||
| valuation | |||||||||||||||||||||||||||||||||||||||||||||||||||||||
| Market Capitalisation (End Of Period) | USD mil | ... | 908 | 1,044 | 929 | 948 | 878 | ||||||||||||||||||||||||||||||||||||||||||||||||
| Number Of Shares (Average) | mil | ... | ... | ... | ... | ... | ... | ... | ... | ... | ... | ... | 1,804 | 1,804 | 1,804 | 1,804 | 1,804 | ||||||||||||||||||||||||||||||||||||||
| Share Price (End Of Period) | VND | 11,550 | 13,500 | 11,950 | 12,200 | 11,350 | |||||||||||||||||||||||||||||||||||||||||||||||||
| Earnings Per Share (EPS) | VND | ... | ... | ... | ... | ... | ... | ... | ... | ... | ... | ... | 623 | 362 | 1,770 | 1,872 | -331 | ||||||||||||||||||||||||||||||||||||||
| Book Value Per Share | VND | ... | ... | ... | ... | ... | ... | ... | ... | ... | ... | ... | 13,112 | 13,185 | 13,657 | 14,125 | 14,137 | ||||||||||||||||||||||||||||||||||||||
| Dividend Per Share | VND | ... | ... | ... | ... | ... | ... | ... | ... | ... | ... | ... | ... | ... | ... | ... | ... | ... | ... | ... | ... | ... | ... | ... | ... | ... | ... | ... | ... | ... | ... | ... | ... | ... | ... | ... | ... | ... | ... | ... | |||||||||||||||
| Price/Earnings (P/E) | ... | ... | ... | ... | ... | ... | ... | ... | ... | ... | ... | 18.5 | 37.3 | 6.75 | 6.52 | -34.3 | |||||||||||||||||||||||||||||||||||||||
| Price/Book Value (P/BV) | ... | ... | ... | ... | ... | ... | ... | ... | ... | ... | ... | 0.881 | 1.02 | 0.875 | 0.864 | 0.803 | |||||||||||||||||||||||||||||||||||||||
| Dividend Yield | % | ... | ... | ... | ... | ... | ... | ... | ... | ... | ... | ... | ... | ... | ... | ... | ... | ... | ... | ... | ... | ... | ... | ... | ... | ... | ... | ... | ... | ... | ... | ... | ... | ... | ... | ... | ... | ... | ... | ... | |||||||||||||||
| Earnings Per Share Growth | % | ... | ... | ... | ... | ... | ... | ... | ... | ... | ... | ... | ... | ... | ... | ... | ... | ... | 10.9 | -46.9 | 97.0 | 113 | -153 | ||||||||||||||||||||||||||||||||
| Book Value Per Share Growth | % | ... | ... | ... | ... | 5.18 | 4.38 | 6.01 | 7.63 | 7.82 |
| income statement | Unit | Sep 2006 | Dec 2006 | Mar 2007 | Jun 2007 | Sep 2007 | Dec 2007 | Mar 2008 | Jun 2008 | Sep 2008 | Dec 2008 | Mar 2009 | Jun 2009 | Sep 2009 | Dec 2009 | Mar 2010 | Jun 2010 | Sep 2010 | Dec 2010 | Mar 2011 | Jun 2011 | Sep 2011 | Dec 2011 | Mar 2012 | Jun 2012 | Sep 2012 | Dec 2012 | Mar 2013 | Jun 2013 | Sep 2013 | Dec 2013 | Mar 2014 | Jun 2014 | Sep 2014 | Dec 2014 | Mar 2015 | Jun 2015 | Sep 2015 | Dec 2015 | Mar 2016 | Jun 2016 | Sep 2016 | Dec 2016 | Mar 2017 | Jun 2017 | Sep 2017 | Dec 2017 | Mar 2018 | Jun 2018 | Sep 2018 | Dec 2018 | Mar 2019 | Jun 2019 | Sep 2019 | Dec 2019 |
| income statement | |||||||||||||||||||||||||||||||||||||||||||||||||||||||
| Interest Income | VND bil | 6,386 | 6,912 | 6,954 | 7,354 | 7,301 | |||||||||||||||||||||||||||||||||||||||||||||||||
| Interest Cost | VND bil | 4,604 | 4,840 | 4,844 | 4,893 | 5,278 | |||||||||||||||||||||||||||||||||||||||||||||||||
| Net Interest Income | VND bil | 1,783 | 2,071 | 2,111 | 2,460 | 2,023 | |||||||||||||||||||||||||||||||||||||||||||||||||
| Net Fee Income | VND bil | ... | ... | ... | ... | ... | ... | ... | ... | ... | ... | 589 | 626 | 922 | 642 | 742 | |||||||||||||||||||||||||||||||||||||||
| Other Income | VND bil | ... | ... | ... | ... | ... | ... | ... | ... | ... | ... | 441 | 523 | 978 | 768 | 311 | |||||||||||||||||||||||||||||||||||||||
| Total Revenues | VND bil | 2,813 | 3,220 | 4,010 | 3,871 | 3,076 | |||||||||||||||||||||||||||||||||||||||||||||||||
| Staff Cost | VND bil | ... | ... | ... | ... | ... | ... | ... | ... | ... | ... | ... | ... | 1,138 | 1,221 | 1,460 | 1,162 | 1,348 | |||||||||||||||||||||||||||||||||||||
| Depreciation | VND bil | ... | ... | ... | ... | ... | ... | ... | ... | ... | ... | ... | ... | ... | ... | ... | ... | ... | ... | ... | ... | ... | ... | ... | ... | ... | ... | ... | ... | ... | 99.0 | 99.0 | 99.0 | 100 | 100 | ||||||||||||||||||||
| Other Cost | VND bil | ... | ... | ... | ... | ... | ... | ... | ... | ... | ... | ... | ... | ... | ... | ... | ... | ... | ... | ... | ... | ... | ... | ... | ... | ... | ... | ... | ... | ... | 522 | 645 | 814 | 790 | 842 | ||||||||||||||||||||
| Operating Cost | VND bil | ... | ... | ... | ... | ... | 1,758 | 1,965 | 2,373 | 2,052 | 2,290 | ||||||||||||||||||||||||||||||||||||||||||||
| Operating Profit | VND bil | ... | ... | ... | ... | ... | 1,055 | 1,255 | 1,637 | 1,819 | 786 | ||||||||||||||||||||||||||||||||||||||||||||
| Provisions | VND bil | ... | ... | ... | ... | ... | ... | 433 | 664 | 414 | 430 | 616 | |||||||||||||||||||||||||||||||||||||||||||
| Extra and Other Cost | VND bil | ... | ... | ... | ... | ... | ... | 242 | 273 | 367 | 328 | 341 | |||||||||||||||||||||||||||||||||||||||||||
| Pre-Tax Profit | VND bil | 380 | 318 | 856 | 1,061 | -171 | |||||||||||||||||||||||||||||||||||||||||||||||||
| Tax | VND bil | 98.5 | 155 | 58.3 | 217 | -21.5 | |||||||||||||||||||||||||||||||||||||||||||||||||
| Minorities | VND bil | ... | ... | ... | ... | ... | ... | ... | ... | 0 | 0 | 0 | 0 | 0 | |||||||||||||||||||||||||||||||||||||||||
| Net Profit | VND bil | 281 | 163 | 798 | 844 | -149 | |||||||||||||||||||||||||||||||||||||||||||||||||
| Dividends | VND bil | ... | ... | ... | ... | ... | ... | ... | ... | ... | ... | ... | ... | ... | ... | ... | ... | ... | ... | ... | ... | ... | ... | ... | ... | ... | ... | ... | ... | ... | ... | ... | ... | ... | ... | ... | ... | ... | ... | ... | |||||||||||||||
| growth rates | |||||||||||||||||||||||||||||||||||||||||||||||||||||||
| Net Interest Income Growth | % | ... | ... | ... | ... | 74.3 | 29.7 | 30.1 | 47.2 | 13.5 | |||||||||||||||||||||||||||||||||||||||||||||
| Net Fee Income Growth | % | ... | ... | ... | ... | ... | ... | ... | ... | ... | ... | ... | ... | ... | ... | 29.0 | 37.5 | -30.6 | 18.0 | 25.8 | |||||||||||||||||||||||||||||||||||
| Total Revenue Growth | % | ... | ... | ... | ... | 51.6 | 31.6 | 22.4 | 51.6 | 9.36 | |||||||||||||||||||||||||||||||||||||||||||||
| Operating Cost Growth | % | ... | ... | ... | ... | ... | ... | ... | ... | ... | ... | 32.7 | 19.0 | 19.2 | 16.5 | 30.2 | |||||||||||||||||||||||||||||||||||||||
| Operating Profit Growth | % | ... | ... | ... | ... | ... | ... | ... | ... | ... | ... | 98.6 | 57.6 | 27.3 | 130 | -25.5 | |||||||||||||||||||||||||||||||||||||||
| Pre-Tax Profit Growth | % | ... | ... | ... | ... | 42.5 | -29.2 | 86.3 | 111 | -145 | |||||||||||||||||||||||||||||||||||||||||||||
| Net Profit Growth | % | ... | ... | ... | ... | 10.9 | -46.9 | 97.0 | 113 | -153 |
| balance sheet | Unit | Sep 2006 | Dec 2006 | Mar 2007 | Jun 2007 | Sep 2007 | Dec 2007 | Mar 2008 | Jun 2008 | Sep 2008 | Dec 2008 | Mar 2009 | Jun 2009 | Sep 2009 | Dec 2009 | Mar 2010 | Jun 2010 | Sep 2010 | Dec 2010 | Mar 2011 | Jun 2011 | Sep 2011 | Dec 2011 | Mar 2012 | Jun 2012 | Sep 2012 | Dec 2012 | Mar 2013 | Jun 2013 | Sep 2013 | Dec 2013 | Mar 2014 | Jun 2014 | Sep 2014 | Dec 2014 | Mar 2015 | Jun 2015 | Sep 2015 | Dec 2015 | Mar 2016 | Jun 2016 | Sep 2016 | Dec 2016 | Mar 2017 | Jun 2017 | Sep 2017 | Dec 2017 | Mar 2018 | Jun 2018 | Sep 2018 | Dec 2018 | Mar 2019 | Jun 2019 | Sep 2019 | Dec 2019 |
| balance sheet | |||||||||||||||||||||||||||||||||||||||||||||||||||||||
| Cash | VND bil | 17,554 | 19,725 | 15,991 | 20,137 | 19,590 | |||||||||||||||||||||||||||||||||||||||||||||||||
| Interbank Loans | VND bil | ... | ... | ... | ... | 6,813 | 1,856 | 4,822 | 9,531 | 16,970 | |||||||||||||||||||||||||||||||||||||||||||||
| Customer Loans | VND bil | 243,565 | 249,548 | 253,100 | 267,226 | 275,512 | |||||||||||||||||||||||||||||||||||||||||||||||||
| Retail Loans | VND bil | ... | ... | ... | ... | ... | ... | ... | ... | ... | ... | ... | ... | ... | ... | ... | ... | ... | ... | ... | ... | ... | ... | ... | ... | ... | ... | ... | ... | ... | ... | ... | ... | ... | ... | ... | ... | 147,216 | ... | 156,251 | ... | 170,996 | ... | ... | |||||||||||
| Corporate Loans | VND bil | ... | ... | ... | ... | ... | ... | ... | ... | ... | ... | ... | ... | ... | ... | ... | ... | ... | ... | ... | ... | ... | ... | ... | ... | ... | ... | ... | ... | ... | ... | ... | ... | ... | ... | ... | ... | 98,495 | ... | 99,447 | ... | 107,513 | ... | ... | |||||||||||
| Debt Securities | VND bil | ... | ... | 79,097 | 78,818 | 76,202 | 75,348 | 75,241 | |||||||||||||||||||||||||||||||||||||||||||||||
| Fixed Assets | VND bil | 7,956 | 4,500 | 8,033 | 4,662 | 7,809 | |||||||||||||||||||||||||||||||||||||||||||||||||
| Total Assets | VND bil | 400,686 | 403,602 | 406,041 | 425,033 | 439,170 | |||||||||||||||||||||||||||||||||||||||||||||||||
| Shareholders' Equity | VND bil | 23,649 | 23,781 | 24,632 | 25,477 | 25,499 | |||||||||||||||||||||||||||||||||||||||||||||||||
| Of Which Minority Interest | VND bil | 0 | 0 | 0 | 0 | 0 | |||||||||||||||||||||||||||||||||||||||||||||||||
| Liabilities | VND bil | 377,038 | 379,822 | 381,408 | 399,556 | 413,671 | |||||||||||||||||||||||||||||||||||||||||||||||||
| Interbank Borrowing | VND bil | 3,553 | 3,984 | 11,849 | 2,711 | 2,843 | |||||||||||||||||||||||||||||||||||||||||||||||||
| Customer Deposits | VND bil | 364,046 | 357,220 | 357,455 | 377,223 | 397,801 | |||||||||||||||||||||||||||||||||||||||||||||||||
| Sight Deposits | VND bil | ... | ... | ... | ... | ... | ... | 51,000 | 51,993 | 51,279 | 56,658 | 58,932 | |||||||||||||||||||||||||||||||||||||||||||
| Term Deposits | VND bil | ... | ... | ... | ... | ... | ... | 312,270 | 304,389 | 305,221 | 319,131 | 337,792 | |||||||||||||||||||||||||||||||||||||||||||
| Issued Debt Securities | VND bil | 726 | 8,875 | 832 | 8,899 | 505 | |||||||||||||||||||||||||||||||||||||||||||||||||
| Other Liabilities | VND bil | ... | ... | ... | ... | ... | ... | ... | ... | ... | ... | ... | ... | ... | ... | ... | ... | ... | ... | ... | ... | ... | ... | ... | ... | ... | ... | ... | ... | ... | ... | ... | ... | ... | ... | ... | ... | ... | ... | ... | ... | ... | ... | ... | ... | ... | ... | ... | ... | ... | ... | ... | ... | ||
| asset quality | |||||||||||||||||||||||||||||||||||||||||||||||||||||||
| Non-Performing Loans | VND bil | ... | ... | ... | ... | ... | ... | ... | ... | ... | 9,121 | 8,066 | 5,463 | 5,811 | 5,703 | ||||||||||||||||||||||||||||||||||||||||
| Gross Loans | VND bil | ... | ... | ... | ... | ... | ... | ... | ... | ... | ... | ... | 246,691 | 253,392 | 256,623 | 271,020 | 279,420 | ||||||||||||||||||||||||||||||||||||||
| Total Provisions | VND bil | ... | ... | ... | ... | ... | ... | ... | ... | ... | ... | ... | 3,126 | 3,844 | 3,523 | 3,794 | 3,908 | ||||||||||||||||||||||||||||||||||||||
| growth rates | |||||||||||||||||||||||||||||||||||||||||||||||||||||||
| Customer Loan Growth | % | ... | ... | ... | ... | 12.7 | 13.2 | 14.9 | 17.9 | 13.1 | |||||||||||||||||||||||||||||||||||||||||||||
| Retail Loan Growth | % | ... | ... | ... | ... | ... | ... | ... | ... | ... | ... | ... | ... | ... | ... | ... | ... | ... | ... | ... | ... | ... | ... | ... | ... | ... | ... | ... | ... | ... | ... | ... | ... | ... | ... | ... | ... | ... | ... | ... | 21.4 | ... | 19.4 | ... | 16.2 | ... | ... | ||||||||
| Corporate Loan Growth | % | ... | ... | ... | ... | ... | ... | ... | ... | ... | ... | ... | ... | ... | ... | ... | ... | ... | ... | ... | ... | ... | ... | ... | ... | ... | ... | ... | ... | ... | ... | ... | ... | ... | ... | ... | ... | ... | ... | ... | 2.05 | ... | 8.99 | ... | 9.16 | ... | ... | ||||||||
| Total Asset Growth | % | ... | ... | ... | ... | 12.6 | 11.0 | 10.2 | 11.5 | 9.60 | |||||||||||||||||||||||||||||||||||||||||||||
| Shareholders' Equity Growth | % | ... | ... | ... | ... | 5.18 | 4.38 | 6.01 | 7.63 | 7.82 | |||||||||||||||||||||||||||||||||||||||||||||
| Customer Deposit Growth | % | ... | ... | ... | ... | 14.7 | 14.3 | 11.8 | 11.2 | 9.27 | |||||||||||||||||||||||||||||||||||||||||||||
| market share | |||||||||||||||||||||||||||||||||||||||||||||||||||||||
| Market Share in Customer Loans | % | ... | ... | ... | ... | ... | ... | ... | ... | ... | ... | ... | ... | ... | ... | ... | ... | ... | ... | ... | ... | ... | ... | ... | ... | ... | ... | ... | ... | ... | ... | ... | ... | ... | ... | ... | ... | ... | ... | ... | ... | ... | ... | ... | ... | ... | ... | ||||||||
| Market Share in Total Assets | % | ... | ... | ... | ... | ... | ... | ... | ... | ... | ... | ... | ... | ... | ... | ... | ... | ... | ... | ... | ... | ... | ... | ... | ... | ... | ... | ... | ... | ... | ... | ... | ... | ... | ... | ... | ... | ... | |||||||||||||||||
| Market Share in Customer Deposits | % | ... | ... | ... | ... | ... | ... | ... | ... | ... | ... | ... | ... | ... | ... | ... | ... | ... | ... | ... | ... | ... | ... | ... | ... | ... | ... | ... | ... | ... | ... | ... | ... | ... | ... | ... | ... | ... | ... | ... | ... | ... | ... | ... | ... | ... | ... |
| ratios | Unit | Sep 2006 | Dec 2006 | Mar 2007 | Jun 2007 | Sep 2007 | Dec 2007 | Mar 2008 | Jun 2008 | Sep 2008 | Dec 2008 | Mar 2009 | Jun 2009 | Sep 2009 | Dec 2009 | Mar 2010 | Jun 2010 | Sep 2010 | Dec 2010 | Mar 2011 | Jun 2011 | Sep 2011 | Dec 2011 | Mar 2012 | Jun 2012 | Sep 2012 | Dec 2012 | Mar 2013 | Jun 2013 | Sep 2013 | Dec 2013 | Mar 2014 | Jun 2014 | Sep 2014 | Dec 2014 | Mar 2015 | Jun 2015 | Sep 2015 | Dec 2015 | Mar 2016 | Jun 2016 | Sep 2016 | Dec 2016 | Mar 2017 | Jun 2017 | Sep 2017 | Dec 2017 | Mar 2018 | Jun 2018 | Sep 2018 | Dec 2018 | Mar 2019 | Jun 2019 | Sep 2019 | Dec 2019 |
| ratios | |||||||||||||||||||||||||||||||||||||||||||||||||||||||
| ROE | % | ... | 4.75 | 2.75 | 13.2 | 13.5 | -2.34 | ||||||||||||||||||||||||||||||||||||||||||||||||
| ROA | % | ... | 0.288 | 0.162 | 0.788 | 0.813 | -0.138 | ||||||||||||||||||||||||||||||||||||||||||||||||
| Costs (As % Of Assets) | % | ... | ... | ... | ... | ... | 1.80 | 1.95 | 2.34 | 1.97 | 2.12 | ||||||||||||||||||||||||||||||||||||||||||||
| Costs (As % Of Income) | % | ... | ... | ... | ... | ... | 62.5 | 61.0 | 59.2 | 53.0 | 74.4 | ||||||||||||||||||||||||||||||||||||||||||||
| Net Interest Margin | % | ... | 1.82 | 2.06 | 2.09 | 2.37 | 1.87 | ||||||||||||||||||||||||||||||||||||||||||||||||
| Interest Spread | % | ... | 1.52 | 1.76 | 1.78 | 2.07 | 1.57 | ||||||||||||||||||||||||||||||||||||||||||||||||
| Asset Yield | % | ... | 6.53 | 6.87 | 6.87 | 7.08 | 6.76 | ||||||||||||||||||||||||||||||||||||||||||||||||
| Cost Of Liabilities | % | ... | 5.01 | 5.12 | 5.09 | 5.01 | 5.19 | ||||||||||||||||||||||||||||||||||||||||||||||||
| Payout Ratio | % | ... | ... | ... | ... | ... | ... | ... | ... | ... | ... | ... | ... | ... | ... | ... | ... | ... | ... | ... | ... | ... | ... | ... | ... | ... | ... | ... | ... | ... | ... | ... | ... | ... | ... | ... | ... | ... | ... | ... | ... | ... | ... | ... | ... | ... | ... | ... | ... | ||||||
| Interest Income (As % Of Revenues) | % | 63.4 | 64.3 | 52.6 | 63.6 | 65.8 | |||||||||||||||||||||||||||||||||||||||||||||||||
| Fee Income (As % Of Revenues) | % | ... | ... | ... | ... | ... | ... | ... | ... | ... | ... | 21.0 | 19.5 | 23.0 | 16.6 | 24.1 | |||||||||||||||||||||||||||||||||||||||
| Other Income (As % Of Revenues) | % | ... | ... | ... | ... | ... | ... | ... | ... | ... | ... | 15.7 | 16.2 | 24.4 | 19.8 | 10.1 | |||||||||||||||||||||||||||||||||||||||
| Cost Per Employee | USD per month | ... | ... | ... | ... | ... | ... | ... | ... | ... | ... | ... | ... | ... | ... | ... | ... | ... | ... | ... | ... | ... | ... | 908 | 965 | 1,136 | 900 | 1,026 | |||||||||||||||||||||||||||
| Cost Per Employee (Local Currency) | VND per month | ... | ... | ... | ... | ... | ... | ... | ... | ... | ... | ... | ... | ... | ... | ... | ... | ... | ... | ... | ... | ... | ... | 20,482,200 | 21,890,300 | 25,858,800 | 20,603,400 | 23,621,500 | |||||||||||||||||||||||||||
| Staff Cost (As % Of Total Cost) | % | ... | ... | ... | ... | ... | ... | ... | ... | ... | ... | ... | ... | 64.7 | 62.1 | 61.5 | 56.6 | 58.9 | |||||||||||||||||||||||||||||||||||||
| Equity (As % Of Assets) | % | 5.90 | 5.89 | 6.07 | 5.99 | 5.81 | |||||||||||||||||||||||||||||||||||||||||||||||||
| Loans (As % Of Deposits) | % | 66.9 | 69.9 | 70.8 | 70.8 | 69.3 | |||||||||||||||||||||||||||||||||||||||||||||||||
| Loans (As % Assets) | % | 60.8 | 61.8 | 62.3 | 62.9 | 62.7 | |||||||||||||||||||||||||||||||||||||||||||||||||
| NPLs (As % Of Loans) | % | ... | ... | ... | ... | ... | ... | ... | ... | ... | ... | ... | 3.70 | 3.18 | 2.13 | 2.14 | 2.04 | ||||||||||||||||||||||||||||||||||||||
| Provisions (As % Of NPLs) | % | ... | ... | ... | ... | ... | ... | ... | ... | ... | ... | ... | 34.3 | 47.7 | 64.5 | 65.3 | 68.5 | ||||||||||||||||||||||||||||||||||||||
| Provisions (As % Of Loans) | % | ... | ... | ... | ... | ... | ... | ... | ... | ... | ... | ... | 1.28 | 1.54 | 1.39 | 1.42 | 1.42 | ||||||||||||||||||||||||||||||||||||||
| Cost of Provisions (As % Of Loans) | % | ... | ... | ... | ... | ... | ... | 0.737 | 1.08 | 0.658 | 0.661 | 0.908 |
| other data | Unit | Sep 2006 | Dec 2006 | Mar 2007 | Jun 2007 | Sep 2007 | Dec 2007 | Mar 2008 | Jun 2008 | Sep 2008 | Dec 2008 | Mar 2009 | Jun 2009 | Sep 2009 | Dec 2009 | Mar 2010 | Jun 2010 | Sep 2010 | Dec 2010 | Mar 2011 | Jun 2011 | Sep 2011 | Dec 2011 | Mar 2012 | Jun 2012 | Sep 2012 | Dec 2012 | Mar 2013 | Jun 2013 | Sep 2013 | Dec 2013 | Mar 2014 | Jun 2014 | Sep 2014 | Dec 2014 | Mar 2015 | Jun 2015 | Sep 2015 | Dec 2015 | Mar 2016 | Jun 2016 | Sep 2016 | Dec 2016 | Mar 2017 | Jun 2017 | Sep 2017 | Dec 2017 | Mar 2018 | Jun 2018 | Sep 2018 | Dec 2018 | Mar 2019 | Jun 2019 | Sep 2019 | Dec 2019 |
| other data | |||||||||||||||||||||||||||||||||||||||||||||||||||||||
| Employees | ... | ... | ... | ... | ... | ... | ... | ... | ... | ... | ... | ... | ... | ... | ... | ... | ... | ... | ... | 18,512 | 18,596 | 18,818 | 18,793 | 19,023 | |||||||||||||||||||||||||||||||
| Sight (As % Of Customer Deposits) | % | ... | ... | ... | ... | ... | ... | 14.0 | 14.6 | 14.3 | 15.0 | 14.8 | |||||||||||||||||||||||||||||||||||||||||||
| Return on Loans | % | ... | 0.591 | 0.505 | 0.652 | 0.802 | 0.610 | ||||||||||||||||||||||||||||||||||||||||||||||||
| Operating Profit (As % of Loans) | % | ... | ... | ... | ... | ... | ... | ... | ... | ... | 1.67 | 1.78 | 1.89 | 2.22 | 2.03 | ||||||||||||||||||||||||||||||||||||||||
| Costs (As % Of Loans) | % | ... | ... | ... | ... | ... | 3.14 | 3.18 | 3.23 | 3.22 | 3.32 | ||||||||||||||||||||||||||||||||||||||||||||
| Equity (As % Of Loans) | % | 9.71 | 9.53 | 9.73 | 9.53 | 9.26 |
Get all company financials in excel:


By Helgi Library - March 1, 2020
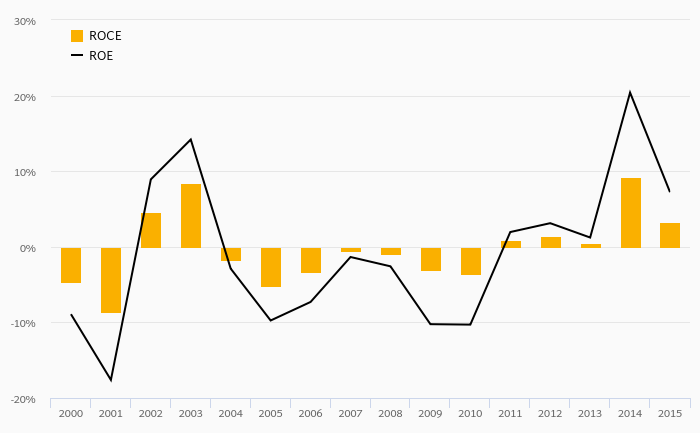
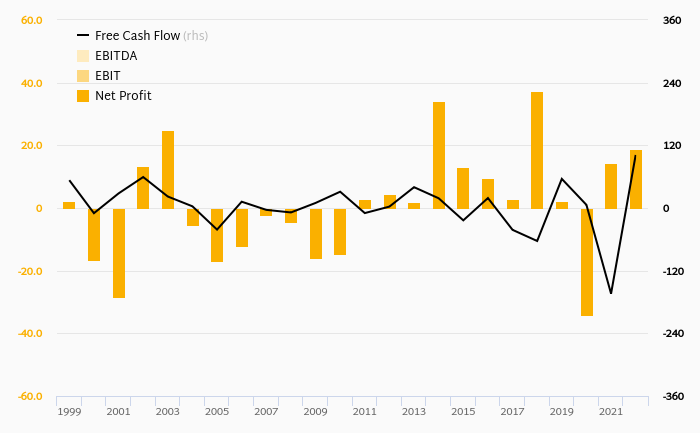
Sacombank made a net profit of VND 532 bil in the fourth quarter of 2019, down 33.4% when compared to the same period of last year. This implies a return on equity of 8.03%. Historically, the bank’s net profit reached an all time high of VND 844 bil in 1Q2019 and...
By Helgi Library - March 1, 2020
Sacombank stock traded at VND 10,050 per share at the end fourth quarter of 2019 implying a market capitalization of USD 782 mil. Since the end of 4Q2014, the stock has depreciated by -27.4 % implying an annual average growth of -6.21 %. In absolute terms, the value o...
By Helgi Library - March 1, 2020
Sacombank stock traded at VND 10,050 per share at the end of fourth quarter of 2019 implying a market capitalization of USD 782 mil. Over the last five years, the stock has depreciated by 27.4 implying an annual average growth of -6.21% In absolute terms,...
By Helgi Library - March 1, 2020
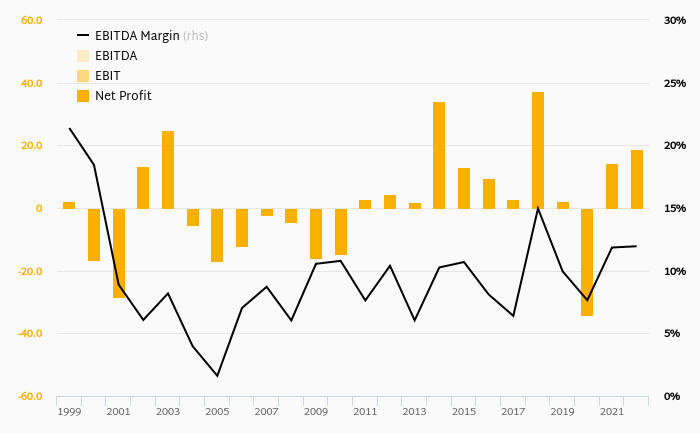
Sacombank generated total banking revenues of VND 4,216 bil in the fourth quarter of 2019, up 5.14% when compared to the same period of last year and down 5.18% when compared to the previous quarter. Historically, the bank’s revenues containing of...
By Helgi Library - March 1, 2020
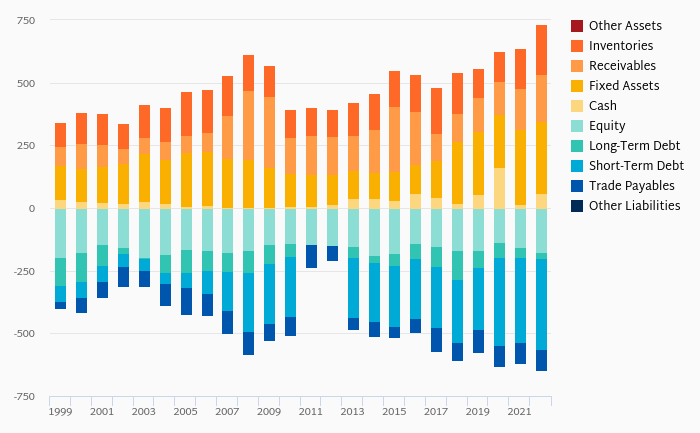
Sacombank's Equity reached 5.90% of total assets in the 4Q2019, down from 6.07% for the previous year. As a share of net customer loans, the ratio amounted to 9.16% at the end of the fourth quarter of 2019. ...
By Helgi Library - March 1, 2020
Sacombank's customer loan growth reached 15.4% in 2019-12-31, up from 14.9% compared to the previous year. Historically, the bank’s loans growth reached an all time high of 147% in 2008-03-31 and an all time low of -4.39% in 2009-03-31. In the last decade...
By Helgi Library - March 1, 2020
Sacombank made a net profit of VND 1,998 bil under revenues of VND 15,610 bil in 2019, up 21.9% and 23.9% respectively compared to the previous year. Historically, the bank’s net profit reached an all time high of VND 2,229 bil in 2013 and an all time low of VND 88.6...
By Helgi Library - March 1, 2020
Sacombank's non-performing loans reached 1.94% of total loans at the end of 2019, down from 2.13% compared to the previous year. Historically, the NPL ratio hit an all time high of 6.91% in 2016 and an all time low of 0.230% in 2007. Provision coverage amou...
By Helgi Library - March 1, 2020
Sacombank generated total banking revenues of VND 15,610 bil in 2019, up 23.9% compared to the previous year. Historically, the bank’s revenues containing of interest, fee and other non-interest income reached an all time high of VND 15,610 bil in 2019 and an a...
By Helgi Library - March 1, 2020
Sacombank stock traded at VND 10,050 per share at the end 2019 implying a market capitalization of USD 782 mil. Since the end of 2014, the stock has depreciated by -27.4 % implying an annual average growth of -6.21 %. In absolute terms, the value of the company f...

 Helgi Library