By Helgi Library - October 15, 2019
Shriram City Union Finance made a net profit of INR 9,890 mil under revenues of INR 38,020 mil in 2018, up 39.1% and 8.78% respective...
By Helgi Library - October 15, 2019
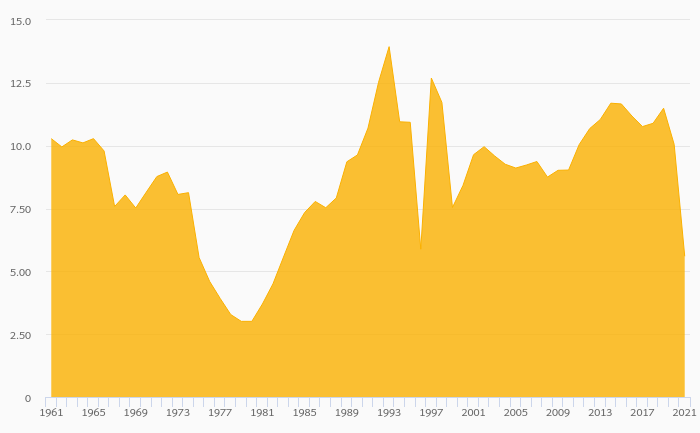
Shriram City Union Finance's non-performing loans reached 9.13% of total loans at the end of 2018, down from 9.41% compared to th...
By Helgi Library - October 15, 2019
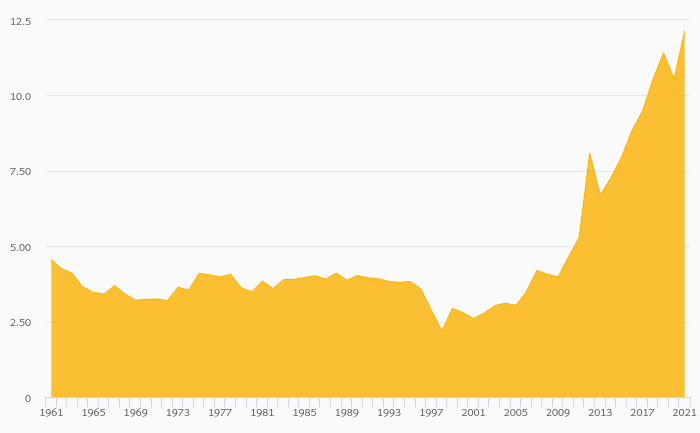
Shriram City Union Finance's capital adequacy ratio reached 23.1% at the end of 2018, up from 21.4% compared to the previous year...
| Profit Statement | 2016 | 2017 | 2018 | |
| Net Interest Income | INR mil | 28,980 | 34,930 | 37,990 |
| Other Income | INR mil | 30.0 | 20.0 | 30.0 |
| Total Revenues | INR mil | 29,010 | 34,950 | 38,020 |
| Staff Cost | INR mil | 5,500 | 7,060 | 8,390 |
| Operating Profit | INR mil | 17,650 | 21,130 | 23,020 |
| Provisions | INR mil | 9,110 | 10,230 | 7,820 |
| Net Profit | INR mil | 5,560 | 7,110 | 9,890 |
| Balance Sheet | 2016 | 2017 | 2018 | |
| Interbank Loans | INR mil | 270 | 206 | 133 |
| Customer Loans | INR mil | 231,320 | 275,820 | 295,820 |
| Total Assets | INR mil | 262,967 | 307,791 | 314,183 |
| Shareholders' Equity | INR mil | 50,250 | 55,550 | 63,910 |
| Interbank Borrowing | INR mil | ... | ... | ... |
| Customer Deposits | INR mil | 170,420 | 214,010 | 225,710 |
| Issued Debt Securities | INR mil | ... | ... | ... |
| Ratios | 2016 | 2017 | 2018 | |
| ROE | % | 11.7 | 13.4 | 16.6 |
| ROA | % | 2.30 | 2.49 | 3.18 |
| Costs (As % Of Assets) | % | 4.70 | 4.84 | 4.82 |
| Costs (As % Of Income) | % | 39.2 | 39.5 | 39.5 |
| Capital Adequacy Ratio | % | 23.9 | 21.4 | 23.1 |
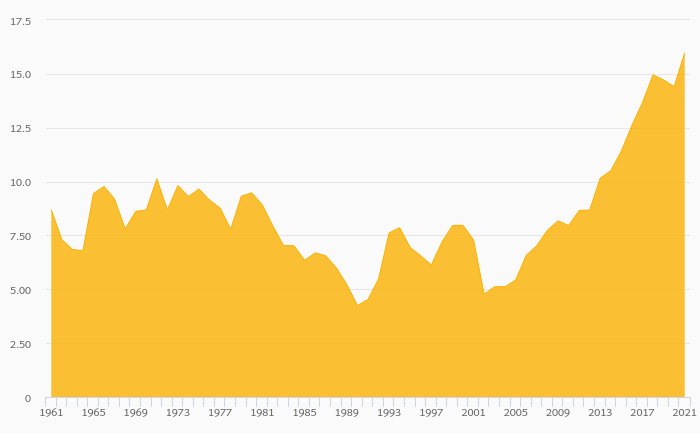
| Net Interest Margin | % | 12.0 | 12.2 | 12.2 |
| Loans (As % Of Deposits) | % | 136 | 129 | 131 |
| NPLs (As % Of Loans) | % | 6.34 | 9.41 | 9.13 |
| Provisions (As % Of NPLs) | % | 73.3 | 69.1 | 74.7 |
| Growth Rates | 2016 | 2017 | 2018 | |
| Total Revenue Growth | % | 17.4 | 20.5 | 8.78 |
| Operating Cost Growth | % | 8.29 | 21.7 | 8.54 |
| Operating Profit Growth | % | 24.0 | 19.7 | 8.94 |
| Net Profit Growth | % | 4.91 | 27.9 | 39.1 |
| Customer Loan Growth | % | 18.2 | 19.2 | 7.25 |
| Total Asset Growth | % | 19.1 | 17.0 | 2.08 |
| Customer Deposit Growth | % | 18.3 | 25.6 | 5.47 |
| Shareholders' Equity Growth | % | 11.5 | 10.5 | 15.0 |
Get all company financials in excel:
| summary | Unit | 2012 | 2013 | 2014 | 2015 | 2016 | 2017 | 2018 |
| income statement | ||||||||
| Net Interest Income | INR mil | 16,610 | 18,230 | 21,550 | 24,510 | 28,980 | ||
| Total Revenues | INR mil | 16,610 | 18,230 | 22,040 | 24,720 | 29,010 | ||
| Operating Profit | INR mil | 10,380 | 10,990 | 12,940 | 14,230 | 17,650 | ||
| Net Profit | INR mil | 4,500 | 5,210 | 5,580 | 5,300 | 5,560 | ||
| balance sheet | ||||||||
| Interbank Loans | INR mil | ... | ... | 1,187 | 746 | 270 | ||
| Customer Loans | INR mil | 158,280 | 146,680 | 167,170 | 195,750 | 231,320 | ||
| Debt Securities | INR mil | ... | ... | 834 | 872 | 832 | ||
| Total Assets | INR mil | ... | ... | 186,563 | 220,731 | 262,967 | ||
| Shareholders' Equity | INR mil | ... | ... | 40,870 | 45,050 | 50,250 | ||
| Interbank Borrowing | INR mil | 73,560 | 64,960 | ... | ... | ... | ... | ... |
| Customer Deposits | INR mil | 42,640 | 47,750 | 124,020 | 144,080 | 170,420 | ||
| Issued Debt Securities | INR mil | 11,080 | 7,860 | ... | ... | ... | ... | ... |
| ratios | ||||||||
| ROE | % | ... | ... | 13.7 | 12.3 | 11.7 | ||
| ROA | % | ... | ... | 2.99 | 2.60 | 2.30 | ||
| Costs (As % Of Assets) | % | ... | ... | 4.88 | 5.15 | 4.70 | ||
| Costs (As % Of Income) | % | 37.5 | 39.7 | 41.3 | 42.4 | 39.2 | ||
| Capital Adequacy Ratio | % | 18.6 | 26.1 | 28.8 | 26.1 | 23.9 | ||
| Net Interest Margin | % | ... | ... | 11.6 | 12.0 | 12.0 | ||
| Interest Income (As % Of Revenues) | % | 100 | 100 | 97.8 | 99.2 | 99.9 | ||
| Staff Cost (As % Of Total Cost) | % | 36.0 | 37.4 | 45.3 | 48.9 | 48.4 | ||
| Equity (As % Of Assets) | % | ... | ... | 21.9 | 20.4 | 19.1 | ||
| Loans (As % Of Deposits) | % | 371 | 307 | 135 | 136 | 136 | ||
| Loans (As % Assets) | % | ... | ... | 89.6 | 88.7 | 88.0 | ||
| NPLs (As % Of Loans) | % | 1.84 | 2.28 | 2.87 | 4.84 | 6.34 | ||
| Provisions (As % Of NPLs) | % | 63.6 | 77.6 | 78.4 | 69.7 | 73.3 | ||
| valuation | ||||||||
| Number Of Shares (Average) | mil | ... | ... | 64.9 | 66.0 | 66.0 | ||
| Earnings Per Share (EPS) | ... | ... | 86.0 | 80.3 | 84.2 | |||
| Book Value Per Share | ... | ... | 630 | 683 | 761 | |||
| Earnings Per Share Growth | % | ... | ... | ... | -6.64 | 4.89 | ||
| Book Value Per Share Growth | % | ... | 9.75 | 18.2 | 8.34 | 11.5 |
| income statement | Unit | 2012 | 2013 | 2014 | 2015 | 2016 | 2017 | 2018 |
| income statement | ||||||||
| Interest Income | INR mil | 30,710 | 31,730 | 34,820 | 38,340 | 44,320 | ||
| Interest Cost | INR mil | 14,100 | 13,500 | 13,270 | 13,830 | 15,340 | ||
| Net Interest Income | INR mil | 16,610 | 18,230 | 21,550 | 24,510 | 28,980 | ||
| Other Income | INR mil | 0 | 0 | 490 | 210 | 30.0 | ||
| Total Revenues | INR mil | 16,610 | 18,230 | 22,040 | 24,720 | 29,010 | ||
| Staff Cost | INR mil | 2,240 | 2,710 | 4,120 | 5,130 | 5,500 | ||
| Other Cost | INR mil | 3,990 | 4,530 | 4,980 | 5,360 | 5,860 | ||
| Operating Cost | INR mil | 6,230 | 7,240 | 9,100 | 10,490 | 11,360 | ||
| Operating Profit | INR mil | 10,380 | 10,990 | 12,940 | 14,230 | 17,650 | ||
| Provisions | INR mil | 3,840 | 3,840 | 4,540 | 6,160 | 9,110 | ||
| Extra and Other Cost | INR mil | -120 | -650 | -10.0 | 0 | 0 | ||
| Pre-Tax Profit | INR mil | 6,660 | 7,800 | 8,410 | 8,070 | 8,540 | ||
| Tax | INR mil | 2,160 | 2,590 | 2,830 | 2,770 | 2,980 | ||
| Net Profit | INR mil | 4,500 | 5,210 | 5,580 | 5,300 | 5,560 | ||
| growth rates | ||||||||
| Net Interest Income Growth | % | ... | 9.75 | 18.2 | 13.7 | 18.2 | ||
| Total Revenue Growth | % | ... | 9.75 | 20.9 | 12.2 | 17.4 | ||
| Operating Cost Growth | % | ... | 16.2 | 25.7 | 15.3 | 8.29 | ||
| Operating Profit Growth | % | ... | 16.2 | 78.7 | 9.97 | 24.0 | ||
| Pre-Tax Profit Growth | % | ... | 17.1 | 7.82 | -4.04 | 5.82 | ||
| Net Profit Growth | % | ... | 15.8 | 7.10 | -5.02 | 4.91 | ||
| market share | ||||||||
| Market Share in Revenues | % | 0.704 | 0.676 | 0.726 | 0.734 | 0.721 | ... | |
| Market Share in Net Profit | % | 0.760 | 0.966 | 1.02 | 1.29 | ... | ... | ... |
| balance sheet | Unit | 2012 | 2013 | 2014 | 2015 | 2016 | 2017 | 2018 |
| balance sheet | ||||||||
| Cash | INR mil | ... | ... | 9,101 | 6,857 | 6,709 | ||
| Interbank Loans | INR mil | ... | ... | 1,187 | 746 | 270 | ||
| Customer Loans | INR mil | 158,280 | 146,680 | 167,170 | 195,750 | 231,320 | ||
| Debt Securities | INR mil | ... | ... | 834 | 872 | 832 | ||
| Total Assets | INR mil | ... | ... | 186,563 | 220,731 | 262,967 | ||
| Shareholders' Equity | INR mil | ... | ... | 40,870 | 45,050 | 50,250 | ||
| Liabilities | INR mil | ... | ... | 145,693 | 175,681 | 212,717 | ||
| Interbank Borrowing | INR mil | 73,560 | 64,960 | ... | ... | ... | ... | ... |
| Customer Deposits | INR mil | 42,640 | 47,750 | 124,020 | 144,080 | 170,420 | ||
| Retail Deposits | INR mil | 30,800 | 34,380 | ... | ... | ... | ... | ... |
| Corporate Deposits | INR mil | 11,840 | 13,370 | ... | ... | ... | ... | ... |
| Issued Debt Securities | INR mil | 11,080 | 7,860 | ... | ... | ... | ... | ... |
| asset quality | ||||||||
| Non-Performing Loans | INR mil | 2,940 | 3,400 | 4,910 | 9,800 | 15,370 | ||
| Gross Loans | INR mil | 160,150 | 149,320 | 171,020 | 202,580 | 242,590 | ||
| Total Provisions | INR mil | 1,870 | 2,640 | 3,850 | 6,830 | 11,270 | ||
| growth rates | ||||||||
| Customer Loan Growth | % | ... | -7.33 | 14.0 | 17.1 | 18.2 | ||
| Total Asset Growth | % | ... | ... | ... | 18.3 | 19.1 | ||
| Shareholders' Equity Growth | % | ... | ... | ... | 10.2 | 11.5 | ||
| Customer Deposit Growth | % | ... | 12.0 | 160 | 16.2 | 18.3 | ||
| Retail Deposit Growth | % | ... | 11.6 | ... | ... | ... | ... | ... |
| Corporate Deposit Growth | % | ... | 12.9 | ... | ... | ... | ... | ... |
| market share | ||||||||
| Market Share in Customer Loans | % | 0.287 | 0.228 | 0.236 | 0.246 | 0.280 | ... | |
| Market Share in Total Assets | % | ... | ... | 0.167 | 0.175 | 0.185 | ... | |
| Market Share in Customer Deposits | % | 0.068 | 0.066 | 0.152 | 0.158 | 0.160 | ... | |
| Market Share in Retail Deposits | % | 0.100 | ... | ... | ... | ... | ... | ... |
| ratios | Unit | 2012 | 2013 | 2014 | 2015 | 2016 | 2017 | 2018 |
| ratios | ||||||||
| ROE | % | ... | ... | 13.7 | 12.3 | 11.7 | ||
| ROA | % | ... | ... | 2.99 | 2.60 | 2.30 | ||
| Costs (As % Of Assets) | % | ... | ... | 4.88 | 5.15 | 4.70 | ||
| Costs (As % Of Income) | % | 37.5 | 39.7 | 41.3 | 42.4 | 39.2 | ||
| Capital Adequacy Ratio | % | 18.6 | 26.1 | 28.8 | 26.1 | 23.9 | ||
| Tier 1 Ratio | % | 14.6 | 20.2 | 24.6 | 23.4 | 22.2 | ||
| Net Interest Margin | % | ... | ... | 11.6 | 12.0 | 12.0 | ||
| Interest Spread | % | ... | ... | ... | 10.2 | 10.4 | ||
| Asset Yield | % | ... | ... | 18.7 | 18.8 | 18.3 | ||
| Cost Of Liabilities | % | ... | ... | ... | 8.61 | 7.90 | ||
| Interest Income (As % Of Revenues) | % | 100 | 100 | 97.8 | 99.2 | 99.9 | ||
| Other Income (As % Of Revenues) | % | 0 | 0 | 2.22 | 0.850 | 0.103 | ||
| Staff Cost (As % Of Total Cost) | % | 36.0 | 37.4 | 45.3 | 48.9 | 48.4 | ||
| Equity (As % Of Assets) | % | ... | ... | 21.9 | 20.4 | 19.1 | ||
| Loans (As % Of Deposits) | % | 371 | 307 | 135 | 136 | 136 | ||
| Loans (As % Assets) | % | ... | ... | 89.6 | 88.7 | 88.0 | ||
| NPLs (As % Of Loans) | % | 1.84 | 2.28 | 2.87 | 4.84 | 6.34 | ||
| Provisions (As % Of NPLs) | % | 63.6 | 77.6 | 78.4 | 69.7 | 73.3 | ||
| Provisions (As % Of Loans) | % | 1.18 | 1.80 | 2.30 | 3.49 | 4.87 | ||
| Cost of Provisions (As % Of Loans) | % | 2.43 | 2.52 | 2.89 | 3.39 | 4.27 |
Get all company financials in excel:

By Helgi Library - October 15, 2019
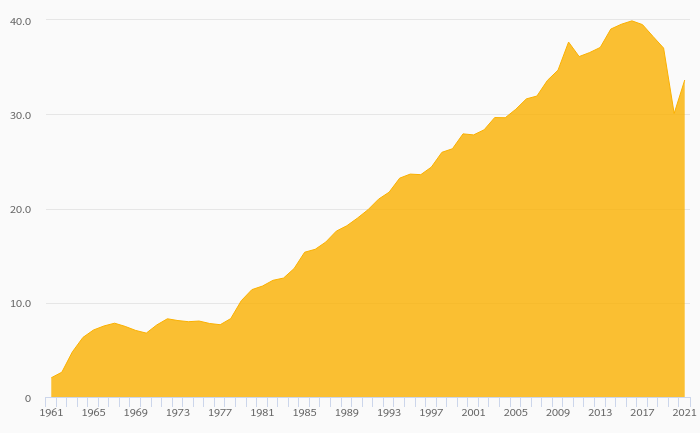
Shriram City Union Finance's customer loan growth reached 7.25% in 2018, down from 19.2% compared to the previous year. Historically, the bank’s loans growth reached an all time high of 19.2% in 2017 and an all time low of 7.25% in 2018. In the last decad...

Shriram City Union Finance has been growing its revenues and asset by 15.4% and 12.5% a year on average in the last 3 years. Its loans and deposits have grown by 14.8% and 16.1% a year during that time and loans to deposits ratio reached 131% at the end of 2018. The company achieved an average return on equity of 13.9% in the last three years with net profit growing 23.1% a year on average. In terms of operating efficiency, its cost to income ratio reached 39.5% in 2018, compared to 39.4% average in the last three years.
Equity represented 20.3% of total assets or 21.6% of loans at the end of 2018. Shriram City Union Finance's non-performing loans were 9.13% of total loans while provisions covered some 74.7% of NPLs at the end of 2018.
 Helgi Library