| Profit Statement | 2017 | 2018 | |
| Net Interest Income | INR mil | 25,483 | 32,356 |
| Net Fee Income | INR mil | 6,919 | 9,289 |
| Other Income | INR mil | 52,637 | 68,985 |
| Total Revenues | INR mil | 85,038 | 110,629 |
| Operating Profit | INR mil | 11,633 | 13,826 |
| Provisions | INR mil | 0 | 0 |
| Net Profit | INR mil | 6,931 | 8,709 |
| Balance Sheet | 2017 | 2018 | |
| Interbank Loans | INR mil | 142,721 | 181,534 |
| Customer Loans | INR mil | 504,693 | 618,883 |
| Total Assets | INR mil | 937,142 | 1,097,030 |
| Shareholders' Equity | INR mil | 95,939 | 106,698 |
| Interbank Borrowing | INR mil | 242,694 | 274,785 |
| Customer Deposits | INR mil | 0 | 0 |
| Issued Debt Securities | INR mil | 199,875 | 274,680 |
| Ratios | 2017 | 2018 | |
| ROE | % | 7.22 | 8.60 |
| ROA | % | 0.740 | 0.856 |
| Costs (As % Of Assets) | % | 7.83 | 9.52 |
| Costs (As % Of Income) | % | 86.3 | 87.5 |
| Net Interest Margin | % | 2.72 | 3.18 |
| Valuation | 2017 | 2018 | |
| Price/Earnings (P/E) | 46.4 | 24.6 | |
| Price/Book Value (P/BV) | 3.35 | 2.01 | |
| Earnings Per Share (EPS) | 3.53 | 3.95 | |
| Book Value Per Share | 48.9 | 48.4 | |
Get all company financials in excel:
| summary | Unit | 2017 | 2018 |
| income statement | |||
| Net Interest Income | INR mil | ||
| Total Revenues | INR mil | ||
| Operating Profit | INR mil | ||
| Net Profit | INR mil | ||
| balance sheet | |||
| Interbank Loans | INR mil | ||
| Customer Loans | INR mil | ||
| Debt Securities | INR mil | ||
| Total Assets | INR mil | ||
| Shareholders' Equity | INR mil | ||
| Interbank Borrowing | INR mil | ||
| Customer Deposits | INR mil | ||
| Issued Debt Securities | INR mil | ||
| ratios | |||
| ROE | % | ||
| ROA | % | ||
| Costs (As % Of Assets) | % | ||
| Costs (As % Of Income) | % | ||
| Net Interest Margin | % | ||
| Interest Income (As % Of Revenues) | % | ||
| Fee Income (As % Of Revenues) | % | ||
| Equity (As % Of Assets) | % | ||
| Loans (As % Assets) | % | ||
| valuation | |||
| Market Capitalisation (End Of Period) | USD mil | ||
| Number Of Shares (Average) | mil | ||
| Share Price (End Of Period) | INR | ||
| Earnings Per Share (EPS) | |||
| Book Value Per Share | |||
| Price/Earnings (P/E) | |||
| Price/Book Value (P/BV) | |||
| Earnings Per Share Growth | % | ... | |
| Book Value Per Share Growth | % | ... |
| income statement | Unit | 2017 | 2018 |
| income statement | |||
| Interest Income | INR mil | ||
| Interest Cost | INR mil | ||
| Net Interest Income | INR mil | ||
| Net Fee Income | INR mil | ||
| Other Income | INR mil | ||
| Total Revenues | INR mil | ||
| Operating Cost | INR mil | ||
| Operating Profit | INR mil | ||
| Provisions | INR mil | ||
| Extra and Other Cost | INR mil | ||
| Pre-Tax Profit | INR mil | ||
| Tax | INR mil | ||
| Minorities | INR mil | ||
| Net Profit | INR mil | ||
| growth rates | |||
| Net Interest Income Growth | % | ... | |
| Net Fee Income Growth | % | ... | |
| Total Revenue Growth | % | ... | |
| Operating Cost Growth | % | ... | |
| Operating Profit Growth | % | ... | |
| Pre-Tax Profit Growth | % | ... | |
| Net Profit Growth | % | ... | |
| market share | |||
| Market Share in Revenues | % | ... |
| balance sheet | Unit | 2017 | 2018 |
| balance sheet | |||
| Cash | INR mil | ||
| Interbank Loans | INR mil | ||
| Customer Loans | INR mil | ||
| Debt Securities | INR mil | ||
| Fixed Assets | INR mil | ||
| Total Assets | INR mil | ||
| Shareholders' Equity | INR mil | ||
| Of Which Minority Interest | INR mil | ||
| Liabilities | INR mil | ||
| Interbank Borrowing | INR mil | ||
| Customer Deposits | INR mil | ||
| Issued Debt Securities | INR mil | ||
| Other Liabilities | INR mil | ||
| growth rates | |||
| Customer Loan Growth | % | ... | |
| Total Asset Growth | % | ... | |
| Shareholders' Equity Growth | % | ... | |
| market share | |||
| Market Share in Customer Loans | % | ... | |
| Market Share in Total Assets | % | ... | |
| Market Share in Customer Deposits | % | ... |
| ratios | Unit | 2017 | 2018 |
| ratios | |||
| ROE | % | ||
| ROA | % | ||
| Costs (As % Of Assets) | % | ||
| Costs (As % Of Income) | % | ||
| Tier 1 Ratio | % | ||
| Net Interest Margin | % | ||
| Interest Spread | % | ... | |
| Asset Yield | % | ||
| Cost Of Liabilities | % | ... | |
| Interest Income (As % Of Revenues) | % | ||
| Fee Income (As % Of Revenues) | % | ||
| Other Income (As % Of Revenues) | % | ||
| Equity (As % Of Assets) | % | ||
| Loans (As % Assets) | % | ||
| Cost of Provisions (As % Of Loans) | % |
Get all company financials in excel:


Aditya Birla Capital has been growing its revenues and asset by % and % a year on average in the last 3 years. Its loans and deposits have grown by % and % a year during that time and loans to deposits ratio reached at the end of 2018. The company achieved an average return on equity of 7.91% in the last three years with net profit growing % a year on average. In terms of operating efficiency, its cost to income ratio reached 87.5% in 2018, compared to 86.9% average in the last three years.
Equity represented 9.73% of total assets or 17.2% of loans at the end of 2018. Aditya Birla Capital's non-performing loans were of total loans while provisions covered some of NPLs at the end of 2018.
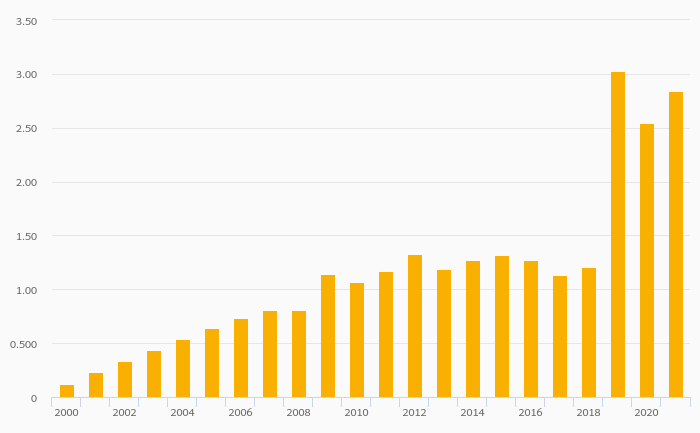
Aditya Birla Capital stock traded at INR 97.1 per share at the end of 2018 resulting in a market capitalization of USD 3,070 mil. Over the previous three years, stock price rose by 0% or 0% a year on average. That’s compared to an average ROE of 7.91% the bank generated for its shareholders. This closing price put stock at a 12-month trailing price to earnings (PE) of 24.6x and price to book value (PBV) of 2.01x in 2018.
 Helgi Library