| Profit Statement |
| Balance Sheet |
| Ratios |
| Valuation |
Get all company financials in excel:
Get all company financials in excel:


Aditya Birla Capital has been growing its revenues and asset by % and % a year on average in the last 3 years. Its loans and deposits have grown by % and % a year during that time and loans to deposits ratio reached at the end of 2018. The company achieved an average return on equity of 7.91% in the last three years with net profit growing % a year on average. In terms of operating efficiency, its cost to income ratio reached 87.5% in 2018, compared to 86.9% average in the last three years.
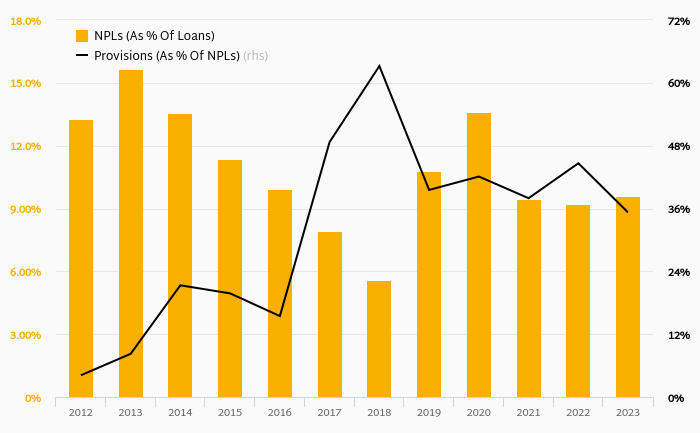
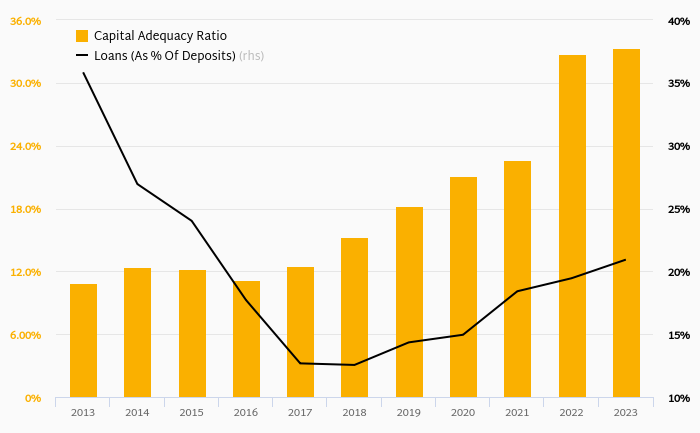
Equity represented 9.73% of total assets or 17.2% of loans at the end of 2018. Aditya Birla Capital's non-performing loans were of total loans while provisions covered some of NPLs at the end of 2018.
Aditya Birla Capital stock traded at INR 97.1 per share at the end of 2018 resulting in a market capitalization of USD 3,070 mil. Over the previous three years, stock price rose by 0% or 0% a year on average. That’s compared to an average ROE of 7.91% the bank generated for its shareholders. This closing price put stock at a 12-month trailing price to earnings (PE) of 24.6x and price to book value (PBV) of 2.01x in 2018.
 Helgi Library