By Helgi Library - March 4, 2020
Bank Tabungan Pensiunan Nasional made a net profit of IDR 366 bil under revenues of IDR 1,039 bil in the third quarter of 2019, up 46...
By Helgi Library - March 4, 2020
Bank Tabungan Pensiunan Nasional made a net profit of IDR 366 bil under revenues of IDR 1,039 bil in the third quarter of 2019, up 46...
By Helgi Library - March 4, 2020
Bank Tabungan Pensiunan Nasional stock traded at IDR 3,300 per share at the end of third quarter of 2019 implying a market capitalizatio...
| Profit Statement | 2016 | 2017 | 2018 | |
| Net Interest Income | IDR bil | 1,936 | 2,560 | 3,080 |
| Net Fee Income | IDR bil | 0.203 | 0.509 | 0.571 |
| Other Income | IDR bil | 1.22 | 3.79 | 5.69 |
| Total Revenues | IDR bil | 1,938 | 2,564 | 3,086 |
| Staff Cost | IDR bil | 771 | 834 | 899 |
| Operating Profit | IDR bil | 670 | 1,140 | 1,569 |
| Provisions | IDR bil | 115 | 232 | 269 |
| Net Profit | IDR bil | 413 | 670 | 964 |
| Balance Sheet | 2016 | 2017 | 2018 | |
| Interbank Loans | IDR bil | 34.5 | 1,023 | 317 |
| Customer Loans | IDR bil | 4,941 | 5,971 | 7,143 |
| Total Assets | IDR bil | 7,323 | 9,157 | 12,039 |
| Shareholders' Equity | IDR bil | 1,593 | 2,255 | 3,997 |
| Interbank Borrowing | IDR bil | 4,393 | 5,247 | 5,993 |
| Customer Deposits | IDR bil | 993 | 1,298 | 1,619 |
| Issued Debt Securities | IDR bil | 1.57 | 0.820 | 0.020 |
| Ratios | 2016 | 2017 | 2018 | |
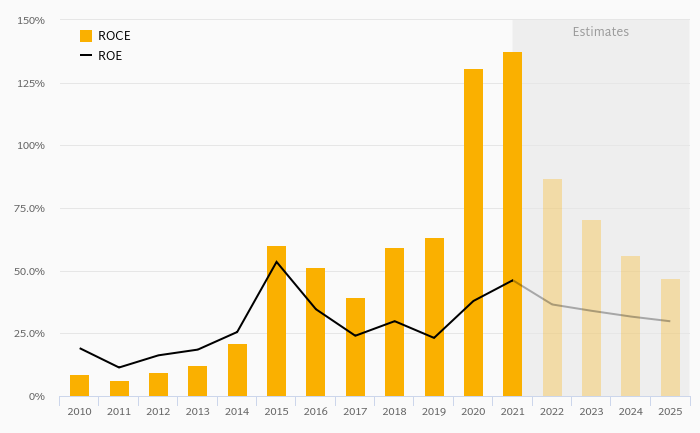
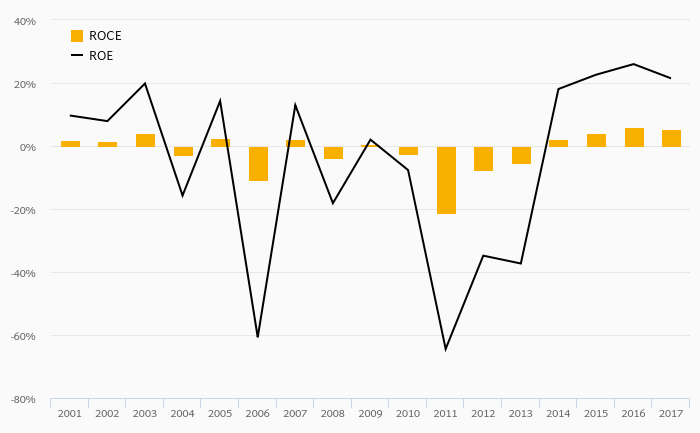
| ROE | % | 29.9 | 34.8 | 30.8 |
| ROA | % | 6.59 | 8.13 | 9.09 |
| Costs (As % Of Assets) | % | 20.3 | 17.3 | 14.3 |
| Costs (As % Of Income) | % | 65.4 | 55.5 | 49.1 |
| Capital Adequacy Ratio | % | 23.8 | 28.9 | 40.9 |
| Net Interest Margin | % | 30.9 | 31.1 | 29.1 |
| Loans (As % Of Deposits) | % | 498 | 460 | 441 |
| Valuation | 2016 | 2017 | 2018 | |
| Price/Earnings (P/E) | ... | ... | 13.9 | |
| Price/Book Value (P/BV) | ... | ... | 3.34 | |
| Dividend Yield | % | ... | ... | 0 |
| Earnings Per Share (EPS) | IDR | ... | ... | 130 |
| Book Value Per Share | IDR | ... | ... | 538 |
| Dividend Per Share | IDR | ... | ... | 0 |
Get all company financials in excel:
| income statement | Unit | 2015 | 2016 | 2017 | 2018 |
| income statement | |||||
| Interest Income | IDR bil | 1,563 | 2,226 | ||
| Interest Cost | IDR bil | 247 | 290 | ||
| Net Interest Income | IDR bil | 1,315 | 1,936 | ||
| Net Fee Income | IDR bil | 0.369 | 0.203 | ||
| Other Income | IDR bil | 1.87 | 1.22 | ||
| Total Revenues | IDR bil | 1,318 | 1,938 | ||
| Staff Cost | IDR bil | 622 | 771 | ||
| Operating Cost | IDR bil | 1,005 | 1,268 | ||
| Operating Profit | IDR bil | 313 | 670 | ||
| Provisions | IDR bil | 62.5 | 115 | ||
| Extra and Other Cost | IDR bil | -0.360 | -0.914 | ||
| Pre-Tax Profit | IDR bil | 251 | 556 | ||
| Tax | IDR bil | 62.1 | 143 | ||
| Minorities | IDR bil | 0 | 0 | ||
| Net Profit | IDR bil | 188 | 413 | ||
| Dividends | IDR bil | ... | ... | ... | |
| growth rates | |||||
| Net Interest Income Growth | % | ... | 47.2 | ||
| Net Fee Income Growth | % | ... | -45.0 | ||
| Total Revenue Growth | % | ... | 47.0 | ||
| Operating Cost Growth | % | ... | 26.1 | ||
| Operating Profit Growth | % | ... | 114 | ||
| Pre-Tax Profit Growth | % | ... | 122 | ||
| Net Profit Growth | % | ... | 119 | ||
| market share | |||||
| Market Share in Revenues | % | 0.301 | 0.384 | ... | |
| Market Share in Net Profit | % | 0.190 | 0.437 | ... |
| balance sheet | Unit | 2015 | 2016 | 2017 | 2018 |
| balance sheet | |||||
| Cash | IDR bil | 760 | 1,741 | ||
| Interbank Loans | IDR bil | 425 | 34.5 | ||
| Customer Loans | IDR bil | 3,658 | 4,941 | ||
| Debt Securities | IDR bil | 0 | 0 | ||
| Fixed Assets | IDR bil | 175 | 186 | ||
| Intangible Assets | IDR bil | 22.4 | 36.4 | ||
| Goodwill | IDR bil | 0 | 0 | ||
| Total Assets | IDR bil | 5,196 | 7,323 | ||
| Shareholders' Equity | IDR bil | 1,163 | 1,593 | ||
| Of Which Minority Interest | IDR bil | 0 | 0 | ||
| Liabilities | IDR bil | 4,033 | 5,731 | ||
| Interbank Borrowing | IDR bil | 3,050 | 4,393 | ||
| Customer Deposits | IDR bil | 759 | 993 | ||
| Sight Deposits | IDR bil | 28.8 | 13.4 | ||
| Term Deposits | IDR bil | 730 | 979 | ||
| Issued Debt Securities | IDR bil | 1.06 | 1.57 | ||
| Other Liabilities | IDR bil | 223 | 343 | ||
| asset quality | |||||
| Gross Loans | IDR bil | 3,720 | 5,055 | ||
| Total Provisions | IDR bil | 62.0 | 114 | ||
| growth rates | |||||
| Customer Loan Growth | % | ... | 35.1 | ||
| Total Asset Growth | % | ... | 40.9 | ||
| Shareholders' Equity Growth | % | ... | 36.9 | ||
| Customer Deposit Growth | % | ... | 30.9 | ||
| market share | |||||
| Market Share in Customer Loans | % | 0.089 | 0.113 | ... | |
| Market Share in Total Assets | % | 0.085 | 0.110 | ... | |
| Market Share in Customer Deposits | % | 0.019 | 0.022 | ... |
| ratios | Unit | 2015 | 2016 | 2017 | 2018 |
| ratios | |||||
| ROE | % | ... | 29.9 | ||
| ROA | % | ... | 6.59 | ||
| Costs (As % Of Assets) | % | ... | 20.3 | ||
| Costs (As % Of Income) | % | 76.3 | 65.4 | ||
| Capital Adequacy Ratio | % | 19.9 | 23.8 | ||
| Net Interest Margin | % | ... | 30.9 | ||
| Interest Spread | % | ... | 29.6 | ||
| Asset Yield | % | ... | 35.6 | ||
| Cost Of Liabilities | % | ... | 5.95 | ||
| Payout Ratio | % | ... | ... | ... | |
| Interest Income (As % Of Revenues) | % | 99.8 | 99.9 | ||
| Fee Income (As % Of Revenues) | % | 0.028 | 0.010 | ||
| Other Income (As % Of Revenues) | % | 0.142 | 0.063 | ||
| Cost Per Employee | USD per month | 311 | 400 | ||
| Cost Per Employee (Local Currency) | IDR per month | 4,076,290 | 5,443,480 | ||
| Staff Cost (As % Of Total Cost) | % | 61.9 | 60.8 | ||
| Equity (As % Of Assets) | % | 22.4 | 21.7 | ||
| Loans (As % Of Deposits) | % | 482 | 498 | ||
| Loans (As % Assets) | % | 70.4 | 67.5 | ||
| Provisions (As % Of Loans) | % | 1.69 | 2.30 | ||
| Cost of Provisions (As % Of Loans) | % | ... | 2.68 |
| other data | Unit | 2015 | 2016 | 2017 | 2018 |
| other data | |||||
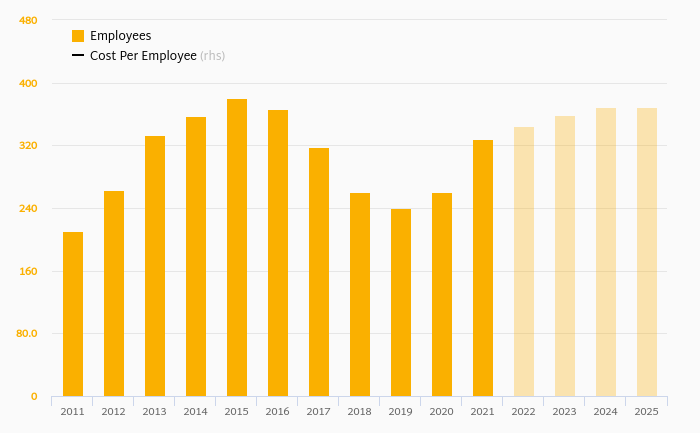
| Employees | 12,712 | 11,804 | |||
| Sight (As % Of Customer Deposits) | % | 3.79 | 1.35 | ||
| Risk-Weighted Assets | IDR bil | 5,339 | 6,390 | ||
| Return on Loans | % | 5.15 | 9.60 | ||
| Operating Profit (As % of Loans) | % | ... | 15.6 | ||
| Costs (As % Of Loans) | % | ... | 29.5 | ||
| Equity (As % Of Loans) | % | 31.8 | 32.2 |
Get all company financials in excel:


By Helgi Library - March 4, 2020
Bank Tabungan Pensiunan Nasional stock traded at IDR 3,300 per share at the end of third quarter of 2019 implying a market capitalization of USD 1,793 mil. Over the last five years, the stock has appreciated by 0 implying an annual average growth of 0% In...
By Helgi Library - March 4, 2020
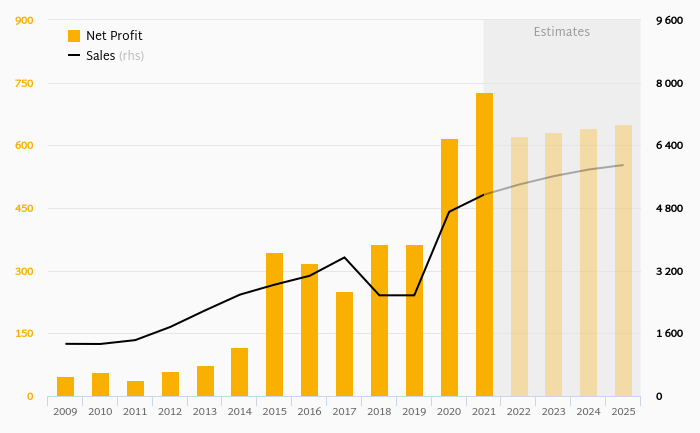
Bank Tabungan Pensiunan Nasional generated total banking revenues of IDR 1,039 bil in the third quarter of 2019, up 30.6% when compared to the same period of last year and 9.26% when compared to the previous quarter. Historically, the bank’s revenues containi...
By Helgi Library - March 4, 2020
Bank Tabungan Pensiunan Nasional generated total banking revenues of IDR 1,039 bil in the third quarter of 2019, up 30.6% when compared to the same period of last year and 9.26% when compared to the previous quarter. Historically, the bank’s revenues containi...
By Helgi Library - March 4, 2020
Bank Tabungan Pensiunan Nasional's net interest margin amounted to 29.1% in the third quarter of 2019, up from 28.7% when compared to the previous quarter. Historically, the bank’s net interest margin reached an all time high of 29.3% in 1Q2018 and an all ti...
By Helgi Library - March 4, 2020
Bank Tabungan Pensiunan Nasional's net interest margin amounted to 29.1% in the third quarter of 2019, up from 28.7% when compared to the previous quarter. Historically, the bank’s net interest margin reached an all time high of 29.3% in 1Q2018 and an all ti...
By Helgi Library - March 4, 2020
Bank Tabungan Pensiunan Nasional stock traded at IDR 3,300 per share at the end third quarter of 2019 implying a market capitalization of USD 1,793 mil. Since the end of 3Q2014, the stock has appreciated by % implying an annual average growth of 0 %. In absolute term...
By Helgi Library - March 4, 2020
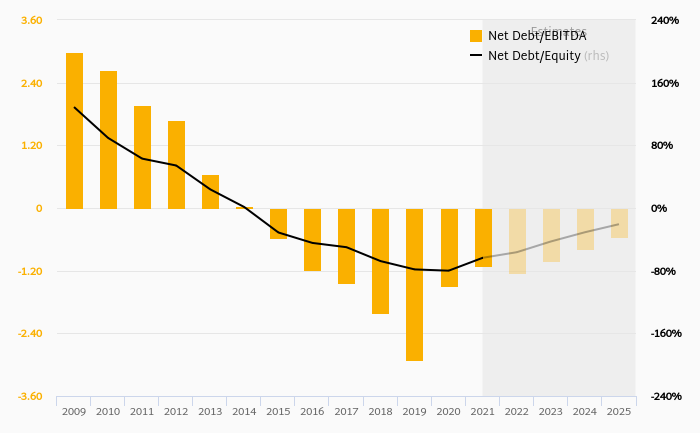
Bank Tabungan Pensiunan Nasional's Equity reached 34.0% of total assets in the 3Q2019, up from 32.8% for the previous year. As a share of net customer loans, the ratio amounted to 56.7% at the end of the third quarter of 2019. ...
By Helgi Library - March 4, 2020
Bank Tabungan Pensiunan Nasional's Equity reached 34.0% of total assets in the 3Q2019, up from 32.8% for the previous year. As a share of net customer loans, the ratio amounted to 56.7% at the end of the third quarter of 2019. ...

 Helgi Library