By Helgi Library - September 17, 2018
Erste Bank Serbia made a net profit of RSD 2,622 mil under revenues of RSD 8,653 mil in 2017, up 25.0% and 7.07% respectively compare...
By Helgi Library - September 17, 2018
Erste Bank Serbia's non-performing loans reached 3.07% of total loans at the end of 2017, down from 6.52% compared to the previou...
By Helgi Library - September 17, 2018
Erste Bank Serbia employed 1,075 persons in 2017, up 5.29% when compared to the previous year. Historically, the bank's workforc...
| Profit Statement | 2015 | 2016 | 2017 | |
| Net Interest Income | RSD mil | 5,269 | 5,921 | 6,354 |
| Net Fee Income | RSD mil | 1,650 | 1,484 | 1,507 |
| Other Income | RSD mil | 576 | 677 | 793 |
| Total Revenues | RSD mil | 7,494 | 8,082 | 8,653 |
| Staff Cost | RSD mil | 1,647 | 1,870 | 2,006 |
| Operating Profit | RSD mil | 2,614 | 2,815 | 2,881 |
| Provisions | RSD mil | 1,397 | 606 | 0 |
| Net Profit | RSD mil | 1,189 | 2,098 | 2,622 |
| Balance Sheet | 2015 | 2016 | 2017 | |
| Interbank Loans | RSD mil | 2,733 | 1,210 | 2,199 |
| Customer Loans | RSD mil | 79,044 | 96,463 | 110,473 |
| Total Assets | RSD mil | 117,488 | 148,107 | 168,265 |
| Shareholders' Equity | RSD mil | 16,000 | 18,254 | 21,060 |
| Interbank Borrowing | RSD mil | 30,282 | 51,428 | 51,859 |
| Customer Deposits | RSD mil | 68,295 | 75,291 | 91,982 |
| Issued Debt Securities | RSD mil | 1,825 | 1,765 | 1,355 |
| Ratios | 2015 | 2016 | 2017 | |
| ROE | % | 7.74 | 12.3 | 13.3 |
| ROA | % | 1.09 | 1.58 | 1.66 |
| Costs (As % Of Assets) | % | 4.47 | 3.97 | 3.65 |
| Costs (As % Of Income) | % | 65.1 | 65.2 | 66.7 |
| Capital Adequacy Ratio | % | 17.2 | 15.6 | 17.3 |
| Net Interest Margin | % | 4.82 | 4.46 | 4.02 |
| Loans (As % Of Deposits) | % | 116 | 128 | 120 |
| NPLs (As % Of Loans) | % | 7.95 | 6.52 | 3.07 |
| Provisions (As % Of NPLs) | % | 115 | 102 | 121 |
| Growth Rates | 2015 | 2016 | 2017 | |
| Total Revenue Growth | % | 11.1 | 7.85 | 7.07 |
| Operating Cost Growth | % | 1.89 | 7.92 | 9.59 |
| Operating Profit Growth | % | 33.8 | 7.71 | 2.34 |
| Net Profit Growth | % | 397 | 76.4 | 25.0 |
| Customer Loan Growth | % | 23.3 | 22.0 | 14.5 |
| Total Asset Growth | % | 16.4 | 26.1 | 13.6 |
| Customer Deposit Growth | % | 10.9 | 10.2 | 22.2 |
| Shareholders' Equity Growth | % | 8.56 | 14.1 | 15.4 |
| Employees | 1,027 | 1,021 | 1,075 | |
Get all company financials in excel:
| summary | Unit | 2005 | 2006 | 2007 | 2008 | 2009 | 2010 | 2011 | 2012 | 2013 | 2014 | 2015 | 2016 | 2017 |
| income statement | ||||||||||||||
| Net Interest Income | RSD mil | 3,958 | 4,167 | 4,470 | 4,658 | 5,269 | ||||||||
| Total Revenues | RSD mil | 10,512 | 12,373 | 6,430 | 6,743 | 7,494 | ||||||||
| Operating Profit | RSD mil | 1,666 | 1,961 | 2,118 | 1,953 | 2,614 | ||||||||
| Net Profit | RSD mil | 789 | 1,250 | 1,059 | 239 | 1,189 | ||||||||
| balance sheet | ||||||||||||||
| Interbank Loans | RSD mil | 13,642 | 7,170 | 13,417 | 3,899 | 2,733 | ||||||||
| Customer Loans | RSD mil | 50,935 | 61,509 | 57,339 | 64,116 | 79,044 | ||||||||
| Debt Securities | RSD mil | 6,174 | 6,800 | 9,164 | 15,159 | 18,818 | ||||||||
| Total Assets | RSD mil | 72,077 | 80,690 | 97,582 | 100,955 | 117,488 | ||||||||
| Shareholders' Equity | RSD mil | 12,051 | 13,299 | 14,359 | 14,738 | 16,000 | ||||||||
| Interbank Borrowing | RSD mil | 17,431 | 20,220 | 13,729 | 21,521 | 30,282 | ||||||||
| Customer Deposits | RSD mil | 47,327 | 41,811 | 64,904 | 61,603 | 68,295 | ||||||||
| Issued Debt Securities | RSD mil | 0 | 3,873 | 3,656 | 2,064 | 1,825 | ||||||||
| ratios | ||||||||||||||
| ROE | % | 6.77 | 9.86 | 7.66 | 1.65 | 7.74 | ||||||||
| ROA | % | 1.18 | 1.64 | 1.19 | 0.241 | 1.09 | ||||||||
| Costs (As % Of Assets) | % | 13.2 | 13.6 | 4.84 | 4.83 | 4.47 | ||||||||
| Costs (As % Of Income) | % | 84.2 | 84.1 | 67.1 | 71.0 | 65.1 | ||||||||
| Capital Adequacy Ratio | % | ... | ... | 24.4 | 21.3 | 21.0 | 19.8 | 17.2 | ||||||
| Net Interest Margin | % | 5.90 | 5.46 | 5.01 | 4.69 | 4.82 | ||||||||
| Interest Income (As % Of Revenues) | % | 37.7 | 33.7 | 69.5 | 69.1 | 70.3 | ||||||||
| Fee Income (As % Of Revenues) | % | 13.6 | 13.1 | 26.4 | 26.2 | 22.0 | ||||||||
| Staff Cost (As % Of Total Cost) | % | 16.6 | 15.3 | 37.6 | 35.4 | 33.7 | ||||||||
| Equity (As % Of Assets) | % | 16.7 | 16.5 | 14.7 | 14.6 | 13.6 | ||||||||
| Loans (As % Of Deposits) | % | 108 | 147 | 88.3 | 104 | 116 | ||||||||
| Loans (As % Assets) | % | 70.7 | 76.2 | 58.8 | 63.5 | 67.3 | ||||||||
| NPLs (As % Of Loans) | % | ... | ... | 10.2 | 10.4 | 13.0 | 10.8 | 7.95 | ||||||
| Provisions (As % Of NPLs) | % | ... | ... | 95.8 | 91.8 | 88.9 | 98.0 | 115 | ||||||
| valuation | ||||||||||||||
| Book Value Per Share Growth | % | ... | 28.1 | 5.28 | 7.26 | 4.21 | 13.1 |
| income statement | Unit | 2005 | 2006 | 2007 | 2008 | 2009 | 2010 | 2011 | 2012 | 2013 | 2014 | 2015 | 2016 | 2017 |
| income statement | ||||||||||||||
| Interest Income | RSD mil | 5,873 | 6,514 | 7,333 | 6,910 | 6,772 | ||||||||
| Interest Cost | RSD mil | 1,915 | 2,347 | 2,864 | 2,251 | 1,504 | ||||||||
| Net Interest Income | RSD mil | 3,958 | 4,167 | 4,470 | 4,658 | 5,269 | ||||||||
| Net Fee Income | RSD mil | 1,429 | 1,624 | 1,696 | 1,764 | 1,650 | ||||||||
| Other Income | RSD mil | 5,125 | 6,581 | 263 | 321 | 576 | ||||||||
| Total Revenues | RSD mil | 10,512 | 12,373 | 6,430 | 6,743 | 7,494 | ||||||||
| Staff Cost | RSD mil | 1,468 | 1,595 | 1,619 | 1,693 | 1,647 | ||||||||
| Depreciation | RSD mil | 172 | 212 | 246 | 274 | 257 | ||||||||
| Other Cost | RSD mil | 7,205 | 8,604 | 2,446 | 2,823 | 2,976 | ||||||||
| Operating Cost | RSD mil | 8,846 | 10,411 | 4,311 | 4,790 | 4,880 | ||||||||
| Operating Profit | RSD mil | 1,666 | 1,961 | 2,118 | 1,953 | 2,614 | ||||||||
| Provisions | RSD mil | 883 | 887 | 993 | 1,829 | 1,397 | ||||||||
| Extra and Other Cost | RSD mil | 0 | -1.98 | 0 | < 0.001 | 0 | ||||||||
| Pre-Tax Profit | RSD mil | 783 | 1,076 | 1,125 | 124 | 1,216 | ||||||||
| Tax | RSD mil | -7.47 | -179 | 65.7 | -104 | 26.9 | ||||||||
| Minorities | RSD mil | 0 | 0 | 0 | -11.1 | 0 | ||||||||
| Net Profit | RSD mil | 789 | 1,250 | 1,059 | 239 | 1,189 | ||||||||
| growth rates | ||||||||||||||
| Net Interest Income Growth | % | ... | 28.1 | 5.28 | 7.26 | 4.21 | 13.1 | |||||||
| Net Fee Income Growth | % | ... | 18.5 | 13.6 | 4.47 | 4.00 | -6.50 | |||||||
| Total Revenue Growth | % | ... | 24.3 | 17.7 | -48.0 | 4.88 | 11.1 | |||||||
| Operating Cost Growth | % | ... | 19.5 | 17.7 | -58.6 | 11.1 | 1.89 | |||||||
| Operating Profit Growth | % | ... | 57.7 | 17.7 | 7.99 | -7.78 | 33.8 | |||||||
| Pre-Tax Profit Growth | % | ... | 147 | 37.4 | 4.56 | -89.0 | 879 | |||||||
| Net Profit Growth | % | ... | 148 | 58.4 | -15.3 | -77.4 | 397 | |||||||
| market share | ||||||||||||||
| Market Share in Revenues | % | 6.38 | 7.31 | 3.95 | 3.86 | 4.08 | ||||||||
| Market Share in Net Profit | % | ... | ... | 63.1 | 10.7 | ... | 10.5 | 16.0 | ||||||
| Market Share in Employees | % | ... | 3.38 | 3.50 | 3.68 | 3.95 | 4.23 | |||||||
| Market Share in Branches | % | ... | ... | 1.89 | 2.05 | 2.31 | 2.63 | 2.72 |
| balance sheet | Unit | 2005 | 2006 | 2007 | 2008 | 2009 | 2010 | 2011 | 2012 | 2013 | 2014 | 2015 | 2016 | 2017 |
| balance sheet | ||||||||||||||
| Cash | RSD mil | 4,232 | 7,370 | 16,105 | 15,906 | 18,523 | ||||||||
| Interbank Loans | RSD mil | 13,642 | 7,170 | 13,417 | 3,899 | 2,733 | ||||||||
| Customer Loans | RSD mil | 50,935 | 61,509 | 57,339 | 64,116 | 79,044 | ||||||||
| Retail Loans | RSD mil | 19,692 | 22,075 | 23,867 | 26,824 | 30,659 | ||||||||
| Mortgage Loans | RSD mil | ... | ... | ... | ... | ... | ... | ... | ... | ... | ... | ... | ||
| Consumer Loans | RSD mil | ... | ... | ... | ... | ... | ... | ... | ... | ... | ... | ... | ||
| Corporate Loans | RSD mil | 31,244 | 39,434 | 33,472 | 37,292 | 48,385 | ||||||||
| Debt Securities | RSD mil | 6,174 | 6,800 | 9,164 | 15,159 | 18,818 | ||||||||
| Fixed Assets | RSD mil | 763 | 901 | 1,119 | 1,105 | 733 | ||||||||
| Total Assets | RSD mil | 72,077 | 80,690 | 97,582 | 100,955 | 117,488 | ||||||||
| Shareholders' Equity | RSD mil | 12,051 | 13,299 | 14,359 | 14,738 | 16,000 | ||||||||
| Of Which Minority Interest | RSD mil | 0 | 0 | 0 | 43.1 | 0 | ||||||||
| Liabilities | RSD mil | 60,026 | 67,391 | 83,223 | 86,218 | 101,488 | ||||||||
| Interbank Borrowing | RSD mil | 17,431 | 20,220 | 13,729 | 21,521 | 30,282 | ||||||||
| Customer Deposits | RSD mil | 47,327 | 41,811 | 64,904 | 61,603 | 68,295 | ||||||||
| Retail Deposits | RSD mil | 18,681 | 22,540 | 27,265 | 32,679 | 36,207 | ||||||||
| Corporate Deposits | RSD mil | 28,646 | 19,271 | 37,639 | 28,924 | 32,088 | ||||||||
| Issued Debt Securities | RSD mil | 0 | 3,873 | 3,656 | 2,064 | 1,825 | ||||||||
| Other Liabilities | RSD mil | 3,401 | 1,487 | 933 | 1,031 | 1,086 | ||||||||
| asset quality | ||||||||||||||
| Non-Performing Loans | RSD mil | ... | ... | 5,200 | 6,383 | 8,455 | 7,732 | 6,909 | ||||||
| Gross Loans | RSD mil | 50,935 | 61,509 | 64,859 | 71,689 | 86,956 | ||||||||
| Total Provisions | RSD mil | 4,982 | 5,861 | 7,520 | 7,573 | 7,912 | ||||||||
| growth rates | ||||||||||||||
| Customer Loan Growth | % | ... | 6.17 | 20.8 | -6.78 | 11.8 | 23.3 | |||||||
| Retail Loan Growth | % | ... | 16.9 | 12.1 | 8.12 | 12.4 | 14.3 | |||||||
| Mortgage Loan Growth | % | ... | ... | ... | ... | ... | ... | ... | ... | ... | ... | ... | ... | |
| Consumer Loan Growth | % | ... | ... | ... | ... | ... | ... | ... | ... | ... | ... | ... | ... | |
| Corporate Loan Growth | % | ... | 0.355 | 26.2 | -15.1 | 11.4 | 29.7 | |||||||
| Total Asset Growth | % | ... | 16.0 | 12.0 | 20.9 | 3.46 | 16.4 | |||||||
| Shareholders' Equity Growth | % | ... | 7.03 | 10.4 | 7.97 | 2.63 | 8.56 | |||||||
| Customer Deposit Growth | % | ... | 42.3 | -11.7 | 55.2 | -5.09 | 10.9 | |||||||
| Retail Deposit Growth | % | ... | 18.1 | 20.7 | 21.0 | 19.9 | 10.8 | |||||||
| Corporate Deposit Growth | % | ... | 64.2 | -32.7 | 95.3 | -23.2 | 10.9 | |||||||
| market share | ||||||||||||||
| Market Share in Customer Loans | % | 2.56 | 2.73 | 2.60 | 2.69 | 3.14 | ||||||||
| Market Share in Corporate Loans | % | 3.07 | 3.52 | 3.30 | 3.84 | 4.87 | ||||||||
| Market Share in Retail Loans | % | ... | ... | ... | ... | ... | ... | ... | ... | ... | ... | ... | ||
| Market Share in Consumer Loans | % | 3.27 | 3.38 | 3.54 | 3.70 | 4.04 | ||||||||
| Market Share in Mortgage Loans | % | ... | ... | ... | ... | ... | ... | ... | ... | ... | ... | ... | ||
| Market Share in Total Assets | % | 2.48 | 2.55 | 3.10 | 3.05 | 3.43 | ||||||||
| Market Share in Customer Deposits | % | 3.41 | 2.73 | 4.07 | 3.59 | 3.73 | ||||||||
| Market Share in Retail Deposits | % | 2.18 | 2.28 | 2.67 | 2.98 | 3.20 | ||||||||
| Market Share in Corporate Deposits | % | 6.77 | 4.46 | 8.77 | 5.78 | 5.57 |
| ratios | Unit | 2005 | 2006 | 2007 | 2008 | 2009 | 2010 | 2011 | 2012 | 2013 | 2014 | 2015 | 2016 | 2017 |
| ratios | ||||||||||||||
| ROE | % | 6.77 | 9.86 | 7.66 | 1.65 | 7.74 | ||||||||
| ROA | % | 1.18 | 1.64 | 1.19 | 0.241 | 1.09 | ||||||||
| Costs (As % Of Assets) | % | 13.2 | 13.6 | 4.84 | 4.83 | 4.47 | ||||||||
| Costs (As % Of Income) | % | 84.2 | 84.1 | 67.1 | 71.0 | 65.1 | ||||||||
| Capital Adequacy Ratio | % | ... | ... | 24.4 | 21.3 | 21.0 | 19.8 | 17.2 | ||||||
| Net Interest Margin | % | 5.90 | 5.46 | 5.01 | 4.69 | 4.82 | ||||||||
| Interest Spread | % | ... | 5.30 | 4.84 | 4.42 | 4.30 | 4.60 | |||||||
| Asset Yield | % | 8.75 | 8.53 | 8.23 | 6.96 | 6.20 | ||||||||
| Cost Of Liabilities | % | ... | 3.45 | 3.68 | 3.80 | 2.66 | 1.60 | |||||||
| Interest Income (As % Of Revenues) | % | 37.7 | 33.7 | 69.5 | 69.1 | 70.3 | ||||||||
| Fee Income (As % Of Revenues) | % | 13.6 | 13.1 | 26.4 | 26.2 | 22.0 | ||||||||
| Other Income (As % Of Revenues) | % | 48.8 | 53.2 | 4.10 | 4.76 | 7.68 | ||||||||
| Cost Per Employee | USD per month | ... | 1,688 | 1,522 | 1,630 | 1,553 | 1,265 | |||||||
| Cost Per Employee (Local Currency) | RSD per month | ... | 123,832 | 133,872 | 138,818 | 142,243 | 133,630 | |||||||
| Staff Cost (As % Of Total Cost) | % | 16.6 | 15.3 | 37.6 | 35.4 | 33.7 | ||||||||
| Equity (As % Of Assets) | % | 16.7 | 16.5 | 14.7 | 14.6 | 13.6 | ||||||||
| Loans (As % Of Deposits) | % | 108 | 147 | 88.3 | 104 | 116 | ||||||||
| Loans (As % Assets) | % | 70.7 | 76.2 | 58.8 | 63.5 | 67.3 | ||||||||
| NPLs (As % Of Loans) | % | ... | ... | 10.2 | 10.4 | 13.0 | 10.8 | 7.95 | ||||||
| Provisions (As % Of NPLs) | % | ... | ... | 95.8 | 91.8 | 88.9 | 98.0 | 115 | ||||||
| Provisions (As % Of Loans) | % | 9.78 | 9.53 | 13.1 | 11.8 | 10.0 | ||||||||
| Cost of Provisions (As % Of Loans) | % | 1.79 | 1.58 | 1.67 | 3.01 | 1.95 |
Get all company financials in excel:


By Helgi Library - September 17, 2018
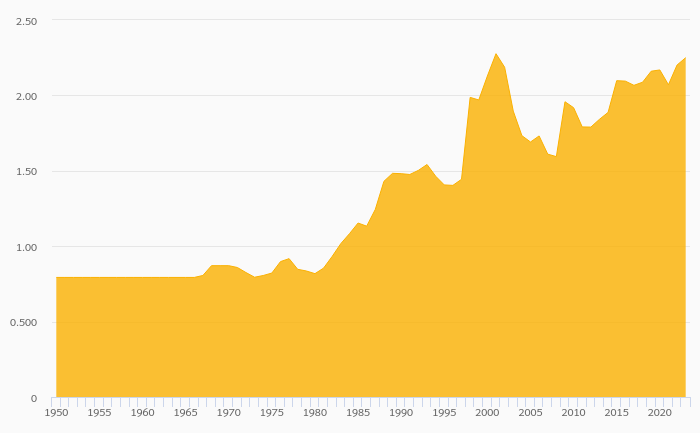
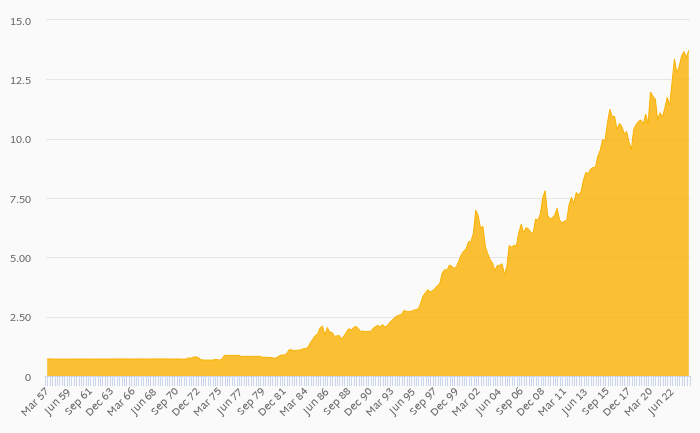
Erste Bank Serbia's customer deposits reached RSD 91,982 mil in 2017, up 22.2% compared to the previous year. Serbian banking sector accepted customer deposits of RSD 2,111 bil in 2017, up 3.62% when compared to the last year. Erste Bank Serbia accounted ...
By Helgi Library - September 17, 2018
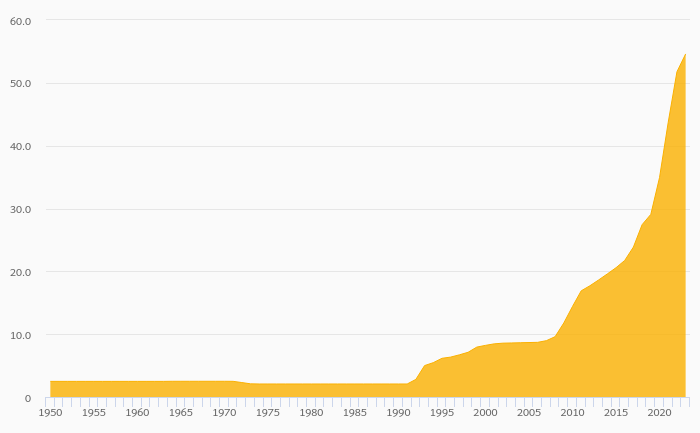
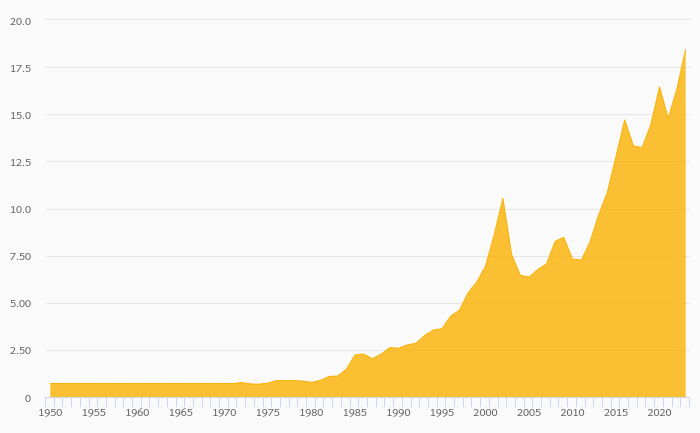
Erste Bank Serbia's customer loans reached RSD 110,473 mil in 2017, up 14.5% compared to the previous year. Serbian banking sector provided customer loans of RSD 2,702 bil in 2017, up 1.16% when compared to the last year. Erste Bank Serbia accounted for 4...
By Helgi Library - September 17, 2018
Erste Bank Serbia's retail deposits reached RSD 45,730 mil in 2017, up 13.2% compared to the previous year. Serbian banking sector accepted retail deposits of RSD 1,223 bil in 2017, up 1.09% when compared to the last year. Erste Bank Serbia accounted for ...
By Helgi Library - September 17, 2018
Erste Bank Serbia's net interest margin amounted to 4.02% in 2017, down from 4.46% compared to the previous year. Historically, the bank’s net interest margin reached an all time high of 6.49% in 2008 and an all time low of 4.02% in 2017. The average ma...
By Helgi Library - September 17, 2018
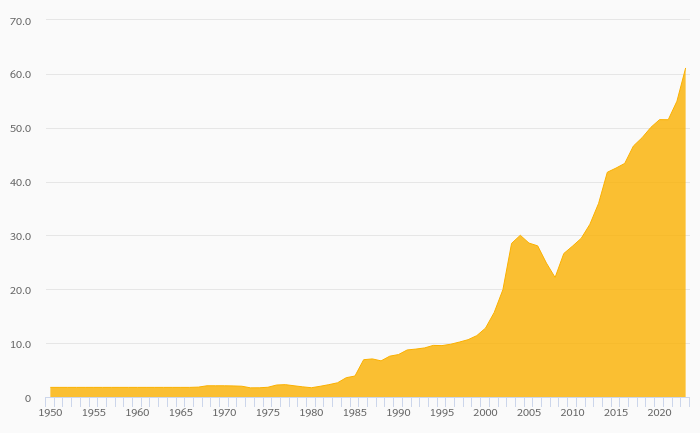
Erste Bank Serbia's corporate deposits reached RSD 46,252 mil in 2017, up 32.5% compared to the previous year. Serbian banking sector accepted corporate deposits of RSD 694 bil in 2017, up 6.26% when compared to the last year. Erste Bank Serbia accounted ...
By Helgi Library - September 17, 2018
Erste Bank Serbia's corporate loans reached RSD 62,701 mil in 2017, up 2.63% compared to the previous year. Serbian banking sector provided corporate loans of RSD 1,012 bil in 2017, up 0.160% when compared to the last year. Erste Bank Serbia accounted for...
By Helgi Library - September 17, 2018
Erste Bank Serbia's cost to income ratio reached 66.7% in 2017, up from 65.2% compared to the previous year. Historically, the bank’s costs reached an all time high of 91.4% of income in 2007 and an all time low of 65.1% in 2015. When compared to total ass...
By Helgi Library - September 17, 2018
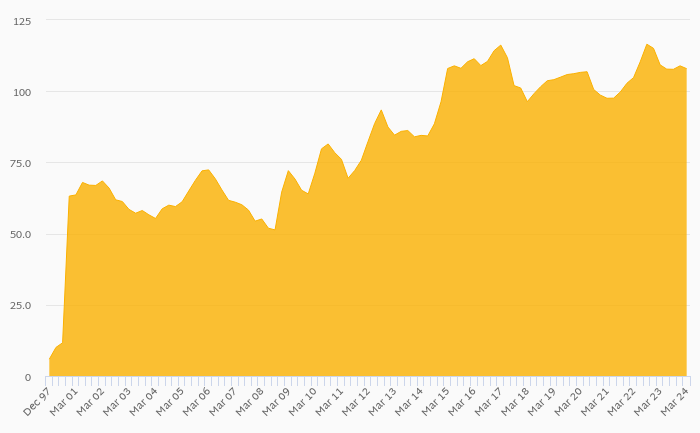
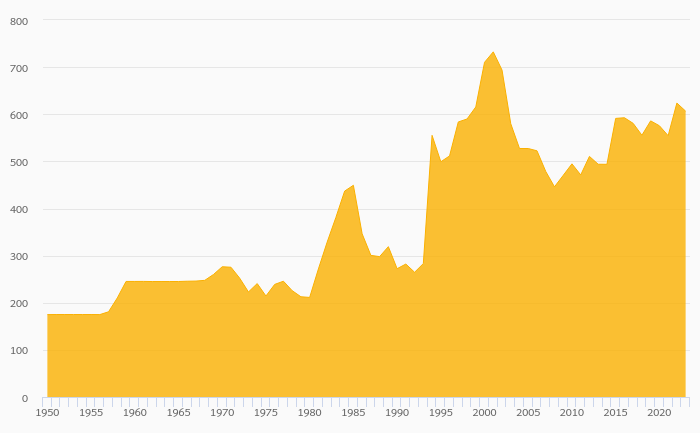
Erste Bank Serbia generated total banking revenues of RSD 8,653 mil in 2017, up 7.07% compared to the previous year. Serbian banking sector banking sector generated total revenues of RSD 197,856 mil in 2017, up 7.42% when compared to the last year. ...
By Helgi Library - September 17, 2018
Erste Bank Serbia generated total banking revenues of RSD 8,653 mil in 2017, up 7.07% compared to the previous year. Historically, the bank’s revenues containing of interest, fee and other non-interest income reached an all time high of RSD 12,373 mil in 2012 a...
By Helgi Library - September 17, 2018
Erste Bank Serbia's customer loan growth reached 14.5% in 2017, down from 22.0% compared to the previous year. Historically, the bank’s loans growth reached an all time high of 106% in 2007 and an all time low of -6.78% in 2013. In the last decade, the av...
Erste Bank Serbia is a Serbia-based subsidiary of Austria's Erste Bank. The Bank offers its financial products and services to private customers, small and medium size enterprises, and large corporates. At the end of 2014, the Bank had some 47 branches units, employed nearly 1,000 persons and held some 2.5% of Serbian banking assets. Erste Bank is the second largest commercial bank in Austria. In 1997, Erste Group went public with a strategy to expand its retail business into Central and Eastern Europe (CEE). Since then Erste Group's customer base has grown through numerous acquisitions and organic growth from 600,000 to around 16.4 million. With 2,900 branches and 46,000 employees, Erste Group is today one of the largest financial services providers in the Eastern part of EU in terms of clients and total assets.

Erste Bank Serbia has been growing its revenues and asset by 5.56% and 16.1% a year on average in the last 10 years. Its loans and deposits have grown by 16.9% and 13.7% a year during that time and loans to deposits ratio reached 120% at the end of 2017. The company achieved an average return on equity of 6.90% in the last decade with net profit growing 31.2% a year on average. In terms of operating efficiency, its cost to income ratio reached 66.7% in 2017, compared to 76.5% average in the last decade.
Equity represented 12.5% of total assets or 19.1% of loans at the end of 2017. Erste Bank Serbia's non-performing loans were 3.07% of total loans while provisions covered some 121% of NPLs at the end of 2017.
 Helgi Library