By Helgi Library - September 18, 2018
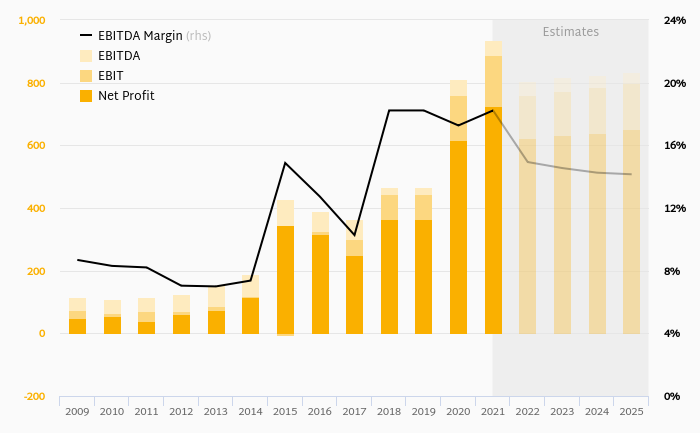
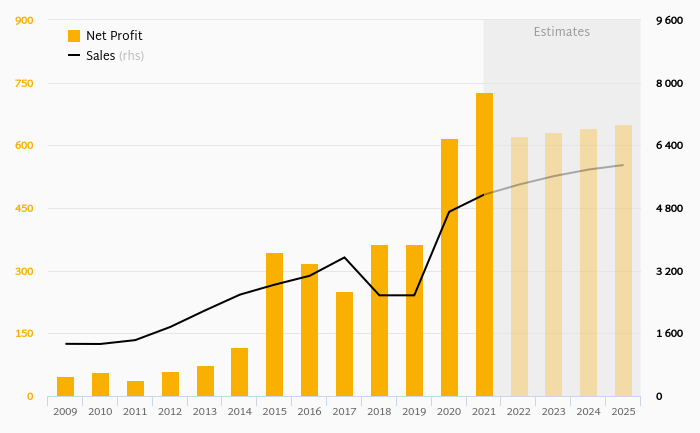
Societe Generale Serbia made a net profit of RSD 6,325 mil under revenues of RSD 13,928 mil in 2017, up 66.0% and 5.56% respectively ...
By Helgi Library - September 18, 2018
Societe Generale Serbia made a net profit of RSD 6,325 mil under revenues of RSD 13,928 mil in 2017, up 66.0% and 5.56% respectively ...
By Helgi Library - September 17, 2018
Societe Generale Serbia's mortgage loans reached RSD 62,305 mil in 2017, up 34.7% compared to the previous year. Serbian bankin...
| Profit Statement | 2015 | 2016 | 2017 | |
| Net Interest Income | RSD mil | 10,426 | 10,591 | 11,116 |
| Net Fee Income | RSD mil | 1,996 | 2,175 | 2,498 |
| Other Income | RSD mil | 784 | 428 | 313 |
| Total Revenues | RSD mil | 13,206 | 13,194 | 13,928 |
| Staff Cost | RSD mil | 3,285 | 3,372 | 3,456 |
| Operating Profit | RSD mil | 5,064 | 4,667 | 4,755 |
| Provisions | RSD mil | 2,938 | 525 | -2,302 |
| Net Profit | RSD mil | 2,137 | 3,811 | 6,325 |
| Balance Sheet | 2015 | 2016 | 2017 | |
| Interbank Loans | RSD mil | 9,103 | 6,425 | 2,223 |
| Customer Loans | RSD mil | 162,594 | 168,367 | 217,273 |
| Total Assets | RSD mil | 230,763 | 244,720 | 294,755 |
| Shareholders' Equity | RSD mil | 36,648 | 40,634 | 40,953 |
| Interbank Borrowing | RSD mil | 41,310 | 45,077 | 72,432 |
| Customer Deposits | RSD mil | 139,932 | 141,900 | 165,425 |
| Issued Debt Securities | RSD mil | 9,128 | 9,264 | 8,890 |
| Ratios | 2015 | 2016 | 2017 | |
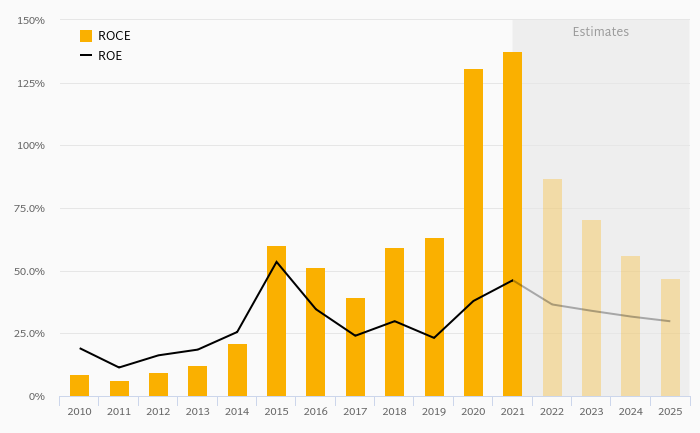
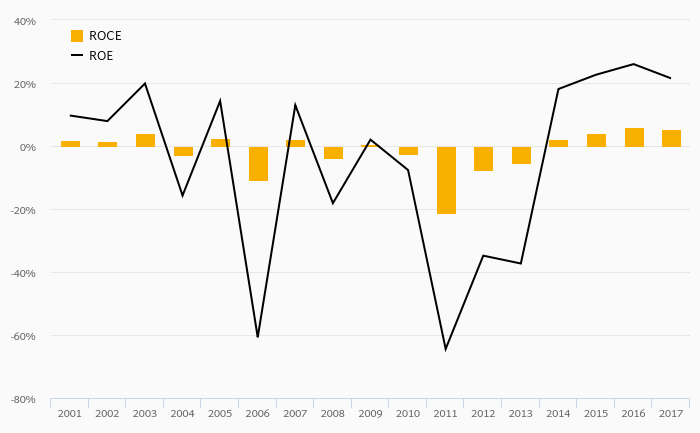
| ROE | % | 6.05 | 9.86 | 15.5 |
| ROA | % | 0.933 | 1.60 | 2.35 |
| Costs (As % Of Assets) | % | 3.55 | 3.59 | 3.40 |
| Costs (As % Of Income) | % | 61.7 | 64.6 | 65.9 |
| Capital Adequacy Ratio | % | 16.3 | 1,636 | 17.6 |
| Net Interest Margin | % | 4.55 | 4.45 | 4.12 |
| Loans (As % Of Deposits) | % | 116 | 119 | 131 |
| NPLs (As % Of Loans) | % | 18.0 | 16.5 | 10.2 |
| Provisions (As % Of NPLs) | % | 75.4 | 80.0 | 85.6 |
| Growth Rates | 2015 | 2016 | 2017 | |
| Total Revenue Growth | % | 13.0 | -0.094 | 5.56 |
| Operating Cost Growth | % | 21.8 | 4.72 | 7.58 |
| Operating Profit Growth | % | 1.18 | -7.84 | 1.88 |
| Net Profit Growth | % | 295 | 78.4 | 66.0 |
| Customer Loan Growth | % | 4.46 | 3.55 | 29.0 |
| Total Asset Growth | % | 1.51 | 6.05 | 20.4 |
| Customer Deposit Growth | % | 10.1 | 1.41 | 16.6 |
| Shareholders' Equity Growth | % | 7.98 | 10.9 | 0.784 |
| Employees | 1,349 | 1,400 | 1,451 | |
Get all company financials in excel:
| summary | Unit | 2007 | 2008 | 2009 | 2010 | 2011 | 2012 | 2013 | 2014 | 2015 | 2016 | 2017 |
| income statement | ||||||||||||
| Net Interest Income | RSD mil | 6,729 | 7,128 | 8,309 | 9,044 | 10,426 | ||||||
| Total Revenues | RSD mil | 20,877 | 27,538 | 11,166 | 11,692 | 13,206 | ||||||
| Operating Profit | RSD mil | 3,657 | 3,572 | 4,674 | 5,005 | 5,064 | ||||||
| Net Profit | RSD mil | 1,366 | 88.9 | -974 | 541 | 2,137 | ||||||
| balance sheet | ||||||||||||
| Interbank Loans | RSD mil | 39,984 | 18,893 | 13,650 | 10,190 | 9,103 | ||||||
| Customer Loans | RSD mil | 129,637 | 155,211 | 156,383 | 155,656 | 162,594 | ||||||
| Debt Securities | RSD mil | 9,951 | 12,556 | 13,916 | 23,713 | 27,982 | ||||||
| Total Assets | RSD mil | 192,381 | 206,588 | 224,154 | 227,321 | 230,763 | ||||||
| Shareholders' Equity | RSD mil | 33,843 | 33,991 | 33,169 | 33,941 | 36,648 | ||||||
| Interbank Borrowing | RSD mil | 40,580 | 50,900 | 57,107 | 46,330 | 41,310 | ||||||
| Customer Deposits | RSD mil | 101,518 | 112,743 | 115,313 | 127,042 | 139,932 | ||||||
| Issued Debt Securities | RSD mil | 0 | 1,700 | 15,542 | 16,294 | 9,128 | ||||||
| ratios | ||||||||||||
| ROE | % | 4.92 | 0.262 | -2.90 | 1.61 | 6.05 | ||||||
| ROA | % | 0.823 | 0.045 | -0.452 | 0.240 | 0.933 | ||||||
| Costs (As % Of Assets) | % | 10.4 | 12.0 | 3.01 | 2.96 | 3.55 | ||||||
| Costs (As % Of Income) | % | 82.5 | 87.0 | 58.1 | 57.2 | 61.7 | ||||||
| Capital Adequacy Ratio | % | ... | ... | ... | 18.9 | 18.0 | 20.1 | 15.6 | 16.3 | |||
| Net Interest Margin | % | 4.05 | 3.57 | 3.86 | 4.01 | 4.55 | ||||||
| Interest Income (As % Of Revenues) | % | 32.2 | 25.9 | 74.4 | 77.4 | 79.0 | ||||||
| Fee Income (As % Of Revenues) | % | 9.56 | 7.75 | 18.4 | 17.1 | 15.1 | ||||||
| Staff Cost (As % Of Total Cost) | % | 13.0 | 10.8 | 49.2 | 48.3 | 40.3 | ||||||
| Equity (As % Of Assets) | % | 17.6 | 16.5 | 14.8 | 14.9 | 15.9 | ||||||
| Loans (As % Of Deposits) | % | 128 | 138 | 136 | 123 | 116 | ||||||
| Loans (As % Assets) | % | 67.4 | 75.1 | 69.8 | 68.5 | 70.5 | ||||||
| NPLs (As % Of Loans) | % | ... | ... | ... | 7.96 | 7.81 | 11.0 | 20.4 | 18.0 | |||
| Provisions (As % Of NPLs) | % | ... | ... | ... | 36.2 | 51.0 | 91.6 | 61.7 | 75.4 | |||
| valuation | ||||||||||||
| Book Value Per Share Growth | % | ... | 22.2 | 5.92 | 16.6 | 8.85 | 15.3 |
| income statement | Unit | 2007 | 2008 | 2009 | 2010 | 2011 | 2012 | 2013 | 2014 | 2015 | 2016 | 2017 |
| income statement | ||||||||||||
| Interest Income | RSD mil | 11,568 | 13,377 | 14,642 | 14,770 | 14,311 | ||||||
| Interest Cost | RSD mil | 4,838 | 6,249 | 6,333 | 5,726 | 3,885 | ||||||
| Net Interest Income | RSD mil | 6,729 | 7,128 | 8,309 | 9,044 | 10,426 | ||||||
| Net Fee Income | RSD mil | 1,995 | 2,134 | 2,057 | 2,002 | 1,996 | ||||||
| Other Income | RSD mil | 12,152 | 18,276 | 800 | 645 | 784 | ||||||
| Total Revenues | RSD mil | 20,877 | 27,538 | 11,166 | 11,692 | 13,206 | ||||||
| Staff Cost | RSD mil | 2,231 | 2,589 | 3,191 | 3,230 | 3,285 | ||||||
| Depreciation | RSD mil | 447 | 445 | 448 | 463 | 432 | ||||||
| Other Cost | RSD mil | 14,541 | 20,933 | 2,853 | 2,993 | 4,424 | ||||||
| Operating Cost | RSD mil | 17,220 | 23,966 | 6,492 | 6,687 | 8,142 | ||||||
| Operating Profit | RSD mil | 3,657 | 3,572 | 4,674 | 5,005 | 5,064 | ||||||
| Provisions | RSD mil | 2,119 | 3,453 | 6,057 | 4,634 | 2,938 | ||||||
| Extra and Other Cost | RSD mil | -1.00 | < 0.001 | 0 | < -0.001 | 0 | ||||||
| Pre-Tax Profit | RSD mil | 1,539 | 119 | -1,383 | 371 | 2,126 | ||||||
| Tax | RSD mil | 172 | 29.8 | -409 | -170 | -10.3 | ||||||
| Minorities | RSD mil | 0 | 0 | 0 | 0 | 0 | ||||||
| Net Profit | RSD mil | 1,366 | 88.9 | -974 | 541 | 2,137 | ||||||
| growth rates | ||||||||||||
| Net Interest Income Growth | % | ... | 22.2 | 5.92 | 16.6 | 8.85 | 15.3 | |||||
| Net Fee Income Growth | % | ... | 10.1 | 6.94 | -3.61 | -2.64 | -0.306 | |||||
| Total Revenue Growth | % | ... | 29.0 | 31.9 | -59.5 | 4.71 | 13.0 | |||||
| Operating Cost Growth | % | ... | 31.5 | 39.2 | -72.9 | 3.00 | 21.8 | |||||
| Operating Profit Growth | % | ... | 18.4 | -2.33 | 30.9 | 7.09 | 1.18 | |||||
| Pre-Tax Profit Growth | % | ... | -13.2 | -92.3 | -1,264 | -127 | 473 | |||||
| Net Profit Growth | % | ... | -14.4 | -93.5 | -1,196 | -156 | 295 | |||||
| market share | ||||||||||||
| Market Share in Revenues | % | 12.7 | 16.3 | 6.86 | 6.69 | 7.20 | ||||||
| Market Share in Net Profit | % | 109 | 0.763 | ... | 23.8 | 28.7 | ||||||
| Market Share in Employees | % | ... | ... | ... | ... | 4.55 | 4.79 | 5.30 | 5.70 | 5.56 | ||
| Market Share in Branches | % | ... | ... | ... | 4.28 | 4.55 | 5.43 | 5.82 | 5.95 |
| balance sheet | Unit | 2007 | 2008 | 2009 | 2010 | 2011 | 2012 | 2013 | 2014 | 2015 | 2016 | 2017 |
| balance sheet | ||||||||||||
| Cash | RSD mil | 8,923 | 15,711 | 35,690 | 32,330 | 32,007 | ||||||
| Interbank Loans | RSD mil | 39,984 | 18,893 | 13,650 | 10,190 | 9,103 | ||||||
| Customer Loans | RSD mil | 129,637 | 155,211 | 156,383 | 155,656 | 162,594 | ||||||
| Retail Loans | RSD mil | ... | ... | ... | 38,730 | 45,822 | 57,968 | 65,681 | 70,844 | |||
| Mortgage Loans | RSD mil | ... | ... | ... | 20,804 | 26,264 | 35,586 | 40,536 | 42,826 | |||
| Consumer Loans | RSD mil | ... | ... | ... | 17,926 | 19,558 | 22,382 | 25,145 | 28,018 | |||
| Corporate Loans | RSD mil | ... | ... | ... | 84,641 | 103,199 | 90,563 | 81,605 | 83,639 | |||
| Debt Securities | RSD mil | 9,951 | 12,556 | 13,916 | 23,713 | 27,982 | ||||||
| Fixed Assets | RSD mil | 2,741 | 2,564 | 2,511 | 2,365 | 2,320 | ||||||
| Total Assets | RSD mil | 192,381 | 206,588 | 224,154 | 227,321 | 230,763 | ||||||
| Shareholders' Equity | RSD mil | 33,843 | 33,991 | 33,169 | 33,941 | 36,648 | ||||||
| Of Which Minority Interest | RSD mil | 0 | 0 | 0 | 0 | 0 | ||||||
| Liabilities | RSD mil | 158,537 | 172,597 | 190,985 | 193,380 | 194,115 | ||||||
| Interbank Borrowing | RSD mil | 40,580 | 50,900 | 57,107 | 46,330 | 41,310 | ||||||
| Customer Deposits | RSD mil | 101,518 | 112,743 | 115,313 | 127,042 | 139,932 | ||||||
| Retail Deposits | RSD mil | ... | ... | ... | ... | ... | ... | 59,546 | 61,122 | 63,121 | ||
| Corporate Deposits | RSD mil | ... | ... | ... | ... | ... | ... | 55,767 | 65,920 | 76,810 | ||
| Issued Debt Securities | RSD mil | 0 | 1,700 | 15,542 | 16,294 | 9,128 | ||||||
| Other Liabilities | RSD mil | 16,439 | 7,254 | 3,023 | 3,714 | 3,745 | ||||||
| asset quality | ||||||||||||
| Non-Performing Loans | RSD mil | ... | ... | ... | 10,625 | 12,630 | 19,122 | 36,316 | 33,856 | |||
| Gross Loans | RSD mil | ... | ... | 133,485 | 161,649 | 173,890 | 178,058 | 188,118 | ||||
| Total Provisions | RSD mil | ... | ... | 3,849 | 6,438 | 17,507 | 22,402 | 25,524 | ||||
| growth rates | ||||||||||||
| Customer Loan Growth | % | ... | 22.8 | 19.7 | 0.755 | -0.465 | 4.46 | |||||
| Retail Loan Growth | % | ... | ... | ... | ... | 15.9 | 18.3 | 26.5 | 13.3 | 7.86 | ||
| Mortgage Loan Growth | % | ... | ... | ... | ... | 20.0 | 26.2 | 35.5 | 13.9 | 5.65 | ||
| Consumer Loan Growth | % | ... | ... | ... | ... | 11.4 | 9.10 | 14.4 | 12.3 | 11.4 | ||
| Corporate Loan Growth | % | ... | ... | ... | ... | 32.8 | 21.9 | -12.2 | -9.89 | 2.49 | ||
| Total Asset Growth | % | ... | 37.7 | 7.39 | 8.50 | 1.41 | 1.51 | |||||
| Shareholders' Equity Growth | % | ... | 56.3 | 0.435 | -2.42 | 2.33 | 7.98 | |||||
| Customer Deposit Growth | % | ... | 102 | 11.1 | 2.28 | 10.2 | 10.1 | |||||
| Retail Deposit Growth | % | ... | ... | ... | ... | ... | ... | ... | 2.65 | 3.27 | ||
| Corporate Deposit Growth | % | ... | ... | ... | ... | ... | ... | ... | 18.2 | 16.5 | ||
| market share | ||||||||||||
| Market Share in Customer Loans | % | 6.52 | 6.90 | 7.08 | 6.53 | 6.45 | ||||||
| Market Share in Corporate Loans | % | ... | ... | ... | 8.32 | 9.22 | 8.94 | 8.41 | 8.43 | |||
| Market Share in Retail Loans | % | ... | ... | ... | 5.50 | 5.70 | 6.24 | 6.49 | 6.79 | |||
| Market Share in Consumer Loans | % | ... | ... | ... | 6.44 | 7.02 | 8.60 | 9.06 | 9.33 | |||
| Market Share in Mortgage Loans | % | ... | ... | ... | 7.54 | 8.48 | 11.3 | 12.0 | 12.4 | |||
| Market Share in Total Assets | % | 6.63 | 6.54 | 7.12 | 6.88 | 6.73 | ||||||
| Market Share in Customer Deposits | % | 7.32 | 7.36 | 7.23 | 7.40 | 7.65 | ||||||
| Market Share in Retail Deposits | % | ... | ... | ... | ... | ... | ... | 5.82 | 5.58 | 5.58 | ||
| Market Share in Corporate Deposits | % | ... | ... | ... | ... | ... | ... | 13.0 | 13.2 | 13.3 |
| ratios | Unit | 2007 | 2008 | 2009 | 2010 | 2011 | 2012 | 2013 | 2014 | 2015 | 2016 | 2017 |
| ratios | ||||||||||||
| ROE | % | 4.92 | 0.262 | -2.90 | 1.61 | 6.05 | ||||||
| ROA | % | 0.823 | 0.045 | -0.452 | 0.240 | 0.933 | ||||||
| Costs (As % Of Assets) | % | 10.4 | 12.0 | 3.01 | 2.96 | 3.55 | ||||||
| Costs (As % Of Income) | % | 82.5 | 87.0 | 58.1 | 57.2 | 61.7 | ||||||
| Capital Adequacy Ratio | % | ... | ... | ... | 18.9 | 18.0 | 20.1 | 15.6 | 16.3 | |||
| Net Interest Margin | % | 4.05 | 3.57 | 3.86 | 4.01 | 4.55 | ||||||
| Interest Spread | % | ... | 3.47 | 2.93 | 3.31 | 3.56 | 4.24 | |||||
| Asset Yield | % | 6.97 | 6.71 | 6.80 | 6.54 | 6.25 | ||||||
| Cost Of Liabilities | % | ... | 3.50 | 3.77 | 3.48 | 2.98 | 2.01 | |||||
| Interest Income (As % Of Revenues) | % | 32.2 | 25.9 | 74.4 | 77.4 | 79.0 | ||||||
| Fee Income (As % Of Revenues) | % | 9.56 | 7.75 | 18.4 | 17.1 | 15.1 | ||||||
| Other Income (As % Of Revenues) | % | 58.2 | 66.4 | 7.17 | 5.52 | 5.93 | ||||||
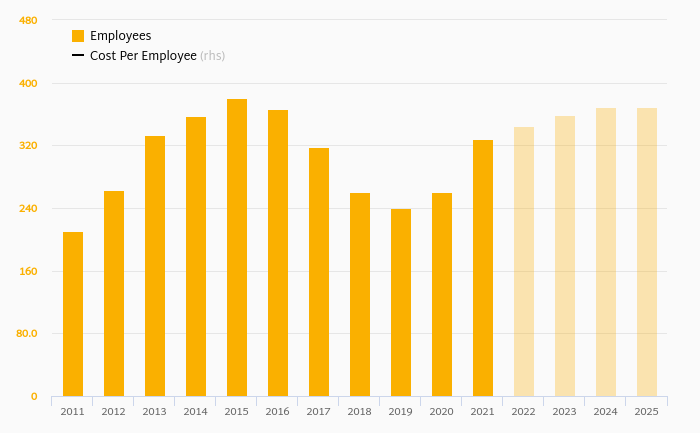
| Cost Per Employee | USD per month | ... | ... | ... | ... | 1,904 | 1,802 | 2,235 | 2,054 | 1,921 | ||
| Cost Per Employee (Local Currency) | RSD per month | ... | ... | ... | ... | 139,703 | 158,509 | 190,336 | 188,123 | 202,931 | ||
| Staff Cost (As % Of Total Cost) | % | 13.0 | 10.8 | 49.2 | 48.3 | 40.3 | ||||||
| Equity (As % Of Assets) | % | 17.6 | 16.5 | 14.8 | 14.9 | 15.9 | ||||||
| Loans (As % Of Deposits) | % | 128 | 138 | 136 | 123 | 116 | ||||||
| Loans (As % Assets) | % | 67.4 | 75.1 | 69.8 | 68.5 | 70.5 | ||||||
| NPLs (As % Of Loans) | % | ... | ... | ... | 7.96 | 7.81 | 11.0 | 20.4 | 18.0 | |||
| Provisions (As % Of NPLs) | % | ... | ... | ... | 36.2 | 51.0 | 91.6 | 61.7 | 75.4 | |||
| Provisions (As % Of Loans) | % | ... | ... | 2.97 | 4.15 | 11.2 | 14.4 | 15.7 | ||||
| Cost of Provisions (As % Of Loans) | % | 1.80 | 2.42 | 3.89 | 2.97 | 1.85 |
Get all company financials in excel:


By Helgi Library - September 17, 2018
Societe Generale Serbia's mortgage loans reached RSD 62,305 mil in 2017, up 34.7% compared to the previous year. Serbian banking sector provided mortgage loans of RSD 356 bil in 2017, down 1.10% when compared to the last year. Societe Generale Serbia acco...
By Helgi Library - September 17, 2018
Societe Generale Serbia's customer loans reached RSD 217,273 mil in 2017, up 29.0% compared to the previous year. Serbian banking sector provided customer loans of RSD 2,702 bil in 2017, up 1.16% when compared to the last year. Societe Generale Serbia acc...
By Helgi Library - September 17, 2018
Societe Generale Serbia's customer loans reached RSD 217,273 mil in 2017, up 29.0% compared to the previous year. Serbian banking sector provided customer loans of RSD 2,702 bil in 2017, up 1.16% when compared to the last year. Societe Generale Serbia acc...
By Helgi Library - September 17, 2018
Societe Generale Serbia employed 1,451 persons in 2017, up 3.64% when compared to the previous year. Historically, the bank's workforce hit an all time high of 1,451 persons in 2017 and an all time low of 1,331 in 2011. Average cost reached USD 1,842 per month pe...
By Helgi Library - September 17, 2018
Societe Generale Serbia's customer deposits reached RSD 165,425 mil in 2017, up 16.6% compared to the previous year. Serbian banking sector accepted customer deposits of RSD 2,111 bil in 2017, up 3.62% when compared to the last year. Societe Generale Serb...
By Helgi Library - September 17, 2018
Societe Generale Serbia's customer deposits reached RSD 165,425 mil in 2017, up 16.6% compared to the previous year. Serbian banking sector accepted customer deposits of RSD 2,111 bil in 2017, up 3.62% when compared to the last year. Societe Generale Serb...
By Helgi Library - September 18, 2018
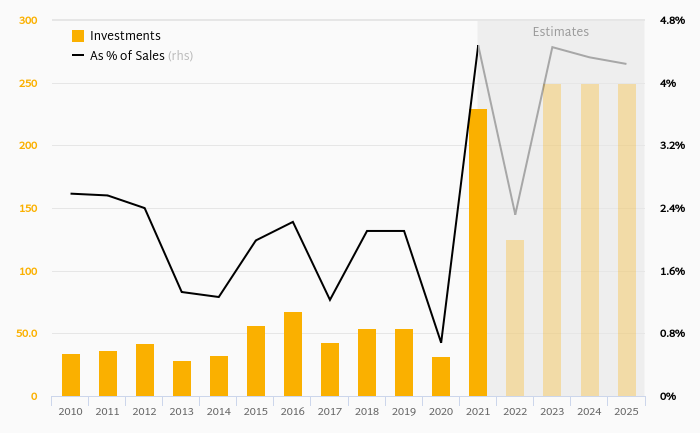
Societe Generale Serbia's loans reached RSD 238,082 mil in the 2017, up from RSD 193,986 mil compared to the previous year. Historically, the bank’s loans reached an all time high of RSD 238,082 mil in 2017 and an all time low of RSD 108,234 mil in 2010. ...
By Helgi Library - September 18, 2018
Societe Generale Serbia's loans reached RSD 238,082 mil in the 2017, up from RSD 193,986 mil compared to the previous year. Historically, the bank’s loans reached an all time high of RSD 238,082 mil in 2017 and an all time low of RSD 108,234 mil in 2010. ...
By Helgi Library - September 17, 2018
Societe Generale Serbia's consumer loans reached RSD 45,763 mil in 2017, up 33.1% compared to the previous year. Serbian banking sector provided consumer loans of RSD 548 bil in 2017, up 14.5% when compared to the last year. Societe Generale Serbia accoun...
Société Générale Banka Srbija (or Société Générale Serbia) is a Serbia-based universal bank with a market share of around 7%. The Bank offers its financial products and services to private customers, small and medium size enterprises, and large corporates. The Bank's deposit products include fixed deposits, fixed foreign exchange deposits, current accounts, and savings accounts. The Bank’s loan portfolio primarily comprises personal, mortgage, housing, investment and real estate project financing loans, as well as overdrafts, trade finance, and credit guarantees. At the end of 2013, the Bank operated through 108 branches and employed nearly 1,400 persons. The Bank was founded in 1990 and is headquartered in Novi Beograd, Serbia. "Société Générale Banka Srbija" a.d. Beograd is a subsidiary of Societe Generale Group.

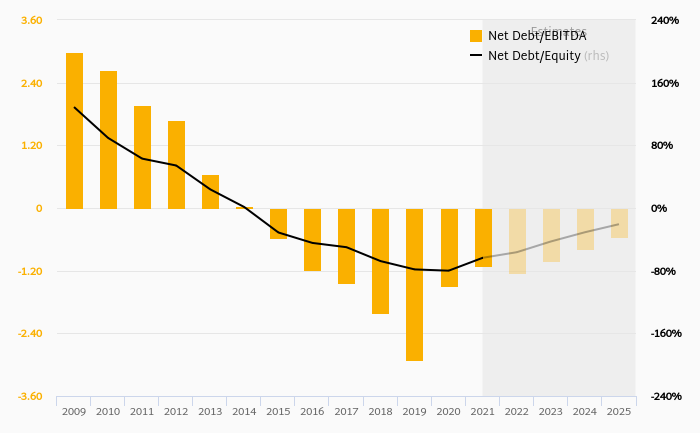
Societe Generale Serbia has been growing its revenues and asset by -12.7% and 7.37% a year on average in the last 5 years. Its loans and deposits have grown by 6.96% and 7.97% a year during that time and loans to deposits ratio reached 131% at the end of 2017. The company achieved an average return on equity of 6.03% in the last five years with net profit growing 135% a year on average. In terms of operating efficiency, its cost to income ratio reached 65.9% in 2017, compared to 61.5% average in the last five years.
Equity represented 13.9% of total assets or 18.8% of loans at the end of 2017. Societe Generale Serbia's non-performing loans were 10.2% of total loans while provisions covered some 85.6% of NPLs at the end of 2017.
 Helgi Library