By Helgi Library - August 29, 2022
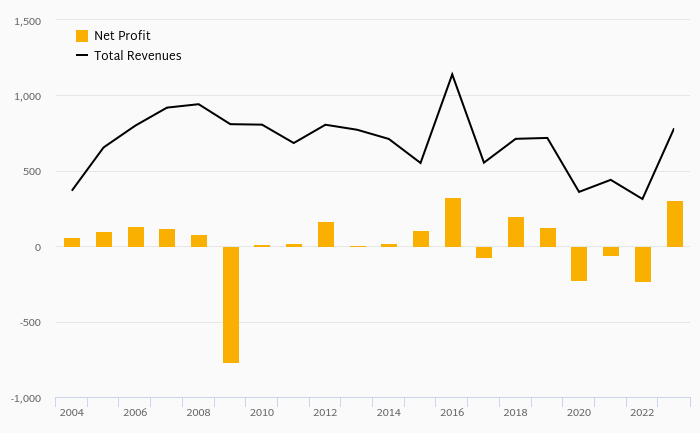
KORE made a net profit of USD -24.5 mil with revenues of USD 248 mil in 2021, up by 30.5% and up by 16.1%, respecti...
By Helgi Library - August 29, 2022
KORE stock traded at USD 6.74 per share at the end 2021 translating into a market capitalization of USD 283 mil. Since the end of...
By Helgi Library - August 29, 2022
KORE made a net profit of USD -24.5 mil with revenues of USD 248 mil in 2021, up by 30.5% and up by 16.1%, respectively, com...
| Profit Statement | 2025 | 2026 | 2027 | |
| Sales | USD mil | 337 | 364 | 390 |
| Gross Profit | USD mil | 186 | 203 | 219 |
| EBITDA | USD mil | 85.5 | 94.5 | 104 |
| EBIT | USD mil | 26.9 | 51.5 | 65.5 |
| Financing Cost | USD mil | ... | ... | ... |
| Pre-Tax Profit | USD mil | -0.742 | 24.6 | 39.4 |
| Net Profit | USD mil | -0.556 | 18.4 | 29.5 |
| Dividends | USD mil | 0 | 0 | 0 |
| Balance Sheet | 2025 | 2026 | 2027 | |
| Total Assets | USD mil | 814 | 829 | 845 |
| Non-Current Assets | USD mil | 674 | 694 | 715 |
| Current Assets | USD mil | 140 | 135 | 130 |
| Working Capital | USD mil | 37.9 | 40.2 | 42.6 |
| Shareholders' Equity | USD mil | 163 | 181 | 210 |
| Liabilities | USD mil | 651 | 648 | 635 |
| Total Debt | USD mil | 343 | 328 | 313 |
| Net Debt | USD mil | 297 | 292 | 287 |
| Ratios | 2025 | 2026 | 2027 | |
| ROE | % | -0.341 | 10.7 | 15.1 |
| ROCE | % | -0.079 | 2.55 | 3.96 |
| Gross Margin | % | 55.2 | 55.7 | 56.1 |
| EBITDA Margin | % | 25.4 | 26.0 | 26.7 |
| EBIT Margin | % | 7.98 | 14.1 | 16.8 |
| Net Margin | % | -0.165 | 5.05 | 7.56 |
| Net Debt/EBITDA | 3.48 | 3.09 | 2.76 | |
| Net Debt/Equity | % | 183 | 161 | 136 |
| Cost of Financing | % | ... | ... | ... |
| Valuation | 2025 | 2026 | 2027 | |
| Market Capitalisation | USD mil | 231 | 231 | 231 |
| Enterprise Value (EV) | USD mil | 528 | 523 | 518 |
| Number Of Shares | mil | 76.2 | 76.2 | 76.2 |
| Share Price | USD | 3.03 | 3.03 | 3.03 |
| EV/EBITDA | 6.18 | 5.54 | 4.98 | |
| EV/Sales | 1.57 | 1.44 | 1.33 | |
| Price/Earnings (P/E) | -415 | 12.6 | 7.83 | |
| Price/Book Value (P/BV) | 1.42 | 1.28 | 1.10 | |
| Dividend Yield | % | 0 | 0 | 0 |
Get all company financials in excel:
| overview | Unit | 2019 | 2020 | 2021 | 2022 | 2023 | 2024 | 2025 | 2026 | 2027 |
| income statement | ||||||||||
| Sales | USD mil | 169 | 214 | 248 | ||||||
| Gross Profit | USD mil | 105 | 116 | 126 | ||||||
| EBIT | USD mil | -7.94 | -9.54 | -16.2 | ||||||
| Net Profit | USD mil | -23.4 | -35.2 | -24.5 | ||||||
| ROE | % | ... | -174 | -16.7 | ||||||
| EBIT Margin | % | -4.70 | -4.46 | -6.51 | ||||||
| Net Margin | % | -13.9 | -16.5 | -9.85 | ||||||
| balance sheet | ||||||||||
| Total Assets | USD mil | ... | 700 | 760 | ||||||
| Non-Current Assets | USD mil | ... | 638 | 598 | ||||||
| Current Assets | USD mil | ... | 62.3 | 161 | ||||||
| Shareholders' Equity | USD mil | ... | 20.2 | 272 | ||||||
| Liabilities | USD mil | ... | 680 | 487 | ||||||
| Non-Current Liabilities | USD mil | ... | 628 | 439 | ||||||
| Current Liabilities | USD mil | ... | 52.2 | 48.2 | ||||||
| Net Debt/EBITDA | ... | -0.045 | 9.25 | |||||||
| Net Debt/Equity | % | ... | -9.58 | 116 | ||||||
| Cost of Financing | % | ... | ... | 6.44 | ... | ... | ... | ... | ... | ... |
| cash flow | ||||||||||
| Total Cash From Operations | USD mil | 14.3 | 26.5 | -14.8 | ||||||
| Total Cash From Investing | USD mil | -50.4 | -11.6 | -13.4 | ||||||
| Total Cash From Financing | USD mil | 37.0 | -12.7 | 104 | ||||||
| Net Change In Cash | USD mil | 0.881 | 2.15 | 75.9 | ||||||
| valuation | ||||||||||
| Market Capitalisation | USD mil | ... | 516 | 283 | ||||||
| Enterprise Value (EV) | USD mil | ... | 514 | 600 | ||||||
| Number Of Shares | mil | 71.8 | 71.8 | 41.9 | ||||||
| Share Price | USD | ... | 7.18 | 6.74 | ||||||
| Price/Earnings (P/E) | ... | -14.6 | -11.6 | |||||||
| Price/Cash Earnings (P/CE) | ... | 29.8 | 10.9 | |||||||
| EV/EBITDA | ... | 12.0 | 17.5 | |||||||
| Price/Book Value (P/BV) | ... | 25.5 | 1.04 | |||||||
| Dividend Yield | % | ... | 0 | 0 |
| income statement | Unit | 2019 | 2020 | 2021 | 2022 | 2023 | 2024 | 2025 | 2026 | 2027 |
| income statement | ||||||||||
| Sales | USD mil | 169 | 214 | 248 | ||||||
| Cost of Goods & Services | USD mil | 63.7 | 97.9 | 122 | ||||||
| Gross Profit | USD mil | 105 | 116 | 126 | ||||||
| Selling, General & Admin | USD mil | 65.3 | 72.9 | 91.7 | ... | ... | ... | ... | ... | ... |
| Other Operating Expense | USD mil | ... | ... | 0 | ... | ... | ... | ... | ... | ... |
| Other Operating Cost (Income) | USD mil | ... | ... | 0 | ... | ... | ... | ... | ... | ... |
| EBITDA | USD mil | 40.2 | 42.9 | 34.3 | ||||||
| Depreciation | USD mil | 48.1 | 52.5 | 50.4 | ||||||
| EBIT | USD mil | -7.94 | -9.54 | -16.2 | ||||||
| Net Financing Cost | USD mil | 28.4 | 31.0 | 23.3 | ||||||
| Financing Cost | USD mil | ... | ... | 23.3 | ... | ... | ... | ... | ... | ... |
| Financing Income | USD mil | ... | ... | 0 | ... | ... | ... | ... | ... | ... |
| FX (Gain) Loss | USD mil | ... | ... | 0.344 | ... | ... | ... | ... | ... | ... |
| Extraordinary Cost | USD mil | ... | ... | 0 | ... | ... | ... | ... | ... | ... |
| Pre-Tax Profit | USD mil | -36.4 | -40.5 | -34.1 | ||||||
| Tax | USD mil | -12.9 | -5.32 | -9.69 | ||||||
| Minorities | USD mil | 0 | 0 | 0 | ||||||
| Net Profit | USD mil | -23.4 | -35.2 | -24.5 | ||||||
| Net Profit Avail. to Common | USD mil | -23.4 | -35.2 | -24.5 | ||||||
| Dividends | USD mil | 0 | 0 | 0 | ||||||
| growth rates | ||||||||||
| Total Revenue Growth | % | ... | 26.4 | 16.1 | ||||||
| EBITDA Growth | % | ... | 6.86 | -20.2 | ||||||
| EBIT Growth | % | ... | 20.1 | 69.3 | ||||||
| Pre-Tax Profit Growth | % | ... | 11.4 | -15.7 | ||||||
| Net Profit Growth | % | ... | 50.2 | -30.5 | ||||||
| ratios | ||||||||||
| ROE | % | ... | -174 | -16.7 | ||||||
| ROA | % | ... | -5.03 | -3.35 | ||||||
| ROCE | % | ... | ... | -3.84 | ||||||
| Gross Margin | % | 62.4 | 54.2 | 50.8 | ||||||
| EBITDA Margin | % | 23.8 | 20.1 | 13.8 | ||||||
| EBIT Margin | % | -4.70 | -4.46 | -6.51 | ||||||
| Net Margin | % | -13.9 | -16.5 | -9.85 | ||||||
| Payout Ratio | % | 0 | 0 | 0 | ||||||
| Cost of Financing | % | ... | ... | 6.44 | ... | ... | ... | ... | ... | ... |
| Net Debt/EBITDA | ... | -0.045 | 9.25 |
| balance sheet | Unit | 2019 | 2020 | 2021 | 2022 | 2023 | 2024 | 2025 | 2026 | 2027 |
| balance sheet | ||||||||||
| Cash & Cash Equivalents | USD mil | ... | 10.3 | 86.0 | ||||||
| Receivables | USD mil | ... | 40.7 | 52.3 | ||||||
| Inventories | USD mil | ... | 5.84 | 15.5 | ||||||
| Other ST Assets | USD mil | ... | 0.726 | 8.40 | ||||||
| Current Assets | USD mil | ... | 62.3 | 161 | ||||||
| Property, Plant & Equipment | USD mil | ... | 13.7 | 12.2 | ||||||
| LT Investments & Receivables | USD mil | ... | 0 | 0 | ||||||
| Intangible Assets | USD mil | ... | 623 | 585 | ||||||
| Goodwill | USD mil | ... | 0 | 382 | ||||||
| Non-Current Assets | USD mil | ... | 638 | 598 | ||||||
| Total Assets | USD mil | ... | 700 | 760 | ||||||
| Trade Payables | USD mil | ... | 40.4 | 37.8 | ||||||
| Short-Term Debt | USD mil | ... | 4.02 | 3.52 | ||||||
| Other ST Liabilities | USD mil | ... | 7.77 | 6.89 | ||||||
| Current Liabilities | USD mil | ... | 52.2 | 48.2 | ||||||
| Long-Term Debt | USD mil | ... | 315 | 400 | ||||||
| Other LT Liabilities | USD mil | ... | 313 | 39.6 | ||||||
| Non-Current Liabilities | USD mil | ... | 628 | 439 | ||||||
| Liabilities | USD mil | ... | 680 | 487 | ||||||
| Preferred Equity and Hybrid Capital | USD mil | ... | 0 | 0 | ||||||
| Share Capital | USD mil | ... | 252 | 414 | ||||||
| Treasury Stock | USD mil | ... | 0 | 0 | ||||||
| Equity Before Minority Interest | USD mil | ... | 20.2 | 272 | ||||||
| Minority Interest | USD mil | ... | 0 | 0 | ||||||
| Equity | USD mil | ... | 20.2 | 272 | ||||||
| growth rates | ||||||||||
| Total Asset Growth | % | ... | ... | 8.51 | ||||||
| Shareholders' Equity Growth | % | ... | ... | 1,246 | ||||||
| Net Debt Growth | % | ... | ... | -16,470 | ||||||
| Total Debt Growth | % | ... | ... | 26.4 | ||||||
| ratios | ||||||||||
| Total Debt | USD mil | ... | 319 | 403 | ||||||
| Net Debt | USD mil | ... | -1.94 | 317 | ||||||
| Working Capital | USD mil | ... | 6.07 | 29.9 | ||||||
| Capital Employed | USD mil | ... | 644 | 628 | ||||||
| Net Debt/Equity | % | ... | -9.58 | 116 | ||||||
| Current Ratio | ... | 1.19 | 3.34 | |||||||
| Quick Ratio | ... | 0.976 | 2.87 |
| cash flow | Unit | 2019 | 2020 | 2021 | 2022 | 2023 | 2024 | 2025 | 2026 | 2027 |
| cash flow | ||||||||||
| Net Profit | USD mil | -23.4 | -35.2 | -24.5 | ||||||
| Depreciation | USD mil | 48.1 | 52.5 | 50.4 | ||||||
| Non-Cash Items | USD mil | ... | ... | -7.39 | ||||||
| Change in Working Capital | USD mil | ... | ... | -33.3 | ||||||
| Total Cash From Operations | USD mil | 14.3 | 26.5 | -14.8 | ||||||
| Capital Expenditures | USD mil | -50.4 | -11.6 | -13.4 | ||||||
| Net Change in LT Investment | USD mil | ... | ... | 0 | ... | ... | ... | ... | ... | ... |
| Net Cash From Acquisitions | USD mil | ... | ... | 0 | ... | ... | ... | ... | ... | ... |
| Other Investing Activities | USD mil | ... | ... | 0 | ... | ... | ... | ... | ... | ... |
| Total Cash From Investing | USD mil | -50.4 | -11.6 | -13.4 | ||||||
| Dividends Paid | USD mil | 0 | 0 | 0 | ||||||
| Issuance Of Shares | USD mil | -0.080 | -0.200 | -230 | ||||||
| Issuance Of Debt | USD mil | 39.2 | -12.5 | 114 | ||||||
| Other Financing Activities | USD mil | ... | ... | -5.42 | ... | ... | ... | ... | ... | ... |
| Total Cash From Financing | USD mil | 37.0 | -12.7 | 104 | ||||||
| Effect of FX Rates | USD mil | ... | ... | -0.226 | ... | ... | ... | ... | ... | ... |
| Net Change In Cash | USD mil | 0.881 | 2.15 | 75.9 | ||||||
| ratios | ||||||||||
| Days Sales Outstanding | days | ... | 69.4 | 76.8 | ||||||
| Days Sales Of Inventory | days | ... | 21.8 | 46.2 | ||||||
| Days Payable Outstanding | days | ... | 151 | 113 | ||||||
| Cash Conversion Cycle | days | ... | -59.5 | 10.2 | ||||||
| Cash Earnings | USD mil | 24.7 | 17.3 | 26.0 | ||||||
| Free Cash Flow | USD mil | -36.1 | 14.9 | -28.2 | ||||||
| Capital Expenditures (As % of Sales) | % | 29.8 | 5.43 | 5.41 |
| other ratios | Unit | 2019 | 2020 | 2021 | 2022 | 2023 | 2024 | 2025 | 2026 | 2027 |
| Operating Cost (As % of Sales) | % | ... | ... | 57.3 | ... | ... | ... | ... | ... | ... |
| Effective Tax Rate | % | 35.6 | 13.1 | 28.4 | ||||||
| Total Revenue Growth (5-year average) | % | ... | ... | ... | ... | ... |
| valuation | Unit | 2019 | 2020 | 2021 | 2022 | 2023 | 2024 | 2025 | 2026 | 2027 |
| Market Capitalisation | USD mil | ... | 516 | 283 | ||||||
| Enterprise Value (EV) | USD mil | ... | 514 | 600 | ||||||
| Number Of Shares | mil | 71.8 | 71.8 | 41.9 | ||||||
| Share Price | USD | ... | 7.18 | 6.74 | ||||||
| EV/EBITDA | ... | 12.0 | 17.5 | |||||||
| Price/Earnings (P/E) | ... | -14.6 | -11.6 | |||||||
| Price/Cash Earnings (P/CE) | ... | 29.8 | 10.9 | |||||||
| P/FCF | ... | 34.7 | -10.0 | |||||||
| Price/Book Value (P/BV) | ... | 25.5 | 1.04 | |||||||
| Dividend Yield | % | ... | 0 | 0 | ||||||
| Free Cash Flow Yield | % | ... | 2.88 | -9.97 | ||||||
| Earnings Per Share (EPS) | USD | -0.326 | -0.490 | -0.583 | ||||||
| Cash Earnings Per Share | USD | 0.344 | 0.241 | 0.619 | ||||||
| Free Cash Flow Per Share | USD | -0.503 | 0.207 | -0.672 | ||||||
| Book Value Per Share | USD | ... | 0.282 | 6.49 | ||||||
| Dividend Per Share | USD | 0 | 0 | 0 | ||||||
| EV/Sales | ... | 2.40 | 2.42 | |||||||
| EV/EBIT | ... | -53.8 | -37.1 | |||||||
| EV/Free Cash Flow | ... | 34.5 | -21.3 | |||||||
| EV/Capital Employed | ... | 0.798 | 0.954 | |||||||
| Earnings Per Share Growth | % | ... | 50.2 | 19.0 | ||||||
| Cash Earnings Per Share Growth | % | ... | -30.0 | 157 | ||||||
| Book Value Per Share Growth | % | ... | ... | 2,205 |
Get all company financials in excel:


By Helgi Library - August 29, 2022
KORE made a net profit of USD -24.5 mil in 2021, up 30.5% compared to the previous year. Historically, between 2019 and 2021, the company's net profit reached a high of USD -23.4 mil in 2019 and a low of USD -35.2 mil in 2020. The result implies a return ...
By Helgi Library - August 29, 2022
KORE's net debt stood at USD 317 mil and accounted for 116% of equity at the end of 2021. The ratio is up 126 pp compared to the previous year. Historically, the firm’s net debt to equity reached a high of 116% in 2021 and a low of -9.58% ...
By Helgi Library - August 29, 2022
KORE stock traded at USD 6.74 per share at the end 2021 translating into a market capitalization of USD 283 mil. Since the end of 2016, the stock has appreciated by 0% representing an annual average growth of %. At the end of 2021, the firm traded at pri...
By Helgi Library - August 29, 2022
KORE invested a total of USD 13.4 mil in 2021, up 15.7% compared to the previous year. Historically, between 2019 - 2021, the company's investments stood at a high of USD 50.4 mil in 2019 and a low of USD 11.6 mil in 2020. As a percen...
By Helgi Library - August 29, 2022
KORE stock traded at USD 6.74 per share at the end 2021 implying a market capitalization of USD 283 mil. Since the end of 2016, stock has appreciated by % implying an annual average growth of % In absolute terms, the value of the company rose by USD ...

KORE has been growing its sales by 7.97% a year on average in the last 5 years. EBITDA has grown on average by 10.6% a year during that time to total of USD 104 mil in 2027, or 26.7% of sales. That’s compared to 25.8% average margin seen in last five years.
The company netted USD 29.5 mil in 2027 implying ROE of 15.1% and ROCE of 3.96%. Again, the average figures were 0.792% and -0.090%, respectively when looking at the previous 5 years.
KORE’s net debt amounted to USD 287 mil at the end of 2027, or 136% of equity. When compared to EBITDA, net debt was 2.76x, down when compared to average of 3.44x seen in the last 5 years.
KORE stock traded at USD 3.03 per share at the end of 2027 resulting in a market capitalization of USD 231 mil. Over the previous five years, stock price grew by 0% or 0% a year on average. The closing price put stock at a 12-month trailing EV/EBITDA of 4.98x and price to earnings (PE) of 7.83x as of 2027.
 Helgi Library