By Helgi Library - April 2, 2020
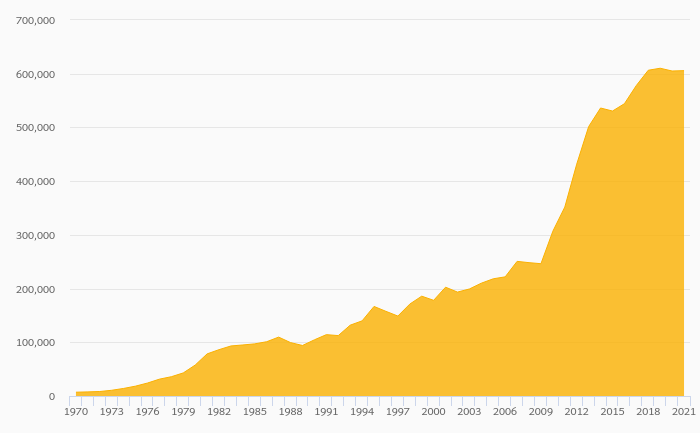
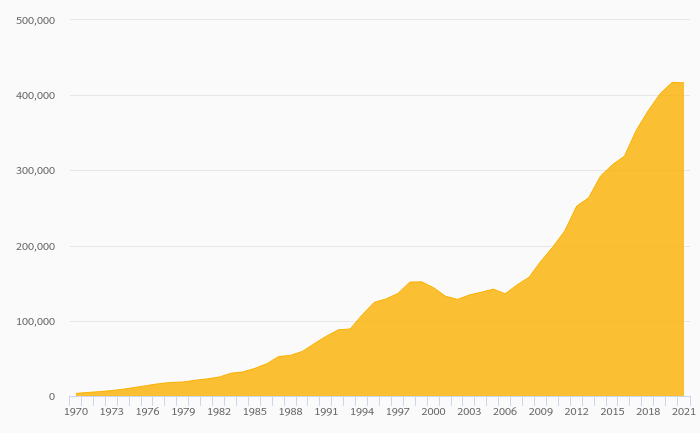
Microsoft Corporation's total assets reached USD 286,556 mil at the end of 2019, up 10.7% compared to the previous year. ...
By Helgi Library - October 12, 2020
Microsoft Corporation's total assets reached USD 286,556 mil at the end of 2Q2019, up 10.7% compared to the previous year. ...
| Profit Statement |
| Balance Sheet |
| Ratios |
| Valuation |
Get all company financials in excel:
Get all company financials in excel:

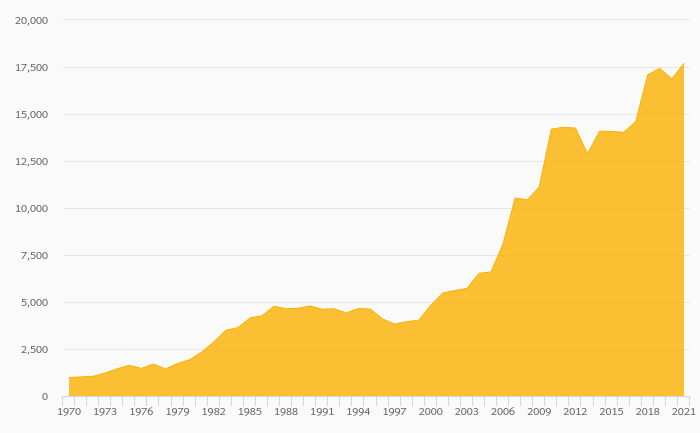


Microsoft Corporation has been growing its sales by a year on average in the last 5 years. EBITDA has grown on average by 10.6% a year during that time to total of USD 54,641 mil in 2019, or 43.4% of sales. That’s compared to 35.8% average margin seen in last five years.
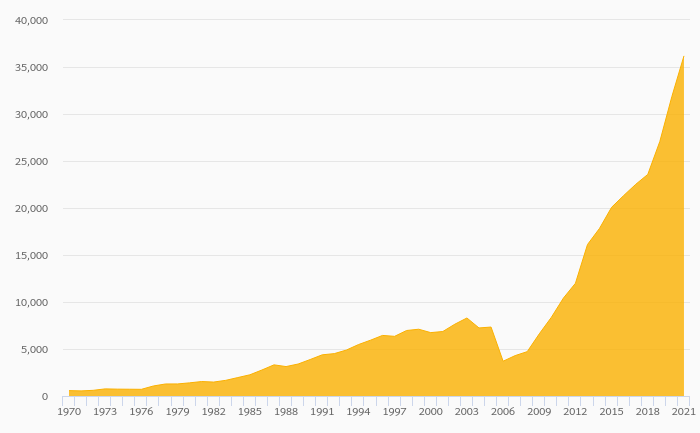
The company netted USD 39,240 mil in 2019 implying ROE of 42.4% and ROCE of 32.3%. Again, the average figures were 27.1% and 24.5%, respectively when looking at the previous 5 years.
Microsoft Corporation’s net debt amounted to USD 60,822 mil at the end of 2019, or 0.594% of equity. When compared to EBITDA, net debt was 1.11x, down when compared to average of 1.52x seen in the last 5 years.
Microsoft Corporation stock traded at USD 136 per share at the end of 2019 resulting in a market capitalization of USD 1,054,410 mil. Over the previous five years, stock price grew by 237% or 27.5% a year on average. The closing price put stock at a 12-month trailing EV/EBITDA of 20.4x and price to earnings (PE) of 26.9x as of 2019.
 Helgi Library