By Helgi Library - September 30, 2020
Navistar International made a net profit of USD -37.2 mil with revenues of USD 1,752 mil in 2Q2020, down by 143% and down...
By Helgi Library - November 11, 2020
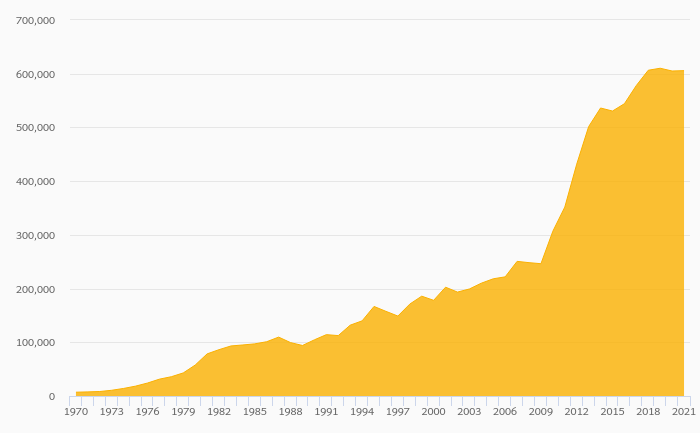
Navistar International's total assets reached USD 6,596 mil at the end of 2Q2020, down 8.61% compared to the previous year. ...
By Helgi Library - November 11, 2020
Navistar International generated sales of USD 1,752 mil in 2Q2020, down 42.1% compared to the previous year. Historically, ...
| Profit Statement |
| Balance Sheet |
| Ratios |
| Valuation |
Get all company financials in excel:
Get all company financials in excel:


By Helgi Library - September 30, 2020
Navistar International's operating cash flow stood at USD 93.4 mil in 2Q2020, down 55.9% when compared to the previous year. Historically, between 1Q1990 - 2Q2020, the firm’s operating cash flow reached a high of USD 557 mil in 2Q2008 and a low of USD ...
By Helgi Library - September 30, 2020
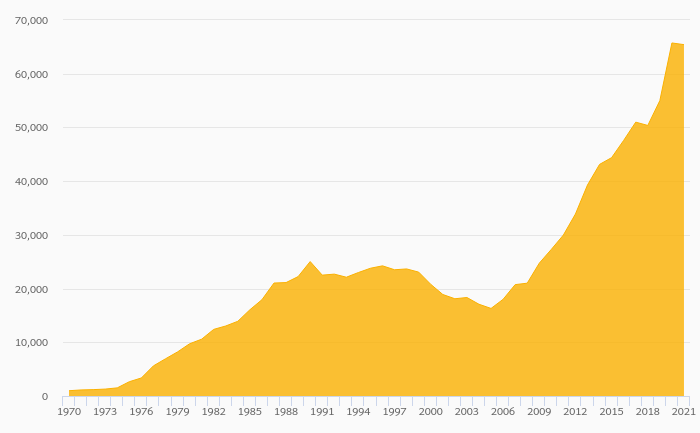
Navistar International made a net profit of USD 174 mil with revenues of 10,656 in 2019, down by 59% and down by 1.13%, respectively, compared to the previous year. This translates into a net margin of 1.63%. Historically, between 1987 - 2019, th...
By Helgi Library - September 30, 2020
Navistar International stock traded at USD 31.3 per share at the end 2019 translating into a market capitalization of USD 3,103 mil. Since the end of 2014, stock has depreciated by 11.6% representing an annual average growth of -2.43%. In absolute terms...
By Helgi Library - September 30, 2020
Navistar International made a net profit of USD 174 mil with revenues of USD 10,656 mil in 2019, down by 59.0% and down by 1.13%, respectively, compared to the previous year. This translates into a net margin of 1.63%. Historically, between 1987 and 201...
By Helgi Library - September 30, 2020
Navistar International stock traded at USD 31.3 per share at the end 2019 implying a market capitalization of USD 3,103 mil. Since the end of 2014, stock has appreciated by -11.6% implying an annual average growth of -2.43% In absolute terms, the value of the co...
By Helgi Library - September 30, 2020
Navistar International stock traded at USD 31.3 per share at the end 2019 translating into a market capitalization of USD 3,103 mil. Since the end of 2014, the stock has depreciated by 11.6% representing an annual average growth of -2.43%. At the end of ...
By Helgi Library - September 30, 2020
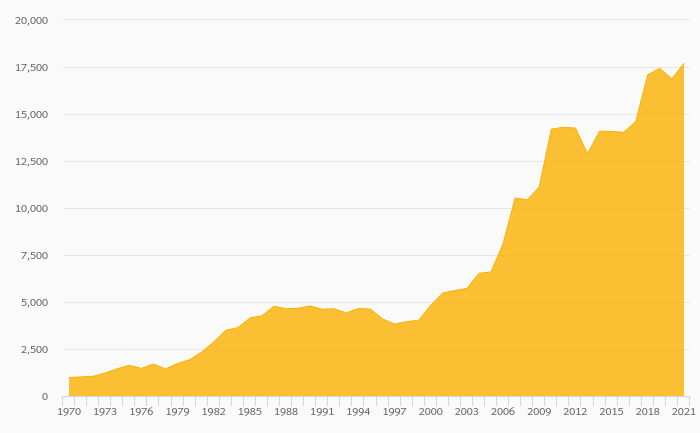
Navistar International's net debt stood at USD 1,944 mil and accounted for -52.0% of equity at the end of 2019. The ratio is up 4.42 pp compared to the previous year. Historically, the firm’s net debt to equity reached a high of 279% in 1992 and ...
By Helgi Library - September 30, 2020
Navistar International made a net profit of USD 174 mil in 2019, down 59% compared to the previous year. Historically, between 1987 and 2019, the company's net profit reached a high of USD 1,576 mil in 2011 and a low of USD -2,980 mil in 2012. The result ...
By Helgi Library - September 30, 2020
Navistar International invested a total of USD 253 mil in 2019, down 25.1% compared to the previous year. Historically, between 2009 - 2019, the company's investments stood at a high of USD 523 mil in 2009 and a low of USD 50.0 mil in 2014. ...

Navistar International has been growing its sales by 0.522% a year on average in the last 5 years. EBITDA has grown by 0% during that time to total of in 2023, or of sales. That’s compared to 6.63% average margin seen in last five years.
The company netted in 2023 implying ROE of and ROCE of . Again, the average figures were -4.61% and 4.53%, respectively when looking at the previous 5 years.
Navistar International’s net debt amounted to at the end of 2023, or of equity. When compared to EBITDA, net debt was x, down when compared to average of 5.46x seen in the last 5 years.
Navistar International stock traded at per share at the end of 2023 resulting in a market capitalization of . Over the previous five years, stock price grew by 0% or % a year on average. The closing price put stock at a 12-month trailing EV/EBITDA of x and price to earnings (PE) of x as of 2023.
 Helgi Library