By Helgi Library - September 29, 2020
Tata Motors made a net profit of INR -98.9 bil with revenues of INR 619 bil in 1Q2020, down by 985% and down by 27.7%, ...
By Helgi Library - November 11, 2020
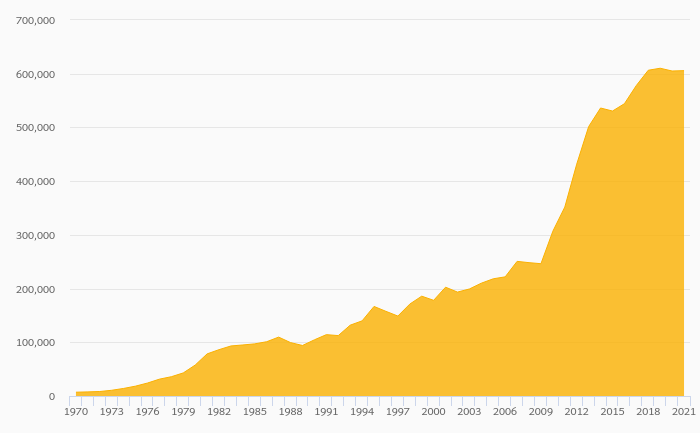
Tata Motors's total assets reached INR 3,221 bil at the end of 1Q2020, up 4.86% compared to the previous year. Cur...
By Helgi Library - October 2, 2020
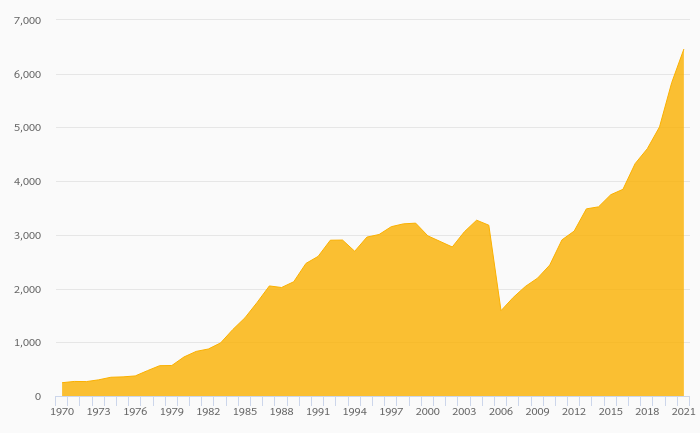
Tata Motors generated sales of INR 619 bil in 1Q2020, down 27.7% compared to the previous year. Historically, between 2...
| Profit Statement |
| Balance Sheet |
| Ratios |
| Valuation |
Get all company financials in excel:
Get all company financials in excel:


By Helgi Library - September 29, 2020
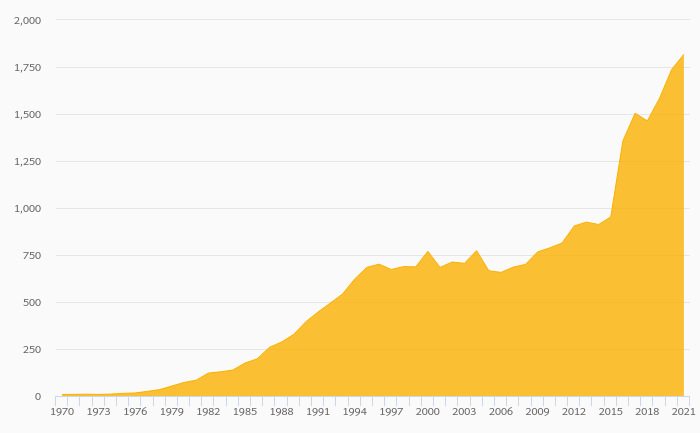
Tata Motors's operating cash flow stood at INR 51.9 bil in 1Q2020, up 63.3% when compared to the previous year. Historically, between 2Q2002 - 1Q2020, the firm’s operating cash flow reached a high of INR 82.9 bil in 3Q2015 and a low of INR -3.26 bil ...
By Helgi Library - September 29, 2020
Tata Motors made a net profit of INR -121 bil with revenues of INR 2,586 bil in 2019, up by 58.1% and down by 13.6%, respectively, compared to the previous year. This translates into a net margin of -4.67%. On the operating level, EBITDA reached INR 89.1 ...
By Helgi Library - September 29, 2020
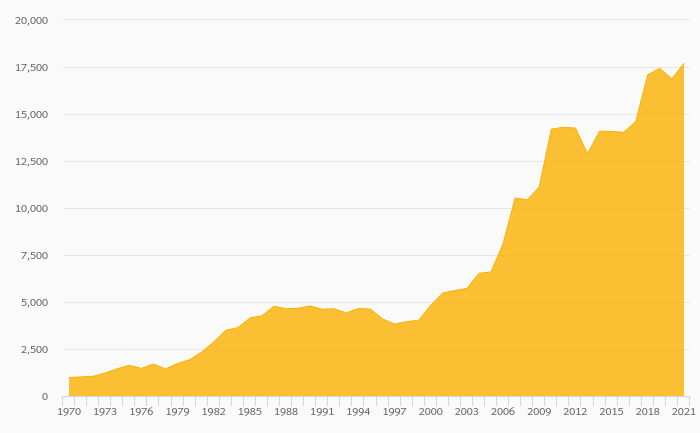
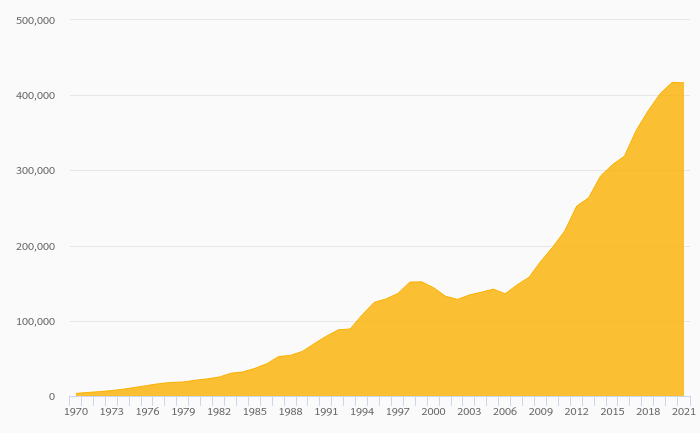
Tata Motors employed 27,802 employees in 2019, down 66.4% compared to the previous year. Historically, between 2002 and 2019, the firm's workforce hit a high of 82,797 employees in 2018 and a low of 27,802 employees in 2019. Average personnel cost st...
By Helgi Library - October 2, 2020
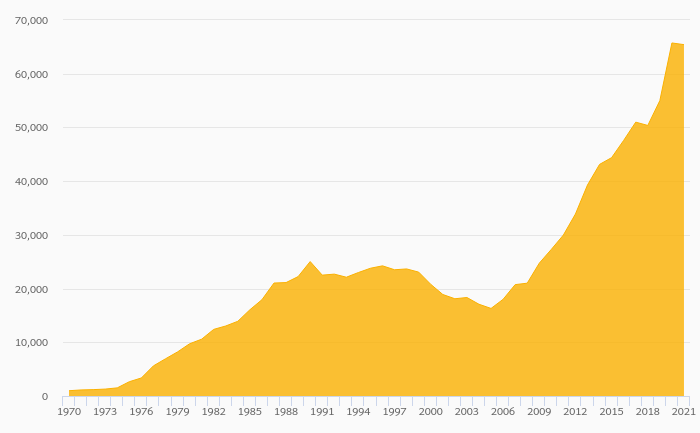
Tata Motors stock traded at INR 174 per share at the end 2019 translating into a market capitalization of USD 8,538 mil. Since the end of 2014, stock has depreciated by 55.6% representing an annual average growth of -15.0%. In absolute terms, the value ...
By Helgi Library - September 29, 2020
Tata Motors's total assets reached INR 3,221 bil at the end of 2019, up 4.86% compared to the previous year. Current assets amounted to INR 1,196 bil, or 37.1% of total assets while cash stood at INR 446 bil at the end of 2019. ...
By Helgi Library - October 2, 2020
Tata Motors stock traded at INR 174 per share at the end 2019 implying a market capitalization of USD 8,538 mil. Since the end of 2014, stock has appreciated by -55.6% implying an annual average growth of -15.0% In absolute terms, the value of the company ...
By Helgi Library - October 2, 2020
Tata Motors made a net profit of INR -121 bil with revenues of INR 2,586 bil in 2019, up by 58.1% and down by 13.6%, respectively, compared to the previous year. This translates into a net margin of -4.67%. Historically, between 1992 and 2019, the f...
By Helgi Library - October 2, 2020
Tata Motors's net debt stood at INR 830 bil and accounted for 130% of equity at the end of 2019. The ratio is up 24.4 pp compared to the previous year. Historically, the firm’s net debt to equity reached a high of 552% in 2008 and a low of 25...
By Helgi Library - October 2, 2020
Tata Motors made a net profit of INR -121 bil in 2019, up 58.1% compared to the previous year. Historically, between 1953 and 2019, the company's net profit reached a high of INR 140 bil in 2013 and a low of INR -288 bil in 2018. The result implies a retu...
By Helgi Library - September 29, 2020
Tata Motors's operating cash flow stood at INR 209 bil in 2019, up 62% when compared to the previous year. Historically, between 2002 - 2019, the firm’s operating cash flow reached a high of INR 330 bil in 2015 and a low of INR -12.9 bil in 2008. ...
Tata Motors Limited is an Indian multinational automotive corporation headquartered in Mumbai, India. It is the 18th largest motor vehicle manufacturing company in the world by volume. It is part of the Tata Group. Its products include passenger cars, trucks, vans and coaches. Tata Motors has been ranked 314th in the Fortune Global 500 rankings of the world's biggest corporations for the year 2012. Worldwide it is the world's fourth largest truck manufacturer and second largest bus manufacturer. It has auto manufacturing and assembly plants in India, as well as in Argentina, South Africa, Thailand and the United Kingdom. Tata Motors has produced and sold over 6.5 mil vehicles in India since 1954. Originally a manufacturer of locomotives, the company manufactured its first commercial vehicle in 1954 in a collaboration with Daimler-Benz AG, which ended in 1969

Tata Motors has been growing its sales by 1.10% a year on average in the last 5 years. EBITDA has grown on average by 13.5% a year during that time to total of INR 369 bil in 2022, or 12.1% of sales. That’s compared to 8.17% average margin seen in last five years.
The company netted INR 54.5 bil in 2022 implying ROE of 8.65% and ROCE of 2.70%. Again, the average figures were -10.7% and -4.11%, respectively when looking at the previous 5 years.
Tata Motors’s net debt amounted to INR 743 bil at the end of 2022, or 113% of equity. When compared to EBITDA, net debt was 2.01x, down when compared to average of 4.37x seen in the last 5 years.
Tata Motors stock traded at INR 134 per share at the end of 2022 resulting in a market capitalization of USD 6,499 mil. Over the previous five years, stock price fell by 71.3% or -22.1% a year on average. The closing price put stock at a 12-month trailing EV/EBITDA of 1.24x and price to earnings (PE) of 8.50x as of 2022.
 Helgi Library