By Helgi Library - November 2, 2019
Union Bank of India's non-performing loans reached 14.9% of total loans at the end of 2018, down from 16.0% compared to the previ...
By Helgi Library - November 2, 2019
Union Bank of India's net interest margin amounted to 2.11% in 2018, up from 2.00% compared to the previous year. Historic...
By Helgi Library - November 2, 2019
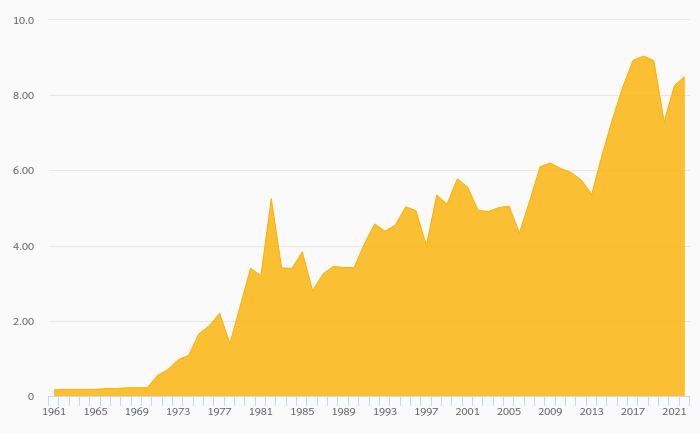
Union Bank of India generated total banking revenues of INR 155 bil in 2018, up 3.38% compared to the previous year. Hist...
| Profit Statement | 2016 | 2017 | 2018 | |
| Net Interest Income | INR bil | 90.4 | 94.8 | 104 |
| Net Fee Income | INR bil | 4.50 | 5.04 | 5.81 |
| Other Income | INR bil | 49.5 | 49.7 | 44.6 |
| Total Revenues | INR bil | 144 | 150 | 155 |
| Operating Profit | INR bil | 69.4 | 59.5 | 76.0 |
| Provisions | INR bil | 66.1 | 125 | 105 |
| Net Profit | INR bil | 5.73 | -52.1 | -29.2 |
| Balance Sheet | 2016 | 2017 | 2018 | |
| Interbank Loans | INR bil | 272 | 353 | 224 |
| Customer Loans | INR bil | 2,771 | 2,837 | 2,988 |
| Total Assets | INR bil | 4,557 | 4,911 | 4,986 |
| Shareholders' Equity | INR bil | 241 | 253 | 268 |
| Interbank Borrowing | INR bil | 37.5 | 29.4 | 0 |
| Customer Deposits | INR bil | 3,689 | 4,033 | 4,175 |
| Issued Debt Securities | INR bil | 472 | 510 | 433 |
| Ratios | 2016 | 2017 | 2018 | |
| ROE | % | 2.43 | -21.1 | -11.2 |
| ROA | % | 0.133 | -1.10 | -0.591 |
| Costs (As % Of Assets) | % | 1.74 | 1.90 | 1.59 |
| Costs (As % Of Income) | % | 51.9 | 60.2 | 50.8 |
| Capital Adequacy Ratio | % | 12.9 | 11.5 | 11.9 |
| Net Interest Margin | % | 2.10 | 2.00 | 2.11 |
| Loans (As % Of Deposits) | % | 75.1 | 70.4 | 71.6 |
| NPLs (As % Of Loans) | % | 11.5 | 16.0 | 14.9 |
| Provisions (As % Of NPLs) | % | 44.1 | 50.7 | 58.3 |
| Valuation | 2016 | 2017 | 2018 | |
| Price/Earnings (P/E) | 18.7 | ... | ... | |
| Price/Book Value (P/BV) | 0.445 | 0.435 | 0.628 | |
| Dividend Yield | % | 0 | 0 | 0 |
| Earnings Per Share (EPS) | INR | 8.33 | -69.0 | -24.9 |
| Book Value Per Share | INR | 351 | 334 | 228 |
| Dividend Per Share | INR | 0 | 0 | 0 |
Get all company financials in excel:
| summary | Unit | 2009 | 2010 | 2011 | 2012 | 2013 | 2014 | 2015 | 2016 | 2017 | 2018 |
| income statement | |||||||||||
| Net Interest Income | INR bil | 75.9 | 79.3 | 85.2 | 84.2 | 90.4 | |||||
| Total Revenues | INR bil | 105 | 111 | 125 | 124 | 144 | |||||
| Operating Profit | INR bil | 48.2 | 47.1 | 56.6 | 56.8 | 69.4 | |||||
| Net Profit | INR bil | 21.6 | 16.8 | 17.6 | 13.6 | 5.73 | |||||
| balance sheet | |||||||||||
| Interbank Loans | INR bil | 177 | 139 | 174 | 222 | 272 | |||||
| Customer Loans | INR bil | 1,958 | 2,201 | 2,461 | 2,601 | 2,771 | |||||
| Debt Securities | INR bil | 817 | 945 | 952 | 904 | 1,132 | |||||
| Total Assets | INR bil | 3,129 | 3,550 | 3,836 | 4,074 | 4,557 | |||||
| Shareholders' Equity | INR bil | 175 | 188 | 199 | 230 | 241 | |||||
| Interbank Borrowing | INR bil | 25.0 | 34.4 | 69.7 | 39.7 | 37.5 | |||||
| Customer Deposits | INR bil | 2,519 | 2,856 | 3,035 | 3,328 | 3,689 | |||||
| Issued Debt Securities | INR bil | 343 | 393 | 433 | 397 | 472 | |||||
| ratios | |||||||||||
| ROE | % | 13.4 | 9.25 | 9.10 | 6.32 | 2.43 | |||||
| ROA | % | 0.749 | 0.502 | 0.477 | 0.343 | 0.133 | |||||
| Costs (As % Of Assets) | % | 1.96 | 1.90 | 1.85 | 1.69 | 1.74 | |||||
| Costs (As % Of Income) | % | 54.0 | 57.5 | 54.6 | 54.0 | 51.9 | |||||
| Capital Adequacy Ratio | % | 11.4 | 10.9 | 10.2 | 10.6 | 12.9 | |||||
| Net Interest Margin | % | 2.64 | 2.37 | 2.31 | 2.13 | 2.10 | |||||
| Interest Income (As % Of Revenues) | % | 72.6 | 71.6 | 68.3 | 68.1 | 62.6 | |||||
| Fee Income (As % Of Revenues) | % | 3.41 | 3.96 | 3.06 | 3.23 | 3.11 | |||||
| Equity (As % Of Assets) | % | 5.58 | 5.29 | 5.19 | 5.66 | 5.29 | |||||
| Loans (As % Of Deposits) | % | 77.7 | 77.1 | 81.1 | 78.1 | 75.1 | |||||
| Loans (As % Assets) | % | 62.6 | 62.0 | 64.2 | 63.8 | 60.8 | |||||
| NPLs (As % Of Loans) | % | 3.18 | 4.26 | 5.17 | 8.94 | 11.5 | |||||
| Provisions (As % Of NPLs) | % | 44.6 | 44.2 | 46.9 | 42.0 | 44.1 | |||||
| valuation | |||||||||||
| Market Capitalisation (End Of Period) | USD mil | 2,375 | 1,401 | 1,578 | 1,356 | 1,577 | |||||
| Number Of Shares (Average) | mil | 552 | 606 | 633 | 662 | 687 | |||||
| Share Price (End Of Period) | INR | 236 | 143 | 157 | 136 | 156 | |||||
| Earnings Per Share (EPS) | INR | 39.1 | 27.7 | 27.8 | 20.5 | 8.33 | |||||
| Book Value Per Share | INR | 316 | 310 | 314 | 348 | 351 | |||||
| Dividend Per Share | INR | 8.65 | 4.16 | 6.02 | 2.03 | 0 | |||||
| Price/Earnings (P/E) | 6.03 | 5.17 | 5.65 | 6.63 | 18.7 | ... | ... | ||||
| Price/Book Value (P/BV) | 0.745 | 0.462 | 0.500 | 0.390 | 0.445 | ||||||
| Dividend Yield | % | 3.67 | 2.91 | 3.83 | 1.49 | 0 | |||||
| Earnings Per Share Growth | % | ... | 15.7 | -29.2 | 0.491 | -26.3 | -59.4 | ||||
| Book Value Per Share Growth | % | ... | 12.0 | -2.11 | 1.50 | 10.8 | 0.643 |
| income statement | Unit | 2009 | 2010 | 2011 | 2012 | 2013 | 2014 | 2015 | 2016 | 2017 | 2018 |
| income statement | |||||||||||
| Interest Income | INR bil | 252 | 294 | 322 | 323 | 328 | |||||
| Interest Cost | INR bil | 176 | 215 | 236 | 239 | 238 | |||||
| Net Interest Income | INR bil | 75.9 | 79.3 | 85.2 | 84.2 | 90.4 | |||||
| Net Fee Income | INR bil | 3.57 | 4.39 | 3.82 | 3.99 | 4.50 | |||||
| Other Income | INR bil | 25.1 | 27.0 | 35.8 | 35.4 | 49.5 | |||||
| Total Revenues | INR bil | 105 | 111 | 125 | 124 | 144 | |||||
| Operating Cost | INR bil | 56.5 | 63.6 | 68.2 | 66.7 | 75.0 | |||||
| Operating Profit | INR bil | 48.2 | 47.1 | 56.6 | 56.8 | 69.4 | |||||
| Provisions | INR bil | 17.8 | 26.7 | 29.0 | 39.2 | 66.1 | |||||
| Extra and Other Cost | INR bil | 0.017 | -0.025 | 0.004 | 0.018 | -0.258 | |||||
| Pre-Tax Profit | INR bil | 30.4 | 20.4 | 27.6 | 17.6 | 3.59 | |||||
| Tax | INR bil | 9.06 | 3.71 | 10.0 | 4.15 | -2.08 | |||||
| Minorities | INR bil | -0.108 | 0.106 | 0.104 | -0.090 | 0 | |||||
| Net Profit | INR bil | 21.6 | 16.8 | 17.6 | 13.6 | 5.73 | |||||
| Dividends | INR bil | 4.77 | 2.52 | 3.81 | 1.34 | 0 | |||||
| growth rates | |||||||||||
| Net Interest Income Growth | % | ... | 9.68 | 4.39 | 7.54 | -1.21 | 7.35 | ||||
| Net Fee Income Growth | % | ... | -0.477 | 23.0 | -13.0 | 4.48 | 12.9 | ||||
| Total Revenue Growth | % | ... | 13.2 | 5.76 | 12.8 | -0.997 | 16.9 | ||||
| Operating Cost Growth | % | ... | 17.2 | 12.6 | 7.26 | -2.13 | 12.4 | ||||
| Operating Profit Growth | % | ... | 8.90 | -2.25 | 20.3 | 0.369 | 22.2 | ||||
| Pre-Tax Profit Growth | % | ... | 13.3 | -32.8 | 35.2 | -36.3 | -79.6 | ||||
| Net Profit Growth | % | ... | 21.7 | -22.3 | 5.04 | -23.0 | -57.8 | ||||
| market share | |||||||||||
| Market Share in Revenues | % | ... | ... | 4.43 | 4.10 | 4.11 | 3.67 | 3.59 | ... | ||
| Market Share in Net Profit | % | ... | ... | 3.64 | 3.11 | 3.23 | 3.30 | ... | ... | ... |
| balance sheet | Unit | 2009 | 2010 | 2011 | 2012 | 2013 | 2014 | 2015 | 2016 | 2017 | 2018 |
| balance sheet | |||||||||||
| Cash | INR bil | 108 | 184 | 151 | 156 | 165 | |||||
| Interbank Loans | INR bil | 177 | 139 | 174 | 222 | 272 | |||||
| Customer Loans | INR bil | 1,958 | 2,201 | 2,461 | 2,601 | 2,771 | |||||
| Debt Securities | INR bil | 817 | 945 | 952 | 904 | 1,132 | |||||
| Fixed Assets | INR bil | 25.0 | 26.2 | 26.9 | 39.5 | 39.2 | |||||
| Total Assets | INR bil | 3,129 | 3,550 | 3,836 | 4,074 | 4,557 | |||||
| Shareholders' Equity | INR bil | 175 | 188 | 199 | 230 | 241 | |||||
| Of Which Minority Interest | INR bil | 0.298 | 0.192 | 0.088 | 0 | 0 | |||||
| Liabilities | INR bil | 2,955 | 3,363 | 3,637 | 3,843 | 4,316 | |||||
| Interbank Borrowing | INR bil | 25.0 | 34.4 | 69.7 | 39.7 | 37.5 | |||||
| Customer Deposits | INR bil | 2,519 | 2,856 | 3,035 | 3,328 | 3,689 | |||||
| Sight Deposits | INR bil | 232 | 219 | 205 | 292 | 233 | |||||
| Term Deposits | INR bil | 2,287 | 2,637 | 2,830 | 3,036 | 3,456 | |||||
| Issued Debt Securities | INR bil | 343 | 393 | 433 | 397 | 472 | |||||
| Other Liabilities | INR bil | 67.5 | 79.3 | 98.7 | 78.2 | 117 | |||||
| asset quality | |||||||||||
| Non-Performing Loans | INR bil | 63.1 | 95.6 | 130 | 242 | 337 | |||||
| Gross Loans | INR bil | 1,986 | 2,243 | 2,522 | 2,702 | 2,920 | |||||
| Total Provisions | INR bil | 28.2 | 42.2 | 61.1 | 101 | 149 | |||||
| growth rates | |||||||||||
| Customer Loan Growth | % | ... | 18.2 | 12.4 | 11.8 | 5.69 | 6.56 | ||||
| Total Asset Growth | % | ... | 19.0 | 13.5 | 8.04 | 6.20 | 11.9 | ||||
| Shareholders' Equity Growth | % | ... | 17.8 | 7.47 | 6.09 | 15.8 | 4.54 | ||||
| Customer Deposit Growth | % | ... | 18.2 | 13.4 | 6.27 | 9.64 | 10.9 | ||||
| market share | |||||||||||
| Market Share in Customer Loans | % | 3.55 | 3.42 | 3.47 | 3.26 | 3.36 | ... | ||||
| Market Share in Total Assets | % | 3.60 | 3.51 | 3.44 | 3.23 | 3.21 | ... | ||||
| Market Share in Customer Deposits | % | 4.00 | 3.97 | 3.72 | 3.64 | 3.47 | ... |
| ratios | Unit | 2009 | 2010 | 2011 | 2012 | 2013 | 2014 | 2015 | 2016 | 2017 | 2018 |
| ratios | |||||||||||
| ROE | % | 13.4 | 9.25 | 9.10 | 6.32 | 2.43 | |||||
| ROA | % | 0.749 | 0.502 | 0.477 | 0.343 | 0.133 | |||||
| Costs (As % Of Assets) | % | 1.96 | 1.90 | 1.85 | 1.69 | 1.74 | |||||
| Costs (As % Of Income) | % | 54.0 | 57.5 | 54.6 | 54.0 | 51.9 | |||||
| Capital Adequacy Ratio | % | 11.4 | 10.9 | 10.2 | 10.6 | 12.9 | |||||
| Tier 1 Ratio | % | 8.24 | 7.64 | 7.53 | 8.20 | 9.07 | |||||
| Net Interest Margin | % | 2.64 | 2.37 | 2.31 | 2.13 | 2.10 | |||||
| Interest Spread | % | ... | 2.27 | 2.00 | 1.95 | 1.78 | 1.78 | ||||
| Asset Yield | % | 8.74 | 8.80 | 8.71 | 8.17 | 7.60 | |||||
| Cost Of Liabilities | % | ... | 6.47 | 6.80 | 6.76 | 6.39 | 5.83 | ||||
| Payout Ratio | % | 22.1 | 15.0 | 21.7 | 9.88 | 0 | |||||
| Interest Income (As % Of Revenues) | % | 72.6 | 71.6 | 68.3 | 68.1 | 62.6 | |||||
| Fee Income (As % Of Revenues) | % | 3.41 | 3.96 | 3.06 | 3.23 | 3.11 | |||||
| Other Income (As % Of Revenues) | % | 24.0 | 24.4 | 28.6 | 28.6 | 34.3 | |||||
| Equity (As % Of Assets) | % | 5.58 | 5.29 | 5.19 | 5.66 | 5.29 | |||||
| Loans (As % Of Deposits) | % | 77.7 | 77.1 | 81.1 | 78.1 | 75.1 | |||||
| Loans (As % Assets) | % | 62.6 | 62.0 | 64.2 | 63.8 | 60.8 | |||||
| NPLs (As % Of Loans) | % | 3.18 | 4.26 | 5.17 | 8.94 | 11.5 | |||||
| Provisions (As % Of NPLs) | % | 44.6 | 44.2 | 46.9 | 42.0 | 44.1 | |||||
| Provisions (As % Of Loans) | % | 1.44 | 1.92 | 2.48 | 3.90 | 5.37 | |||||
| Cost of Provisions (As % Of Loans) | % | 0.983 | 1.28 | 1.25 | 1.55 | 2.46 |
| other data | Unit | 2009 | 2010 | 2011 | 2012 | 2013 | 2014 | 2015 | 2016 | 2017 | 2018 |
| other data | |||||||||||
| Employees | 31,798 | 33,806 | 35,514 | 35,473 | 36,877 | ||||||
| Sight (As % Of Customer Deposits) | % | 9.20 | 7.67 | 6.75 | 8.78 | 6.32 |
Get all company financials in excel:

By Helgi Library - November 2, 2019
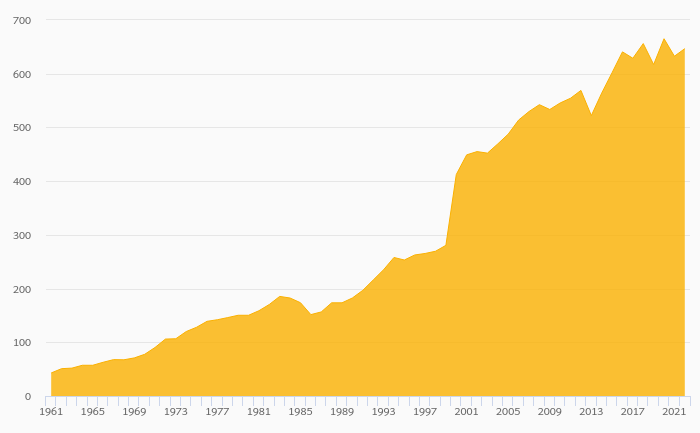
Union Bank of India's capital adequacy ratio reached 11.9% at the end of 2018, up from 11.5% compared to the previous year. Historically, the bank’s capital ratio hit an all time high of 13.0% in 2010 and an all time low of 10.2% in 2014. The Tier 1 ratio amo...
By Helgi Library - November 2, 2019
Union Bank of India's customer loan growth reached 5.32% in 2018, up from 2.37% compared to the previous year. Historically, the bank’s loans growth reached an all time high of 21.9% in 2010 and an all time low of 2.37% in 2017. In the last decade, the av...
By Helgi Library - November 2, 2019
Union Bank of India generated total banking revenues of INR 150 bil in 2017, up 3.51% compared to the previous year. Indian banking sector banking sector generated total revenues of INR 4,320,359 mil in 2017, up 7.41% when compared to the last year. ...
By Helgi Library - November 2, 2019
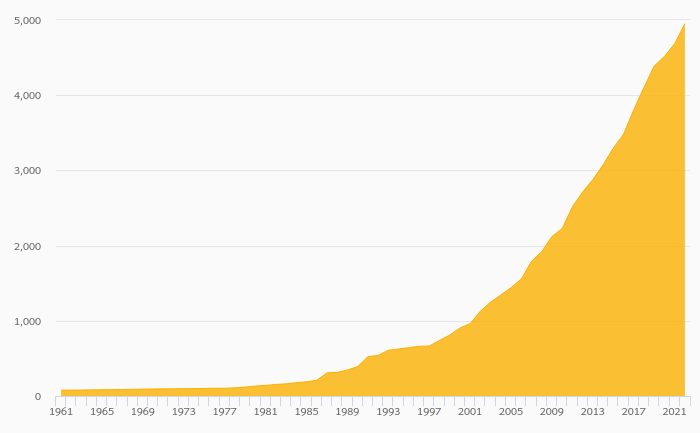
Union Bank of India's customer deposits reached INR 4,033 bil in 2017, up 9.30% compared to the previous year. Indian banking sector accepted customer deposits of INR 110,303 bil in 2017, up 3.61% when compared to the last year. Union Bank of India accoun...
By Helgi Library - November 2, 2019
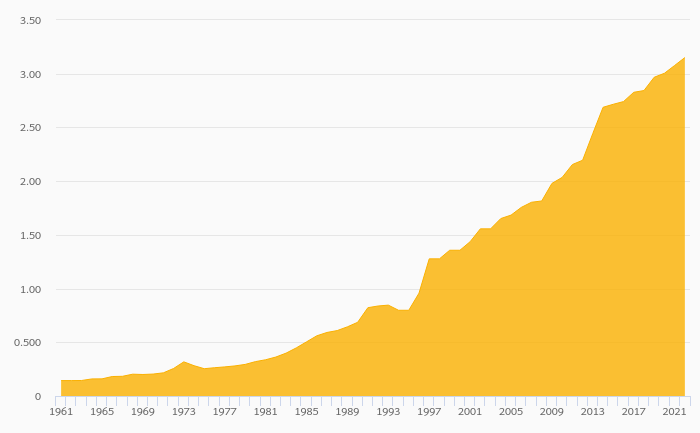
Union Bank of India's customer loans reached INR 2,837 bil in 2017, up 2.37% compared to the previous year. Indian banking sector provided customer loans of INR 88,362 bil in 2017, up 7.04% when compared to the last year. Union Bank of India accounted for...
By Helgi Library - November 2, 2019
Union Bank of India stock traded at INR 156 per share at the end 2016 implying a market capitalization of USD 1,577 mil. Since the end of 2011, the stock has depreciated by -37.0 % implying an annual average growth of -8.83 %. In absolute terms, the value of the compa...
By Helgi Library - November 2, 2019
Union Bank of India stock traded at INR 156 per share at the end of 2016 implying a market capitalization of USD 1,577 mil. Since the end of 2011, the stock has depreciated by -37.0 % implying an annual average growth of -8.83 %. In absolute terms, the value of the co...

Union Bank of India has been growing its revenues and asset by % and % a year on average in the last 10 years. Its loans and deposits have grown by % and % a year during that time and loans to deposits ratio reached 71.6% at the end of 2018. The company achieved an average return on equity of 5.96% in the last decade with net profit growing % a year on average. In terms of operating efficiency, its cost to income ratio reached 50.8% in 2018, compared to 52.6% average in the last decade.
Equity represented 5.38% of total assets or 8.98% of loans at the end of 2018. Union Bank of India's non-performing loans were 14.9% of total loans while provisions covered some 58.3% of NPLs at the end of 2018.
Union Bank of India stock traded at INR 143 per share at the end of 2018 resulting in a market capitalization of USD 2,415 mil. Over the previous five years, stock price rose by 0.355% or 0.07099999999999999% a year on average. That’s compared to an average ROE of -2.90% the bank generated for its shareholders. This closing price put stock at a 12-month trailing price to earnings (PE) of x and price to book value (PBV) of 0.628x in 2018.
 Helgi Library